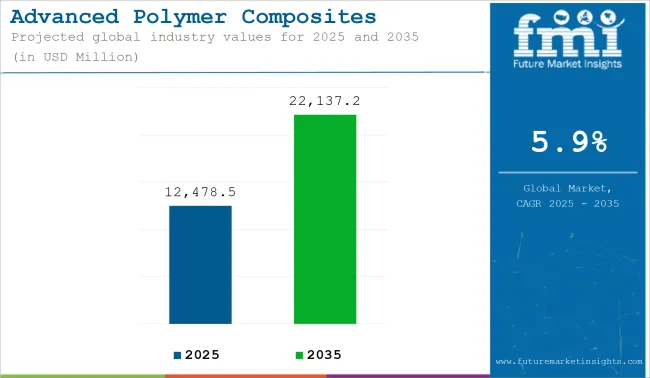
The global advanced polymer composites (APC) market is estimated to record sales of USD 12,478.5 million in 2025 and is forecast to reach a valuation of USD 22,137.2 million by 2035, reflecting a CAGR of 5.9% over the assessment period. In 2024, the market revenue was recorded at USD 11,783.3 million, with a projected year-on-year growth of 5.3% in 2025.
The adoption of advanced polymer composites is being driven by the automotive, aerospace, and renewable energy sectors, where weight reduction, structural strength, and environmental compliance are prioritized. Within the automotive industry, electric vehicle manufacturers have initiated large-scale use of APCs such as carbon fiber and thermoplastic composites in battery enclosures, structural frames, and body panels.
This substitution is intended to enhance vehicle range by reducing overall weight. According to the European Automobile Manufacturers Association (ACEA), EV registrations in Europe increased by 37% in 2023, signaling higher composite material demand.
In the renewable energy segment, advanced composites are being employed in wind turbine blade manufacturing. The integration of long, lightweight, and high-performance blades is being pursued to increase energy capture efficiency. Offshore wind installations, particularly in the North Sea and China’s coastal regions, are contributing to increased material consumption due to harsher operational environments. As per the Global Wind Energy Council (GWEC), over 10 GW of offshore capacity was added globally in 2023.

| Attributes | Key Insights |
|---|---|
| Estimated Size, 2025 | USD 12,478.5 million |
| Projected Size, 2035 | USD 22,137.2 million |
| Value-based CAGR (2025 to 2035) | 5.9% |
Infrastructure applications across emerging markets in Asia, Africa, and Latin America are supporting further APC adoption. Composites are being specified for bridges, water pipelines, and public infrastructure where resistance to corrosion, low lifecycle maintenance, and mechanical strength are required. These applications are being supported by public-private investments targeting long-term durability in high-load environments.
Manufacturers are investing in process innovations such as automated fiber placement and resin transfer molding to meet large-volume orders. Sourcing diversification for high-performance fibers and polymers is being pursued to manage material costs and trade uncertainties.
As per the International Association for Advanced Composites (IAAC), sustained capital expenditure and technology transfer initiatives are expected to support the global diffusion of APCs into broader industrial applications by 2035.
The table below presents the annual growth rates of the global advanced polymer composites industry from 2025 to 2035. With a base year of 2024 extending to the current year 2025, the report examines how the sector's growth trajectory evolves from the first half of the year (January to June, H1) to the second half (July to December, H2). This analysis offers stakeholders insights into the industry's performance over time, highlighting potential developments that may emerge.
These figures indicate the growth of the sector in each half year, between the years 2024 and 2025. The industry is expected to grow at a CAGR of 4.5% in H1-2024. In H2, the growth rate increases.
| Particular | Value CAGR |
|---|---|
| H1 (2024 to 2034) | 4.5% |
| H2 (2024 to 2034) | 4.6% |
| H1 (2025 to 2035) | 4.0% |
| H2 (2025 to 2035) | 4.7% |
Moving into the subsequent period, from H1 2025 to H2 2025, the CAGR is projected to slightly decrease to 4.0% in the first half and relatively increase to 4.7% in the second half. In the first half (H1), the sector saw an increase of 10 BPS while in the second half (H2), there was a slight increase of 10 BPS.
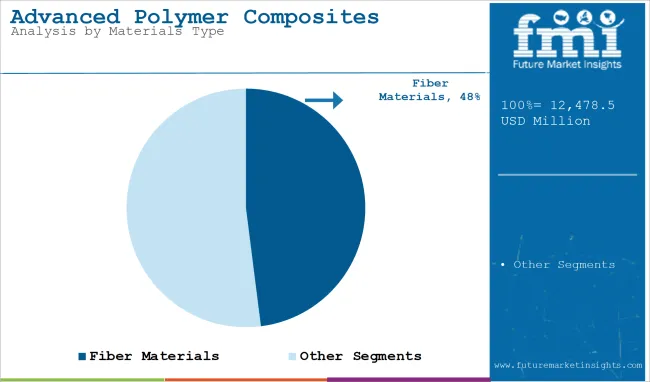
Fiber materials are estimated to account for approximately 48% of the global advanced polymer composite market share in 2025 and are projected to grow at a CAGR of 6.1% through 2035. These include carbon fibers, aramid fibers, and glass fibers, which provide exceptional strength-to-weight ratio, impact resistance, and fatigue performance.
Demand is particularly strong in industries such as aerospace, automotive, and renewable energy where structural efficiency, lightweighting, and thermal stability are key. Manufacturers continue to develop advanced fiber weaves and hybrid laminates to meet the evolving mechanical and environmental requirements of end-use sectors. The integration of fiber-reinforced composites into electric vehicle components, pressure vessels, and rotor blades further supports long-term growth.

Aviation parts are projected to account for nearly 31% of the global advanced polymer composite market share in 2025 and are expected to grow at a CAGR of 6.2% through 2035. The aerospace industry continues to adopt advanced composites to replace metal components in fuselages, wings, interior panels, and engine nacelles, aiming to reduce fuel consumption and improve payload efficiency.
These materials offer high stiffness, corrosion resistance, and design flexibility critical for both commercial and defense aviation platforms. OEMs in the USA, France, and Germany are expanding partnerships with composite suppliers to meet increased demand for next-generation aircraft and comply with decarbonization mandates. As aviation platforms evolve toward lighter, more efficient airframes, advanced polymer composites remain essential to structural innovation and performance optimization.
Growing Use of Composites in Electric Vehicles
Electric vehicles are revolutionizing the automotive world. The energy efficiency of such vehicles and high driving ranges make lightweight materials like Advanced Polymer Composites inevitable.
Advanced Polymer Composites are used for battery cases, vehicle bodies, and structural parts. For example, BMW uses carbon fiber composites in its i3 electric vehicle. This car reduces the weight of the vehicle while making it strong and safe.
These global trends in electric mobility further promote it. The current governments have set incentives for producing electric vehicles, which is being introduced especially in Asia Pacific areas.
Countries such as China and South Korea, through their latest and advanced composites in EVs, are furthering this cause. The need for electric vehicles will automatically drive the usage of composites within this industry.
Rising Demand in Infrastructure Projects
Emerging economies are heavily investing in new infrastructure projects, with Advanced Polymer Composites (APCs) being utilized in bridges, buildings, and pipelines due to their strength, durability, and corrosion resistance.
For instance, the Dubai Metro system incorporated composites in structural reinforcements, contributing to the creation of a long-lasting, low-maintenance infrastructure.
In the developing regions of Asia, Africa, and North America, governments are focusing on sustainable construction. Composites are ideal for infrastructure projects due to their long-term cost-saving benefits. As urbanization accelerates, the demand for Advanced Polymer Composites (APCs) in infrastructure development is expected to grow steadily.
High-Performance Composites in Sports Equipment
Sporting equipment is subjected to multiple levels of stress and fatigue during the service life. The performance of players solely rely on the quality of equipment they use to pursue their professional career, fitness activity or as a hobby.
Use of high performance composites is gaining traction among the manufacturers to design the equipment using these composites to enhance product quality and durability. The sports industry is using advanced polymer composites to develop better equipment.
They are used in items such as bicycles, tennis rackets, and helmets to make them lighter and stronger. For instance, Wilson Sporting Goods uses carbon fiber composites in its tennis rackets to enhance performance.
Composites also provide improved safety features in extreme sport equipment through absorbing impacts. More people are investing in sports and recreation, which further fuels the increased demand for superior materials in the sector. Professionals and teams have also been encouraging innovation, thereby sustaining the trend.
Additive Manufacturing Expanding Composite Applications
3D printing is changing the way composites are manufactured and used. This technology enables manufacturers to produce precise shapes with minimal waste. For instance, Airbus uses 3D-printed composite parts in its A350 aircraft. These parts are lightweight and improve fuel efficiency.
With composite materials, companies are now specifically developing materials for 3D printing. This is opening new avenues in the aerospace, automotive, and healthcare industries. The greater availability of 3D printing will make composites more flexible and affordable for niche applications.
High Production Costs Due to Complex Manufacturing Processes and Expensive Raw Materials
High production cost is one big challenge in APCs market. A lot of technological processes such as resin infusion autoclaving filament winding are adopted in the formation of APCs. These also require specialized and skilled workers so that the cost of production for APCs happens to be significantly higher than usual materials such as metals or plastics.
For example, carbon composites are not easy to fabricate since proper curing conditions can only be achieved under extremely controlled temperature and pressure.
Raw materials also account for a substantial portion of the high cost. High-grade carbon fibers, thermoplastics, and specialty resins are integral to APC manufacturing but are costly. For example, carbon fiber, the one material used in the high-performance production of APCs, costs considerably more than glass fiber.
This limits its applicability to niche industries such as aerospace and high-end automotive manufacturing where the emphasis is on high-performance products.
These high production costs make APCs less competitive in price-sensitive markets such as construction or mass-market automotive production. Small and medium enterprises, especially, face a barrier to entry in the form of the capital required to take up these materials.
The market's growth will remain constrained by high costs unless advancements in technology enhance production efficiency or raw material prices decline.
Tier 1 companies include industry leaders with annual revenues exceeding USD 300 - 350 million. These companies are currently capturing a significant share of 20-25% globally. These frontrunners are characterized by high production capacity and a wide product portfolio.
These companies stand out due to their extensive expertise in manufacturing and broad geographical reach, supported by a robust consumer base.
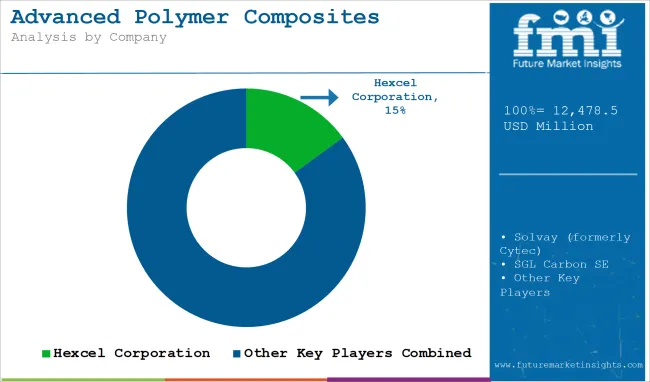
They offer a wide range of products and leverage the latest technology to meet regulatory standards. Prominent companies within Tier 1 include BASF SE, DuPont, Formosa Plastics Corporation, Hexcel Corporation and others.
Tier 2 companies encompass mid-sized participants with revenues ranging from USD 100 - 250 million, holding a presence in specific regions and exerting significant influence in local economies. These firms are distinguished by robust presence overseas and in-depth industry expertise.
They possess strong technology capabilities and adhere strictly to regulatory requirements. However, the firms may not wield cutting-edge technology or maintain an extensive global reach. Noteworthy entities in Tier 2 include Hexion, Honeywell International Inc. and Solvay.
Tier 3 encompasses most of the small-scale enterprises operating within the regional sphere and catering to specialized needs with revenues below USD 50 - 100 million. These businesses are notably focused on meeting local demand and are hence categorized within the Tier 3 segment.
They are small-scale participants with limited geographical presence. In this context, Tier 3 is acknowledged as an informal sector, indicating a segment distinguished by a lack of extensive organization and formal structure in comparison to the structured one. Tier 3 includes Teijin Aramid B.V., Toray Industries Inc. and TPI Composite Inc.
The section below highlights assessments of Advanced Polymer Composites sale across key countries. USA, China, Germany region, and Turkey are expected to showcase promising double-digit growth, with each exhibiting a strong CAGR through the forecast period.
| Countries | Value CAGR (2025 to 2035) |
|---|---|
| USA | 6.3% |
| China | 5.9% |
| Germany | 5.4% |
| India | 5.0% |
| Mexico | 4.1% |
The United States is one of the strong consumers of Advanced Polymer Composites (APCs). Strong industries in aerospace, automotive, and renewable energy drive much demand in this commodity.
The aerospace industry is also the major driver as companies like Boeing utilize APCs to make aircraft parts like wings and fuselages lightweight. This assists in fuel consumption and compliance with strong environmental requirements. Defense applications of composites in the USA further increase demand.
Renewable energy is another significant growth area. Wind farms in states like Texas and California rely on APCs to manufacture robust and lightweight wind turbine blades.
Offshore wind projects are becoming more popular, which increases the demand for composites that can withstand harsh marine conditions. The automotive sector, spearheaded by Tesla, employs APCs in EVs to minimize weight and maximize battery efficiency. The USA also invests heavily in research to improve composite production, thus making it a leader in this market.
China is an extremely fast growth area for Advanced Polymer Composites. Its automobile production is the largest in the world, driving a great portion of this demand. Battery housing and vehicle parts are being made with APCs by leaders in the electric-vehicle industry, such as BYD and NIO, which help improve energy efficiency. As the production of EVs grows, so does the demand for APCs.
China is also a global leader in renewable energy, especially in wind power. The country is investing heavily in onshore and offshore wind farms, where strong, lightweight turbine blades are crucial. Infrastructure projects, such as bridges and pipelines, also utilize APCs for their durability and low maintenance requirements. Government policies supporting green energy and sustainable construction increase the demand for composites in China.
Japan is an essential consumer of Advanced Polymer Composites, thanks to its strong drive for technology and sustainability. Many Japanese car companies, including Toyota and Honda, rely on APCs for building lightweight, fuel-efficient electric and hybrid cars.
Composites help in using more structural parts, as well as battery housing in vehicles to optimize performance while abiding by environment-friendly rules.
Japan is increasing its renewable energy capacity, which includes offshore wind farms. Composite-made turbine blades are lightweight and strong, while being durable, making them the best for hostile marine environments.
The aerospace industry of Japan uses composite materials in their commercial and defense applications, offering strength and reliability. Japan's commitment to innovation and sustainable material use supports growing demand for APCs across several industries.

The advanced polymer composites market is growing rapidly as industries demand lightweight, high-performance materials. Key players are enhancing properties like thermal stability, strength, and chemical resistance to meet the needs of sectors such as aerospace, automotive, and renewable energy.
Companies are optimizing production processes for cost-effectiveness and scalability, while partnerships with research institutions drive innovation. There is a strong shift towards sustainability, with investments in bio-based composites and recycling technologies.
As fuel efficiency and durability become critical, the adoption of polymer composites is rising. Regulatory pressures are also pushing for the development of eco-friendly alternatives, ensuring long-term market growth. Technological advancements and broader industrial applications are expected to further fuel demand.
In terms of material type, the industry is divided into Resin, Fiber and Others (fillers, additives, modifiers, etc.)
In terms of process the industry is divided into Prepreg, Filament Winding, Pultrusion, Resin Infusion.
In terms of application, the industry is segmented into Conductors, Autoparts, Tanks & pipes, Aviation parts, Boat building, Wind blades and Others
The report covers key regions, including North America, Latin America, Western Europe, Eastern Europe, East Asia, South Asia, and the Middle East and Africa (MEA).
The global market was valued at USD 11,783.3 million in 2024.
The global market is set to reach USD 12,478.5 million in 2025.
Global demand is anticipated to rise at 5.9% CAGR.
The industry is projected to reach USD 22,137.2 million by 2035.
BASF SE, DuPont, Formosa Plastics Corporation, Hexcel Corporation, Hexion are prominent companies.


Full Research Suite comprises of:
Market outlook & trends analysis
Interviews & case studies
Strategic recommendations
Vendor profiles & capabilities analysis
5-year forecasts
8 regions and 60+ country-level data splits
Market segment data splits
12 months of continuous data updates
DELIVERED AS:
PDF EXCEL ONLINE
Advanced Driver Assistance System (ADAS) Testing Equipment Market Size and Share Forecast Outlook 2025 to 2035
Advanced Lead Acid Battery Market Size and Share Forecast Outlook 2025 to 2035
Advanced Energy Storage System Market Size and Share Forecast Outlook 2025 to 2035
Advanced Gear Shifter System Market Size and Share Forecast Outlook 2025 to 2035
Advanced Therapeutics Pharmaceutical Outsourcing Market Size and Share Forecast Outlook 2025 to 2035
Advanced Airport Technologies Market Size and Share Forecast Outlook 2025 to 2035
Advanced Air Mobility Market Size and Share Forecast Outlook 2025 to 2035
Advanced Sensor Market Size and Share Forecast Outlook 2025 to 2035
Advanced Combat Helmet Market Size and Share Forecast Outlook 2025 to 2035
Advanced Optics Material Market Size and Share Forecast Outlook 2025 to 2035
Advanced Functional Materials Market Size and Share Forecast Outlook 2025 to 2035
Advanced Drill Data Management Solutions Market Size and Share Forecast Outlook 2025 to 2035
Advanced Water Management And Filtration Equipment Market Size and Share Forecast Outlook 2025 to 2035
Advanced Coating Market Size and Share Forecast Outlook 2025 to 2035
Advanced Aerospace Coatings Industry Analysis in Europe - Size, Share, and Forecast 2025 to 2035
Advanced Tires Market Size and Share Forecast Outlook 2025 to 2035
Advanced Therapy Medicinal Products Market Size and Share Forecast Outlook 2025 to 2035
Advanced Glass Market Size and Share Forecast Outlook 2025 to 2035
Advanced Server Energy Monitoring Tools Market Size and Share Forecast Outlook 2025 to 2035
Advanced Sports Materials Market Size and Share Forecast Outlook 2025 to 2035

Thank you!
You will receive an email from our Business Development Manager. Please be sure to check your SPAM/JUNK folder too.
Chat With
MaRIA