Reports
- Global Locations -
Headquarters
Future Market Insights, Inc.
Christiana Corporate, 200
Continental Drive, Suite 401,
Newark, Delaware - 19713,
United States
Americas
Future Market Insights, Inc.
616 Corporate Way, Suite 2-9018,
Valley Cottage, NY 10989, United States
MEA
Future Market Insights
1602-6 Jumeirah Bay X2 Tower, Plot No: JLT-PH2-X2A,
Jumeirah Lakes Towers, Dubai,
United Arab Emirates
Europe
Future Market Insights
3rd Floor, 207 Regent Street,
W1B 3HH London
United Kingdom
Asia Pacific
Future Market Insights
Office No. 401-A, 4th Floor,
VANTAGE 9, S.No. 36/1/1,
Baner, Pune 411045, India
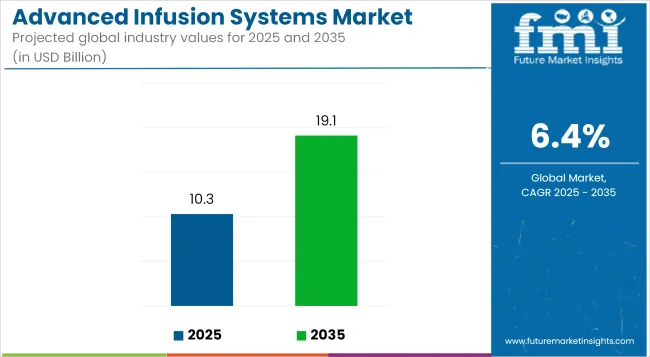
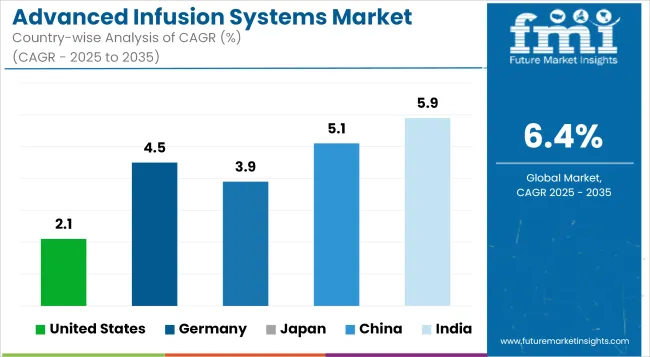
The advanced infusion system market is projected to be valued at US$ 8,862.8 million in 2023 and is expected to rise to US$ 16,536.9 million by 2033. The sales of advanced infusion systems are expected to record a significant CAGR of 6.4% during the forecast period.
There is increased adoption of advanced infusion systems as these systems are being widely used to dispense fluids as well as drugs into a patient’s body for medication purposes. The common routes through which fluids are transferred with the help of an infusion system are subcutaneous, epidural or enteral, and intravenous.
The flow of drugs can be monitored and as well controlled with the help of advanced infusion systems. Due to high mortality rates associated with other methods of drug administration, the preference for advanced infusion systems is considerably increasing.
Therefore, it is anticipated that global advanced infusion systems are likely to have significant growth over the forecast period.
Attributes | Details |
---|---|
Advanced Infusion System Market CAGR | 6.4% |
Advanced Infusion System Market Valuation (2023) | US$ 8,862.8 million |
Advanced Infusion System Market Valuation (2033) | US$ 16,536.9 million |
Don't pay for what you don't need
Customize your report by selecting specific countries or regions and save 30%!
Many factors are identified within the advanced infusion systems forum that are likely to contribute to the expansion of the market size. Despite these influential factors, several challenges have also been identified by the experts of FMI during analysis.
DRIVERS
Factors | Description |
---|---|
The Rise in Chronic Diseases | It is anticipated that there are rising incidences of cardiovascular diseases and chronic diseases leading to diabetes, which Is the prime driving factor in the advanced infusion systems market. |
Increasing Healthcare Facilities | Many investments are being made within the healthcare sector that largely contribute to the growth of the advanced infusion system market. Gastronomical diseases, cancer, and other diseases catalyze the market's development. |
RESTRAINTS
Factors | Description |
---|---|
Rising Concern about Safety | The improper disposable infusion pumps and the rising concerns about the safety of patients are leading to create several consequences, and the unmet medical needs in low-income countries are likely to hamper the growth of the global advanced infusion system market. |
Lack of Expertise | It is anticipated that there are risks associated with the systems due to improper training facilities to operate these devices, which is likely to act as a significant restraint in the advancement of the concerned market. |
OPPORTUNITIES
Factors | Description |
---|---|
Benefits of Intravenous Infusion System | The benefit of the intravenous infusion system in administering medication, amino acids, minerals, and several essential micronutrients can create opportunities infusion system market by adding to the infusion for collateral nutrition. |
Technological Advances | Smart infusion systems are technologically advanced with automation, drug libraries, operators, and safety features for accurate and precise results for patients. It also helps in delivering controlled fluids into the patient systems. |
THREATS
Factors | Description |
---|---|
Stringent Regulations | The stringent regulation of governments for launching new device approval is the key factor that poses a threat to the advanced infusion systems market during the forecast period. |
Let’s take a stroll across the drivers, restraints, opportunities, and threats (Drivers, Restraints, Opportunities, and Threats) prevailing in the advanced infusion systems market.
Advanced Infusion System Market:
Attributes | Advanced Infusion System Market |
---|---|
CAGR (2023 to 2033) | 6.4% |
Market Value (2033) | US$ 16,536.9 million |
Growth Factor | It is anticipated that there are rising incidences of cardiovascular diseases and chronic diseases leading to diabetes, which is the prime driving factor in the advanced infusion systems market. |
Opportunity | The benefit of the intravenous infusion system in administering medication, amino acids, minerals, and several essential micronutrients can create opportunities infusion system market by adding to the infusion for collateral nutrition. |
Infusion Pumps Market:
Attributes | Infusion Pumps Market |
---|---|
CAGR (2023 to 2033) | 5.00% |
Market Value (2033) | US$ 5.35 billion |
Growth Factor | The increasing prevalence of chronic diseases, as well as the rapid increase in the elderly population, are driving market growth. |
Opportunity | Growing demand for infusion pumps and specialty infusion systems in developing markets presents significant growth opportunities for the various market participants. |
Intraosseous Infusion Devices Market:
Attributes | Intraosseous Infusion Devices Market |
---|---|
CAGR (2023 to 2033) | 6.9% |
Market Value (2033) | US$ 5.48 billion |
Growth Factor | The rising prevalence of cardiovascular diseases is expected to drive market growth over the forecast period. |
Opportunity | Increased physician and patient awareness of newly introduced treatment procedures and technologies are supporting market growth. |
North America is likely to hold the maximum share and dominate the global advanced infusion system market in the coming years. Currently, the North American Regions are cumulatively holding 33.5% of the total market share of advanced infusion systems.
The reasons for expanding market size can be attributed to:
High adoption of ambulatory pumps in managing chronic diseases, there is a high prevalence of rising penetration of advanced infusion systems in this region.
The rising healthcare infrastructure in North America is also expected to significantly contribute to the growth and expansion of the market in this region.
Europe is anticipated to follow the North American market and hold the second-leading share in the global advanced infusion system market. At present, Europe is accountable for 32.1% of the total market share for advanced infusion systems.
The expansion of the market can be attributed to the factors like:
The vast patient population and the increasing incidence of chronic diseases bolstered the market growth for advanced infusion systems in North America.
Changing lifestyles coupled with increasing accessibility to advanced products and rising disposable income is another crucial factor influencing the market in Europe.
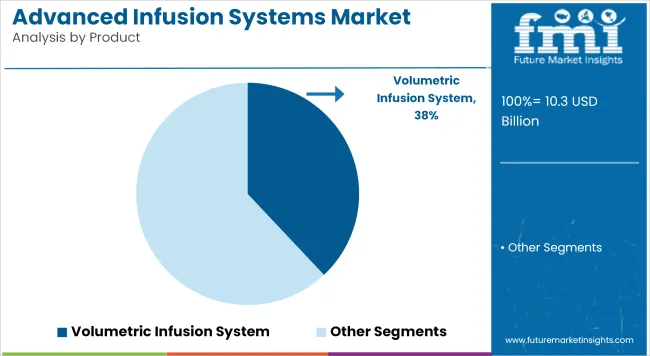
The volumetric infusion system holds a significant share of 34.70% in the advanced infusion system market. Volumetric infusion systems are widely used in healthcare settings to deliver precise and controlled volumes of fluids and medications to patients. These systems utilize advanced technology and features to measure and administer fluids accurately, ensuring patient safety and effective therapy.
The volumetric infusion system market encompasses various devices, including electronic volumetric pumps and syringe pumps used in hospitals, clinics, and other medical facilities. The growing demand for accurate and reliable infusion delivery, particularly in critical care and complex medical procedures, has contributed to the prominence of volumetric infusion systems in the advanced market. These systems offer programmable flow rates, advanced safety features, intuitive user interfaces, and integration with electronic health records (EHRs) for seamless data management.
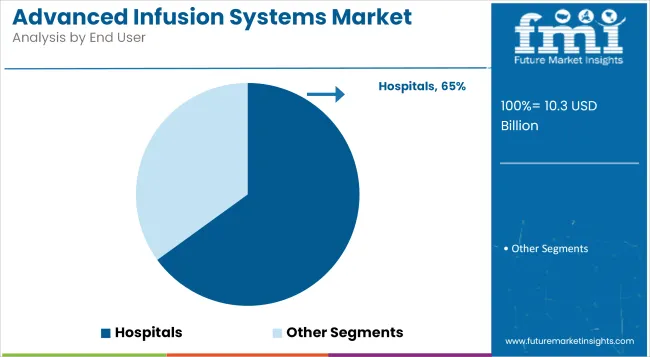
Hospitals are likely to account for more than 38.39% of the market share by end users in 2022.
Advanced infusion systems play a vital role in hospital settings, where accurate and controlled delivery of fluids and medications is crucial for patient care. These systems are extensively used in various hospital departments, including intensive care units, operating rooms, emergency departments, and general wards. Several factors drive the demand for advanced infusion systems in hospitals.
The increasing prevalence of chronic diseases, the rise in complex medical procedures, and the growing elderly population contribute to the need for advanced infusion therapy in hospitals. Additionally, technological advancements and the integration of smart features in infusion systems enhance their usability, safety, and efficiency in hospital environments.
Advanced infusion systems in hospitals offer benefits such as programmable flow rates, dose calculations, drug library management, wireless connectivity, and real-time monitoring capabilities. These features enable healthcare professionals to deliver medications and fluids accurately, track infusion parameters, and ensure patient safety. As hospitals strive to improve patient outcomes and streamline healthcare processes, the demand for advanced infusion systems is expected to continue to grow, solidifying their significant share in the advanced infusion system market
Get the data you need at a Fraction of the cost
Personalize your report by choosing insights you need
and save 40%!
Key Market Players Adding an Edge with Diverse Attempts
The biggies of the advanced infusion system market are continually making efforts and having collaborations to create high-end infusion systems and benefit the patients with more equipped and advanced solutions.
Recent Developments
In January 2020, Medtronic (Ireland) Launched Efficio, a cloud-based data management software, for use with the SynchroMed II intrathecal drug delivery system. This enables clinicians to efficiently manage their targeted drug delivery pump practices to treat patients with chronic pain, cancer, and severe spasticity.
In March 2020, Q Core Medical Company opened a new manufacturing unit in Europe to capitalize on the opportunities offered by the advanced infusion systems market due to the increasing geriatric population and increasing demand for the adoption of infusion systems in healthcare, therapeutic effectiveness, and reliability.
Attributes | Details |
---|---|
Forecast Period | 2023 to 2033 |
Historical Data Available for | 2018 to 2022 |
Market Analysis | US$ billion for Value |
Key Countries Covered | United States, Canada, Germany, United Kingdom, France, Italy, Spain, Russia, China, Japan, South Korea, India, Thailand, Malaysia, Indonesia, Australia, New Zealand, GCC Countries, Northern Africa, and South Africa |
Key Segments Covered |
|
Key Companies Profiled |
|
Report Coverage | Market Forecast, Company Share Analysis, Competition Intelligence, DROT Analysis, Market Dynamics and Challenges, and Strategic Growth Initiatives |
Customization & Pricing | Available upon Request |
1. Executive Summary 1.1. Global Market Outlook 1.2. Demand-side Trends 1.3. Supply-side Trends 1.4. Technology Roadmap Analysis 1.5. Analysis and Recommendations 2. Market Overview 2.1. Market Coverage / Taxonomy 2.2. Market Definition / Scope / Limitations 3. Market Background 3.1. Market Dynamics 3.1.1. Drivers 3.1.2. Restraints 3.1.3. Opportunity 3.1.4. Trends 3.2. Scenario Forecast 3.2.1. Demand in Optimistic Scenario 3.2.2. Demand in Likely Scenario 3.2.3. Demand in Conservative Scenario 3.3. Opportunity Map Analysis 3.4. Product Life Cycle Analysis 3.5. Supply Chain Analysis 3.5.1. Supply Side Participants and their Roles 3.5.1.1. Producers 3.5.1.2. Mid-Level Participants (Traders/ Agents/ Brokers) 3.5.1.3. Wholesalers and Distributors 3.5.2. Value Added and Value Created at Node in the Supply Chain 3.5.3. List of Raw Material Suppliers 3.5.4. List of Existing and Potential Buyer’s 3.6. Investment Feasibility Matrix 3.7. Value Chain Analysis 3.7.1. Profit Margin Analysis 3.7.2. Wholesalers and Distributors 3.7.3. Retailers 3.8. PESTLE and Porter’s Analysis 3.9. Regulatory Landscape 3.9.1. By Key Regions 3.9.2. By Key Countries 3.10. Regional Parent Market Outlook 3.11. Production and Consumption Statistics 3.12. Import and Export Statistics 4. Global Market Analysis 2018 to 2022 and Forecast, 2023 to 2033 4.1. Historical Market Size Value (US$ Million) & Volume (Units) Analysis, 2018 to 2022 4.2. Current and Future Market Size Value (US$ Million) & Volume (Units) Projections, 2023 to 2033 4.2.1. Y-o-Y Growth Trend Analysis 4.2.2. Absolute $ Opportunity Analysis 5. Global Market Analysis 2018 to 2022 and Forecast 2023 to 2033, By Product 5.1. Introduction / Key Findings 5.2. Historical Market Size Value (US$ Million) & Volume (Units) Analysis By Product, 2018 to 2022 5.3. Current and Future Market Size Value (US$ Million) & Volume (Units) Analysis and Forecast By Product, 2023 to 2033 5.3.1. Elastomeric infusion system 5.3.2. Volumetric infusion system 5.3.3. Patient Controlled Analgesia pump 5.3.4. Disposable infusion system 5.3.5. Syringe infusion system 5.3.6. Ambulatory infusion system 5.3.7. Implantable infusion system 5.4. Y-o-Y Growth Trend Analysis By Product, 2018 to 2022 5.5. Absolute $ Opportunity Analysis By Product, 2023 to 2033 6. Global Market Analysis 2018 to 2022 and Forecast 2023 to 2033, By Application 6.1. Introduction / Key Findings 6.2. Historical Market Size Value (US$ Million) & Volume (Units) Analysis By Application, 2018 to 2022 6.3. Current and Future Market Size Value (US$ Million) & Volume (Units) Analysis and Forecast By Application, 2023 to 2033 6.3.1. Chemotherapy 6.3.2. Diabetes 6.3.3. Pain management 6.3.4. Asthma 6.3.5. Clinical Nutrition 6.4. Y-o-Y Growth Trend Analysis By Application, 2018 to 2022 6.5. Absolute $ Opportunity Analysis By Application, 2023 to 2033 7. Global Market Analysis 2018 to 2022 and Forecast 2023 to 2033, By End-User 7.1. Introduction / Key Findings 7.2. Historical Market Size Value (US$ Million) & Volume (Units) Analysis By End-User, 2018 to 2022 7.3. Current and Future Market Size Value (US$ Million) & Volume (Units) Analysis and Forecast By End-User, 2023 to 2033 7.3.1. Hospitals 7.3.2. Ambulatory Surgical Centers 7.3.3. Diagnostic centers 7.3.4. Bedside 7.4. Y-o-Y Growth Trend Analysis By End-User, 2018 to 2022 7.5. Absolute $ Opportunity Analysis By End-User, 2023 to 2033 8. Global Market Analysis 2018 to 2022 and Forecast 2023 to 2033, By Region 8.1. Introduction 8.2. Historical Market Size Value (US$ Million) & Volume (Units) Analysis By Region, 2018 to 2022 8.3. Current Market Size Value (US$ Million) & Volume (Units) Analysis and Forecast By Region, 2023 to 2033 8.3.1. North America 8.3.2. Latin America 8.3.3. Western Europe 8.3.4. Eastern Europe 8.3.5. South Asia and Pacific 8.3.6. East Asia 8.3.7. Middle East and Africa 8.4. Market Attractiveness Analysis By Region 9. North America Market Analysis 2018 to 2022 and Forecast 2023 to 2033, By Country 9.1. Historical Market Size Value (US$ Million) & Volume (Units) Trend Analysis By Market Taxonomy, 2018 to 2022 9.2. Market Size Value (US$ Million) & Volume (Units) Forecast By Market Taxonomy, 2023 to 2033 9.2.1. By Country 9.2.1.1. USA. 9.2.1.2. Canada 9.2.2. By Product 9.2.3. By Application 9.2.4. By End-User 9.3. Market Attractiveness Analysis 9.3.1. By Country 9.3.2. By Product 9.3.3. By Application 9.3.4. By End-User 9.4. Key Takeaways 10. Latin America Market Analysis 2018 to 2022 and Forecast 2023 to 2033, By Country 10.1. Historical Market Size Value (US$ Million) & Volume (Units) Trend Analysis By Market Taxonomy, 2018 to 2022 10.2. Market Size Value (US$ Million) & Volume (Units) Forecast By Market Taxonomy, 2023 to 2033 10.2.1. By Country 10.2.1.1. Brazil 10.2.1.2. Mexico 10.2.1.3. Rest of Latin America 10.2.2. By Product 10.2.3. By Application 10.2.4. By End-User 10.3. Market Attractiveness Analysis 10.3.1. By Country 10.3.2. By Product 10.3.3. By Application 10.3.4. By End-User 10.4. Key Takeaways 11. Western Europe Market Analysis 2018 to 2022 and Forecast 2023 to 2033, By Country 11.1. Historical Market Size Value (US$ Million) & Volume (Units) Trend Analysis By Market Taxonomy, 2018 to 2022 11.2. Market Size Value (US$ Million) & Volume (Units) Forecast By Market Taxonomy, 2023 to 2033 11.2.1. By Country 11.2.1.1. Germany 11.2.1.2. United Kingdom. 11.2.1.3. France 11.2.1.4. Spain 11.2.1.5. Italy 11.2.1.6. Rest of Western Europe 11.2.2. By Product 11.2.3. By Application 11.2.4. By End-User 11.3. Market Attractiveness Analysis 11.3.1. By Country 11.3.2. By Product 11.3.3. By Application 11.3.4. By End-User 11.4. Key Takeaways 12. Eastern Europe Market Analysis 2018 to 2022 and Forecast 2023 to 2033, By Country 12.1. Historical Market Size Value (US$ Million) & Volume (Units) Trend Analysis By Market Taxonomy, 2018 to 2022 12.2. Market Size Value (US$ Million) & Volume (Units) Forecast By Market Taxonomy, 2023 to 2033 12.2.1. By Country 12.2.1.1. Poland 12.2.1.2. Russia 12.2.1.3. Czech Republic 12.2.1.4. Romania 12.2.1.5. Rest of Eastern Europe 12.2.2. By Product 12.2.3. By Application 12.2.4. By End-User 12.3. Market Attractiveness Analysis 12.3.1. By Country 12.3.2. By Product 12.3.3. By Application 12.3.4. By End-User 12.4. Key Takeaways 13. South Asia and Pacific Market Analysis 2018 to 2022 and Forecast 2023 to 2033, By Country 13.1. Historical Market Size Value (US$ Million) & Volume (Units) Trend Analysis By Market Taxonomy, 2018 to 2022 13.2. Market Size Value (US$ Million) & Volume (Units) Forecast By Market Taxonomy, 2023 to 2033 13.2.1. By Country 13.2.1.1. India 13.2.1.2. Bangladesh 13.2.1.3. Australia 13.2.1.4. New Zealand 13.2.1.5. Rest of South Asia and Pacific 13.2.2. By Product 13.2.3. By Application 13.2.4. By End-User 13.3. Market Attractiveness Analysis 13.3.1. By Country 13.3.2. By Product 13.3.3. By Application 13.3.4. By End-User 13.4. Key Takeaways 14. East Asia Market Analysis 2018 to 2022 and Forecast 2023 to 2033, By Country 14.1. Historical Market Size Value (US$ Million) & Volume (Units) Trend Analysis By Market Taxonomy, 2018 to 2022 14.2. Market Size Value (US$ Million) & Volume (Units) Forecast By Market Taxonomy, 2023 to 2033 14.2.1. By Country 14.2.1.1. China 14.2.1.2. Japan 14.2.1.3. South Korea 14.2.2. By Product 14.2.3. By Application 14.2.4. By End-User 14.3. Market Attractiveness Analysis 14.3.1. By Country 14.3.2. By Product 14.3.3. By Application 14.3.4. By End-User 14.4. Key Takeaways 15. Middle East and Africa Market Analysis 2018 to 2022 and Forecast 2023 to 2033, By Country 15.1. Historical Market Size Value (US$ Million) & Volume (Units) Trend Analysis By Market Taxonomy, 2018 to 2022 15.2. Market Size Value (US$ Million) & Volume (Units) Forecast By Market Taxonomy, 2023 to 2033 15.2.1. By Country 15.2.1.1. GCC Countries 15.2.1.2. South Africa 15.2.1.3. Israel 15.2.1.4. Rest of MEA 15.2.2. By Product 15.2.3. By Application 15.2.4. By End-User 15.3. Market Attractiveness Analysis 15.3.1. By Country 15.3.2. By Product 15.3.3. By Application 15.3.4. By End-User 15.4. Key Takeaways 16. Key Countries Market Analysis 16.1. USA. 16.1.1. Pricing Analysis 16.1.2. Market Share Analysis, 2022 16.1.2.1. By Product 16.1.2.2. By Application 16.1.2.3. By End-User 16.2. Canada 16.2.1. Pricing Analysis 16.2.2. Market Share Analysis, 2022 16.2.2.1. By Product 16.2.2.2. By Application 16.2.2.3. By End-User 16.3. Brazil 16.3.1. Pricing Analysis 16.3.2. Market Share Analysis, 2022 16.3.2.1. By Product 16.3.2.2. By Application 16.3.2.3. By End-User 16.4. Mexico 16.4.1. Pricing Analysis 16.4.2. Market Share Analysis, 2022 16.4.2.1. By Product 16.4.2.2. By Application 16.4.2.3. By End-User 16.5. Germany 16.5.1. Pricing Analysis 16.5.2. Market Share Analysis, 2022 16.5.2.1. By Product 16.5.2.2. By Application 16.5.2.3. By End-User 16.6. United Kingdom. 16.6.1. Pricing Analysis 16.6.2. Market Share Analysis, 2022 16.6.2.1. By Product 16.6.2.2. By Application 16.6.2.3. By End-User 16.7. France 16.7.1. Pricing Analysis 16.7.2. Market Share Analysis, 2022 16.7.2.1. By Product 16.7.2.2. By Application 16.7.2.3. By End-User 16.8. Spain 16.8.1. Pricing Analysis 16.8.2. Market Share Analysis, 2022 16.8.2.1. By Product 16.8.2.2. By Application 16.8.2.3. By End-User 16.9. Italy 16.9.1. Pricing Analysis 16.9.2. Market Share Analysis, 2022 16.9.2.1. By Product 16.9.2.2. By Application 16.9.2.3. By End-User 16.10. Poland 16.10.1. Pricing Analysis 16.10.2. Market Share Analysis, 2022 16.10.2.1. By Product 16.10.2.2. By Application 16.10.2.3. By End-User 16.11. Russia 16.11.1. Pricing Analysis 16.11.2. Market Share Analysis, 2022 16.11.2.1. By Product 16.11.2.2. By Application 16.11.2.3. By End-User 16.12. Czech Republic 16.12.1. Pricing Analysis 16.12.2. Market Share Analysis, 2022 16.12.2.1. By Product 16.12.2.2. By Application 16.12.2.3. By End-User 16.13. Romania 16.13.1. Pricing Analysis 16.13.2. Market Share Analysis, 2022 16.13.2.1. By Product 16.13.2.2. By Application 16.13.2.3. By End-User 16.14. India 16.14.1. Pricing Analysis 16.14.2. Market Share Analysis, 2022 16.14.2.1. By Product 16.14.2.2. By Application 16.14.2.3. By End-User 16.15. Bangladesh 16.15.1. Pricing Analysis 16.15.2. Market Share Analysis, 2022 16.15.2.1. By Product 16.15.2.2. By Application 16.15.2.3. By End-User 16.16. Australia 16.16.1. Pricing Analysis 16.16.2. Market Share Analysis, 2022 16.16.2.1. By Product 16.16.2.2. By Application 16.16.2.3. By End-User 16.17. New Zealand 16.17.1. Pricing Analysis 16.17.2. Market Share Analysis, 2022 16.17.2.1. By Product 16.17.2.2. By Application 16.17.2.3. By End-User 16.18. China 16.18.1. Pricing Analysis 16.18.2. Market Share Analysis, 2022 16.18.2.1. By Product 16.18.2.2. By Application 16.18.2.3. By End-User 16.19. Japan 16.19.1. Pricing Analysis 16.19.2. Market Share Analysis, 2022 16.19.2.1. By Product 16.19.2.2. By Application 16.19.2.3. By End-User 16.20. South Korea 16.20.1. Pricing Analysis 16.20.2. Market Share Analysis, 2022 16.20.2.1. By Product 16.20.2.2. By Application 16.20.2.3. By End-User 16.21. GCC Countries 16.21.1. Pricing Analysis 16.21.2. Market Share Analysis, 2022 16.21.2.1. By Product 16.21.2.2. By Application 16.21.2.3. By End-User 16.22. South Africa 16.22.1. Pricing Analysis 16.22.2. Market Share Analysis, 2022 16.22.2.1. By Product 16.22.2.2. By Application 16.22.2.3. By End-User 16.23. Israel 16.23.1. Pricing Analysis 16.23.2. Market Share Analysis, 2022 16.23.2.1. By Product 16.23.2.2. By Application 16.23.2.3. By End-User 17. Market Structure Analysis 17.1. Competition Dashboard 17.2. Competition Benchmarking 17.3. Market Share Analysis of Top Players 17.3.1. By Regional 17.3.2. By Product 17.3.3. By Application 17.3.4. By End-User 18. Competition Analysis 18.1. Competition Deep Dive 18.1.1. TERUMO CORPORATION 18.1.1.1. Overview 18.1.1.2. Product Portfolio 18.1.1.3. Profitability by Market Segments 18.1.1.4. Sales Footprint 18.1.1.5. Strategy Overview 18.1.1.5.1. Marketing Strategy 18.1.1.5.2. Product Strategy 18.1.1.5.3. Channel Strategy 18.1.2. AIS HealthCare 18.1.2.1. Overview 18.1.2.2. Product Portfolio 18.1.2.3. Profitability by Market Segments 18.1.2.4. Sales Footprint 18.1.2.5. Strategy Overview 18.1.2.5.1. Marketing Strategy 18.1.2.5.2. Product Strategy 18.1.2.5.3. Channel Strategy 18.1.3. B. Braun Medical Ltd 18.1.3.1. Overview 18.1.3.2. Product Portfolio 18.1.3.3. Profitability by Market Segments 18.1.3.4. Sales Footprint 18.1.3.5. Strategy Overview 18.1.3.5.1. Marketing Strategy 18.1.3.5.2. Product Strategy 18.1.3.5.3. Channel Strategy 18.1.4. Medtronic 18.1.4.1. Overview 18.1.4.2. Product Portfolio 18.1.4.3. Profitability by Market Segments 18.1.4.4. Sales Footprint 18.1.4.5. Strategy Overview 18.1.4.5.1. Marketing Strategy 18.1.4.5.2. Product Strategy 18.1.4.5.3. Channel Strategy 18.1.5. Baxter 18.1.5.1. Overview 18.1.5.2. Product Portfolio 18.1.5.3. Profitability by Market Segments 18.1.5.4. Sales Footprint 18.1.5.5. Strategy Overview 18.1.5.5.1. Marketing Strategy 18.1.5.5.2. Product Strategy 18.1.5.5.3. Channel Strategy 18.1.6. MOOG INC. 18.1.6.1. Overview 18.1.6.2. Product Portfolio 18.1.6.3. Profitability by Market Segments 18.1.6.4. Sales Footprint 18.1.6.5. Strategy Overview 18.1.6.5.1. Marketing Strategy 18.1.6.5.2. Product Strategy 18.1.6.5.3. Channel Strategy 18.1.7. armed ag 18.1.7.1. Overview 18.1.7.2. Product Portfolio 18.1.7.3. Profitability by Market Segments 18.1.7.4. Sales Footprint 18.1.7.5. Strategy Overview 18.1.7.5.1. Marketing Strategy 18.1.7.5.2. Product Strategy 18.1.7.5.3. Channel Strategy 18.1.8. AVA Biomedical 18.1.8.1. Overview 18.1.8.2. Product Portfolio 18.1.8.3. Profitability by Market Segments 18.1.8.4. Sales Footprint 18.1.8.5. Strategy Overview 18.1.8.5.1. Marketing Strategy 18.1.8.5.2. Product Strategy 18.1.8.5.3. Channel Strategy 18.1.9. BD 18.1.9.1. Overview 18.1.9.2. Product Portfolio 18.1.9.3. Profitability by Market Segments 18.1.9.4. Sales Footprint 18.1.9.5. Strategy Overview 18.1.9.5.1. Marketing Strategy 18.1.9.5.2. Product Strategy 18.1.9.5.3. Channel Strategy 18.1.10. Smiths Group plc. 18.1.10.1. Overview 18.1.10.2. Product Portfolio 18.1.10.3. Profitability by Market Segments 18.1.10.4. Sales Footprint 18.1.10.5. Strategy Overview 18.1.10.5.1. Marketing Strategy 18.1.10.5.2. Product Strategy 18.1.10.5.3. Channel Strategy 19. Assumptions & Acronyms Used 20. Research Methodology
Don't pay for what you don't need
Customize your report by selecting specific countries or regions and save 30%!
Table 1: Global Market Value (US$ Million) Forecast by Region, 2018 to 2033 Table 2: Global Market Volume (Units) Forecast by Region, 2018 to 2033 Table 3: Global Market Value (US$ Million) Forecast by Product, 2018 to 2033 Table 4: Global Market Volume (Units) Forecast by Product, 2018 to 2033 Table 5: Global Market Value (US$ Million) Forecast by Application, 2018 to 2033 Table 6: Global Market Volume (Units) Forecast by Application, 2018 to 2033 Table 7: Global Market Value (US$ Million) Forecast by End-User, 2018 to 2033 Table 8: Global Market Volume (Units) Forecast by End-User, 2018 to 2033 Table 9: North America Market Value (US$ Million) Forecast by Country, 2018 to 2033 Table 10: North America Market Volume (Units) Forecast by Country, 2018 to 2033 Table 11: North America Market Value (US$ Million) Forecast by Product, 2018 to 2033 Table 12: North America Market Volume (Units) Forecast by Product, 2018 to 2033 Table 13: North America Market Value (US$ Million) Forecast by Application, 2018 to 2033 Table 14: North America Market Volume (Units) Forecast by Application, 2018 to 2033 Table 15: North America Market Value (US$ Million) Forecast by End-User, 2018 to 2033 Table 16: North America Market Volume (Units) Forecast by End-User, 2018 to 2033 Table 17: Latin America Market Value (US$ Million) Forecast by Country, 2018 to 2033 Table 18: Latin America Market Volume (Units) Forecast by Country, 2018 to 2033 Table 19: Latin America Market Value (US$ Million) Forecast by Product, 2018 to 2033 Table 20: Latin America Market Volume (Units) Forecast by Product, 2018 to 2033 Table 21: Latin America Market Value (US$ Million) Forecast by Application, 2018 to 2033 Table 22: Latin America Market Volume (Units) Forecast by Application, 2018 to 2033 Table 23: Latin America Market Value (US$ Million) Forecast by End-User, 2018 to 2033 Table 24: Latin America Market Volume (Units) Forecast by End-User, 2018 to 2033 Table 25: Western Europe Market Value (US$ Million) Forecast by Country, 2018 to 2033 Table 26: Western Europe Market Volume (Units) Forecast by Country, 2018 to 2033 Table 27: Western Europe Market Value (US$ Million) Forecast by Product, 2018 to 2033 Table 28: Western Europe Market Volume (Units) Forecast by Product, 2018 to 2033 Table 29: Western Europe Market Value (US$ Million) Forecast by Application, 2018 to 2033 Table 30: Western Europe Market Volume (Units) Forecast by Application, 2018 to 2033 Table 31: Western Europe Market Value (US$ Million) Forecast by End-User, 2018 to 2033 Table 32: Western Europe Market Volume (Units) Forecast by End-User, 2018 to 2033 Table 33: Eastern Europe Market Value (US$ Million) Forecast by Country, 2018 to 2033 Table 34: Eastern Europe Market Volume (Units) Forecast by Country, 2018 to 2033 Table 35: Eastern Europe Market Value (US$ Million) Forecast by Product, 2018 to 2033 Table 36: Eastern Europe Market Volume (Units) Forecast by Product, 2018 to 2033 Table 37: Eastern Europe Market Value (US$ Million) Forecast by Application, 2018 to 2033 Table 38: Eastern Europe Market Volume (Units) Forecast by Application, 2018 to 2033 Table 39: Eastern Europe Market Value (US$ Million) Forecast by End-User, 2018 to 2033 Table 40: Eastern Europe Market Volume (Units) Forecast by End-User, 2018 to 2033 Table 41: South Asia and Pacific Market Value (US$ Million) Forecast by Country, 2018 to 2033 Table 42: South Asia and Pacific Market Volume (Units) Forecast by Country, 2018 to 2033 Table 43: South Asia and Pacific Market Value (US$ Million) Forecast by Product, 2018 to 2033 Table 44: South Asia and Pacific Market Volume (Units) Forecast by Product, 2018 to 2033 Table 45: South Asia and Pacific Market Value (US$ Million) Forecast by Application, 2018 to 2033 Table 46: South Asia and Pacific Market Volume (Units) Forecast by Application, 2018 to 2033 Table 47: South Asia and Pacific Market Value (US$ Million) Forecast by End-User, 2018 to 2033 Table 48: South Asia and Pacific Market Volume (Units) Forecast by End-User, 2018 to 2033 Table 49: East Asia Market Value (US$ Million) Forecast by Country, 2018 to 2033 Table 50: East Asia Market Volume (Units) Forecast by Country, 2018 to 2033 Table 51: East Asia Market Value (US$ Million) Forecast by Product, 2018 to 2033 Table 52: East Asia Market Volume (Units) Forecast by Product, 2018 to 2033 Table 53: East Asia Market Value (US$ Million) Forecast by Application, 2018 to 2033 Table 54: East Asia Market Volume (Units) Forecast by Application, 2018 to 2033 Table 55: East Asia Market Value (US$ Million) Forecast by End-User, 2018 to 2033 Table 56: East Asia Market Volume (Units) Forecast by End-User, 2018 to 2033 Table 57: Middle East and Africa Market Value (US$ Million) Forecast by Country, 2018 to 2033 Table 58: Middle East and Africa Market Volume (Units) Forecast by Country, 2018 to 2033 Table 59: Middle East and Africa Market Value (US$ Million) Forecast by Product, 2018 to 2033 Table 60: Middle East and Africa Market Volume (Units) Forecast by Product, 2018 to 2033 Table 61: Middle East and Africa Market Value (US$ Million) Forecast by Application, 2018 to 2033 Table 62: Middle East and Africa Market Volume (Units) Forecast by Application, 2018 to 2033 Table 63: Middle East and Africa Market Value (US$ Million) Forecast by End-User, 2018 to 2033 Table 64: Middle East and Africa Market Volume (Units) Forecast by End-User, 2018 to 2033
Figure 1: Global Market Value (US$ Million) by Product, 2023 to 2033 Figure 2: Global Market Value (US$ Million) by Application, 2023 to 2033 Figure 3: Global Market Value (US$ Million) by End-User, 2023 to 2033 Figure 4: Global Market Value (US$ Million) by Region, 2023 to 2033 Figure 5: Global Market Value (US$ Million) Analysis by Region, 2018 to 2033 Figure 6: Global Market Volume (Units) Analysis by Region, 2018 to 2033 Figure 7: Global Market Value Share (%) and BPS Analysis by Region, 2023 to 2033 Figure 8: Global Market Y-o-Y Growth (%) Projections by Region, 2023 to 2033 Figure 9: Global Market Value (US$ Million) Analysis by Product, 2018 to 2033 Figure 10: Global Market Volume (Units) Analysis by Product, 2018 to 2033 Figure 11: Global Market Value Share (%) and BPS Analysis by Product, 2023 to 2033 Figure 12: Global Market Y-o-Y Growth (%) Projections by Product, 2023 to 2033 Figure 13: Global Market Value (US$ Million) Analysis by Application, 2018 to 2033 Figure 14: Global Market Volume (Units) Analysis by Application, 2018 to 2033 Figure 15: Global Market Value Share (%) and BPS Analysis by Application, 2023 to 2033 Figure 16: Global Market Y-o-Y Growth (%) Projections by Application, 2023 to 2033 Figure 17: Global Market Value (US$ Million) Analysis by End-User, 2018 to 2033 Figure 18: Global Market Volume (Units) Analysis by End-User, 2018 to 2033 Figure 19: Global Market Value Share (%) and BPS Analysis by End-User, 2023 to 2033 Figure 20: Global Market Y-o-Y Growth (%) Projections by End-User, 2023 to 2033 Figure 21: Global Market Attractiveness by Product, 2023 to 2033 Figure 22: Global Market Attractiveness by Application, 2023 to 2033 Figure 23: Global Market Attractiveness by End-User, 2023 to 2033 Figure 24: Global Market Attractiveness by Region, 2023 to 2033 Figure 25: North America Market Value (US$ Million) by Product, 2023 to 2033 Figure 26: North America Market Value (US$ Million) by Application, 2023 to 2033 Figure 27: North America Market Value (US$ Million) by End-User, 2023 to 2033 Figure 28: North America Market Value (US$ Million) by Country, 2023 to 2033 Figure 29: North America Market Value (US$ Million) Analysis by Country, 2018 to 2033 Figure 30: North America Market Volume (Units) Analysis by Country, 2018 to 2033 Figure 31: North America Market Value Share (%) and BPS Analysis by Country, 2023 to 2033 Figure 32: North America Market Y-o-Y Growth (%) Projections by Country, 2023 to 2033 Figure 33: North America Market Value (US$ Million) Analysis by Product, 2018 to 2033 Figure 34: North America Market Volume (Units) Analysis by Product, 2018 to 2033 Figure 35: North America Market Value Share (%) and BPS Analysis by Product, 2023 to 2033 Figure 36: North America Market Y-o-Y Growth (%) Projections by Product, 2023 to 2033 Figure 37: North America Market Value (US$ Million) Analysis by Application, 2018 to 2033 Figure 38: North America Market Volume (Units) Analysis by Application, 2018 to 2033 Figure 39: North America Market Value Share (%) and BPS Analysis by Application, 2023 to 2033 Figure 40: North America Market Y-o-Y Growth (%) Projections by Application, 2023 to 2033 Figure 41: North America Market Value (US$ Million) Analysis by End-User, 2018 to 2033 Figure 42: North America Market Volume (Units) Analysis by End-User, 2018 to 2033 Figure 43: North America Market Value Share (%) and BPS Analysis by End-User, 2023 to 2033 Figure 44: North America Market Y-o-Y Growth (%) Projections by End-User, 2023 to 2033 Figure 45: North America Market Attractiveness by Product, 2023 to 2033 Figure 46: North America Market Attractiveness by Application, 2023 to 2033 Figure 47: North America Market Attractiveness by End-User, 2023 to 2033 Figure 48: North America Market Attractiveness by Country, 2023 to 2033 Figure 49: Latin America Market Value (US$ Million) by Product, 2023 to 2033 Figure 50: Latin America Market Value (US$ Million) by Application, 2023 to 2033 Figure 51: Latin America Market Value (US$ Million) by End-User, 2023 to 2033 Figure 52: Latin America Market Value (US$ Million) by Country, 2023 to 2033 Figure 53: Latin America Market Value (US$ Million) Analysis by Country, 2018 to 2033 Figure 54: Latin America Market Volume (Units) Analysis by Country, 2018 to 2033 Figure 55: Latin America Market Value Share (%) and BPS Analysis by Country, 2023 to 2033 Figure 56: Latin America Market Y-o-Y Growth (%) Projections by Country, 2023 to 2033 Figure 57: Latin America Market Value (US$ Million) Analysis by Product, 2018 to 2033 Figure 58: Latin America Market Volume (Units) Analysis by Product, 2018 to 2033 Figure 59: Latin America Market Value Share (%) and BPS Analysis by Product, 2023 to 2033 Figure 60: Latin America Market Y-o-Y Growth (%) Projections by Product, 2023 to 2033 Figure 61: Latin America Market Value (US$ Million) Analysis by Application, 2018 to 2033 Figure 62: Latin America Market Volume (Units) Analysis by Application, 2018 to 2033 Figure 63: Latin America Market Value Share (%) and BPS Analysis by Application, 2023 to 2033 Figure 64: Latin America Market Y-o-Y Growth (%) Projections by Application, 2023 to 2033 Figure 65: Latin America Market Value (US$ Million) Analysis by End-User, 2018 to 2033 Figure 66: Latin America Market Volume (Units) Analysis by End-User, 2018 to 2033 Figure 67: Latin America Market Value Share (%) and BPS Analysis by End-User, 2023 to 2033 Figure 68: Latin America Market Y-o-Y Growth (%) Projections by End-User, 2023 to 2033 Figure 69: Latin America Market Attractiveness by Product, 2023 to 2033 Figure 70: Latin America Market Attractiveness by Application, 2023 to 2033 Figure 71: Latin America Market Attractiveness by End-User, 2023 to 2033 Figure 72: Latin America Market Attractiveness by Country, 2023 to 2033 Figure 73: Western Europe Market Value (US$ Million) by Product, 2023 to 2033 Figure 74: Western Europe Market Value (US$ Million) by Application, 2023 to 2033 Figure 75: Western Europe Market Value (US$ Million) by End-User, 2023 to 2033 Figure 76: Western Europe Market Value (US$ Million) by Country, 2023 to 2033 Figure 77: Western Europe Market Value (US$ Million) Analysis by Country, 2018 to 2033 Figure 78: Western Europe Market Volume (Units) Analysis by Country, 2018 to 2033 Figure 79: Western Europe Market Value Share (%) and BPS Analysis by Country, 2023 to 2033 Figure 80: Western Europe Market Y-o-Y Growth (%) Projections by Country, 2023 to 2033 Figure 81: Western Europe Market Value (US$ Million) Analysis by Product, 2018 to 2033 Figure 82: Western Europe Market Volume (Units) Analysis by Product, 2018 to 2033 Figure 83: Western Europe Market Value Share (%) and BPS Analysis by Product, 2023 to 2033 Figure 84: Western Europe Market Y-o-Y Growth (%) Projections by Product, 2023 to 2033 Figure 85: Western Europe Market Value (US$ Million) Analysis by Application, 2018 to 2033 Figure 86: Western Europe Market Volume (Units) Analysis by Application, 2018 to 2033 Figure 87: Western Europe Market Value Share (%) and BPS Analysis by Application, 2023 to 2033 Figure 88: Western Europe Market Y-o-Y Growth (%) Projections by Application, 2023 to 2033 Figure 89: Western Europe Market Value (US$ Million) Analysis by End-User, 2018 to 2033 Figure 90: Western Europe Market Volume (Units) Analysis by End-User, 2018 to 2033 Figure 91: Western Europe Market Value Share (%) and BPS Analysis by End-User, 2023 to 2033 Figure 92: Western Europe Market Y-o-Y Growth (%) Projections by End-User, 2023 to 2033 Figure 93: Western Europe Market Attractiveness by Product, 2023 to 2033 Figure 94: Western Europe Market Attractiveness by Application, 2023 to 2033 Figure 95: Western Europe Market Attractiveness by End-User, 2023 to 2033 Figure 96: Western Europe Market Attractiveness by Country, 2023 to 2033 Figure 97: Eastern Europe Market Value (US$ Million) by Product, 2023 to 2033 Figure 98: Eastern Europe Market Value (US$ Million) by Application, 2023 to 2033 Figure 99: Eastern Europe Market Value (US$ Million) by End-User, 2023 to 2033 Figure 100: Eastern Europe Market Value (US$ Million) by Country, 2023 to 2033 Figure 101: Eastern Europe Market Value (US$ Million) Analysis by Country, 2018 to 2033 Figure 102: Eastern Europe Market Volume (Units) Analysis by Country, 2018 to 2033 Figure 103: Eastern Europe Market Value Share (%) and BPS Analysis by Country, 2023 to 2033 Figure 104: Eastern Europe Market Y-o-Y Growth (%) Projections by Country, 2023 to 2033 Figure 105: Eastern Europe Market Value (US$ Million) Analysis by Product, 2018 to 2033 Figure 106: Eastern Europe Market Volume (Units) Analysis by Product, 2018 to 2033 Figure 107: Eastern Europe Market Value Share (%) and BPS Analysis by Product, 2023 to 2033 Figure 108: Eastern Europe Market Y-o-Y Growth (%) Projections by Product, 2023 to 2033 Figure 109: Eastern Europe Market Value (US$ Million) Analysis by Application, 2018 to 2033 Figure 110: Eastern Europe Market Volume (Units) Analysis by Application, 2018 to 2033 Figure 111: Eastern Europe Market Value Share (%) and BPS Analysis by Application, 2023 to 2033 Figure 112: Eastern Europe Market Y-o-Y Growth (%) Projections by Application, 2023 to 2033 Figure 113: Eastern Europe Market Value (US$ Million) Analysis by End-User, 2018 to 2033 Figure 114: Eastern Europe Market Volume (Units) Analysis by End-User, 2018 to 2033 Figure 115: Eastern Europe Market Value Share (%) and BPS Analysis by End-User, 2023 to 2033 Figure 116: Eastern Europe Market Y-o-Y Growth (%) Projections by End-User, 2023 to 2033 Figure 117: Eastern Europe Market Attractiveness by Product, 2023 to 2033 Figure 118: Eastern Europe Market Attractiveness by Application, 2023 to 2033 Figure 119: Eastern Europe Market Attractiveness by End-User, 2023 to 2033 Figure 120: Eastern Europe Market Attractiveness by Country, 2023 to 2033 Figure 121: South Asia and Pacific Market Value (US$ Million) by Product, 2023 to 2033 Figure 122: South Asia and Pacific Market Value (US$ Million) by Application, 2023 to 2033 Figure 123: South Asia and Pacific Market Value (US$ Million) by End-User, 2023 to 2033 Figure 124: South Asia and Pacific Market Value (US$ Million) by Country, 2023 to 2033 Figure 125: South Asia and Pacific Market Value (US$ Million) Analysis by Country, 2018 to 2033 Figure 126: South Asia and Pacific Market Volume (Units) Analysis by Country, 2018 to 2033 Figure 127: South Asia and Pacific Market Value Share (%) and BPS Analysis by Country, 2023 to 2033 Figure 128: South Asia and Pacific Market Y-o-Y Growth (%) Projections by Country, 2023 to 2033 Figure 129: South Asia and Pacific Market Value (US$ Million) Analysis by Product, 2018 to 2033 Figure 130: South Asia and Pacific Market Volume (Units) Analysis by Product, 2018 to 2033 Figure 131: South Asia and Pacific Market Value Share (%) and BPS Analysis by Product, 2023 to 2033 Figure 132: South Asia and Pacific Market Y-o-Y Growth (%) Projections by Product, 2023 to 2033 Figure 133: South Asia and Pacific Market Value (US$ Million) Analysis by Application, 2018 to 2033 Figure 134: South Asia and Pacific Market Volume (Units) Analysis by Application, 2018 to 2033 Figure 135: South Asia and Pacific Market Value Share (%) and BPS Analysis by Application, 2023 to 2033 Figure 136: South Asia and Pacific Market Y-o-Y Growth (%) Projections by Application, 2023 to 2033 Figure 137: South Asia and Pacific Market Value (US$ Million) Analysis by End-User, 2018 to 2033 Figure 138: South Asia and Pacific Market Volume (Units) Analysis by End-User, 2018 to 2033 Figure 139: South Asia and Pacific Market Value Share (%) and BPS Analysis by End-User, 2023 to 2033 Figure 140: South Asia and Pacific Market Y-o-Y Growth (%) Projections by End-User, 2023 to 2033 Figure 141: South Asia and Pacific Market Attractiveness by Product, 2023 to 2033 Figure 142: South Asia and Pacific Market Attractiveness by Application, 2023 to 2033 Figure 143: South Asia and Pacific Market Attractiveness by End-User, 2023 to 2033 Figure 144: South Asia and Pacific Market Attractiveness by Country, 2023 to 2033 Figure 145: East Asia Market Value (US$ Million) by Product, 2023 to 2033 Figure 146: East Asia Market Value (US$ Million) by Application, 2023 to 2033 Figure 147: East Asia Market Value (US$ Million) by End-User, 2023 to 2033 Figure 148: East Asia Market Value (US$ Million) by Country, 2023 to 2033 Figure 149: East Asia Market Value (US$ Million) Analysis by Country, 2018 to 2033 Figure 150: East Asia Market Volume (Units) Analysis by Country, 2018 to 2033 Figure 151: East Asia Market Value Share (%) and BPS Analysis by Country, 2023 to 2033 Figure 152: East Asia Market Y-o-Y Growth (%) Projections by Country, 2023 to 2033 Figure 153: East Asia Market Value (US$ Million) Analysis by Product, 2018 to 2033 Figure 154: East Asia Market Volume (Units) Analysis by Product, 2018 to 2033 Figure 155: East Asia Market Value Share (%) and BPS Analysis by Product, 2023 to 2033 Figure 156: East Asia Market Y-o-Y Growth (%) Projections by Product, 2023 to 2033 Figure 157: East Asia Market Value (US$ Million) Analysis by Application, 2018 to 2033 Figure 158: East Asia Market Volume (Units) Analysis by Application, 2018 to 2033 Figure 159: East Asia Market Value Share (%) and BPS Analysis by Application, 2023 to 2033 Figure 160: East Asia Market Y-o-Y Growth (%) Projections by Application, 2023 to 2033 Figure 161: East Asia Market Value (US$ Million) Analysis by End-User, 2018 to 2033 Figure 162: East Asia Market Volume (Units) Analysis by End-User, 2018 to 2033 Figure 163: East Asia Market Value Share (%) and BPS Analysis by End-User, 2023 to 2033 Figure 164: East Asia Market Y-o-Y Growth (%) Projections by End-User, 2023 to 2033 Figure 165: East Asia Market Attractiveness by Product, 2023 to 2033 Figure 166: East Asia Market Attractiveness by Application, 2023 to 2033 Figure 167: East Asia Market Attractiveness by End-User, 2023 to 2033 Figure 168: East Asia Market Attractiveness by Country, 2023 to 2033 Figure 169: Middle East and Africa Market Value (US$ Million) by Product, 2023 to 2033 Figure 170: Middle East and Africa Market Value (US$ Million) by Application, 2023 to 2033 Figure 171: Middle East and Africa Market Value (US$ Million) by End-User, 2023 to 2033 Figure 172: Middle East and Africa Market Value (US$ Million) by Country, 2023 to 2033 Figure 173: Middle East and Africa Market Value (US$ Million) Analysis by Country, 2018 to 2033 Figure 174: Middle East and Africa Market Volume (Units) Analysis by Country, 2018 to 2033 Figure 175: Middle East and Africa Market Value Share (%) and BPS Analysis by Country, 2023 to 2033 Figure 176: Middle East and Africa Market Y-o-Y Growth (%) Projections by Country, 2023 to 2033 Figure 177: Middle East and Africa Market Value (US$ Million) Analysis by Product, 2018 to 2033 Figure 178: Middle East and Africa Market Volume (Units) Analysis by Product, 2018 to 2033 Figure 179: Middle East and Africa Market Value Share (%) and BPS Analysis by Product, 2023 to 2033 Figure 180: Middle East and Africa Market Y-o-Y Growth (%) Projections by Product, 2023 to 2033 Figure 181: Middle East and Africa Market Value (US$ Million) Analysis by Application, 2018 to 2033 Figure 182: Middle East and Africa Market Volume (Units) Analysis by Application, 2018 to 2033 Figure 183: Middle East and Africa Market Value Share (%) and BPS Analysis by Application, 2023 to 2033 Figure 184: Middle East and Africa Market Y-o-Y Growth (%) Projections by Application, 2023 to 2033 Figure 185: Middle East and Africa Market Value (US$ Million) Analysis by End-User, 2018 to 2033 Figure 186: Middle East and Africa Market Volume (Units) Analysis by End-User, 2018 to 2033 Figure 187: Middle East and Africa Market Value Share (%) and BPS Analysis by End-User, 2023 to 2033 Figure 188: Middle East and Africa Market Y-o-Y Growth (%) Projections by End-User, 2023 to 2033 Figure 189: Middle East and Africa Market Attractiveness by Product, 2023 to 2033 Figure 190: Middle East and Africa Market Attractiveness by Application, 2023 to 2033 Figure 191: Middle East and Africa Market Attractiveness by End-User, 2023 to 2033 Figure 192: Middle East and Africa Market Attractiveness by Country, 2023 to 2033
Recommendations
Explore Healthcare Insights
View Reports