The European Advanced Aerospace Coatings market is estimated to reach USD 543.66 million in 2025. Growth is driven by rising demand for lightweight and corrosion-resistant materials in aerospace manufacturing. The industry is anticipated to grow steadily, with innovations in nanotechnology and eco-friendly coating solutions playing key roles in market expansion.
A CAGR of 4.5% is expected through 2035. By 2035, the market value is forecasted to hit USD 844.3 million. Strict environmental regulations within Europe are shaping product formulations. This regulatory landscape encourages the adoption of sustainable coatings that reduce volatile organic compounds.
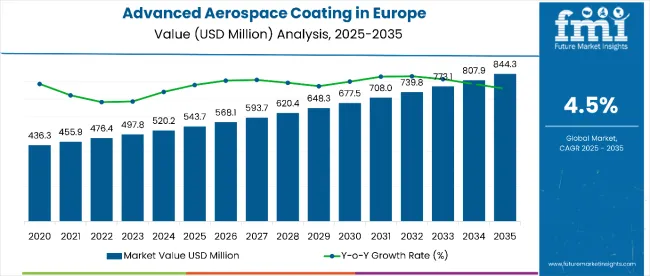
| Metric | Value |
|---|---|
| Industry Size (2025E) | USD 543.66 million |
| Industry Size (2035F) | USD 844.3 million |
| CAGR (2025 to 2035) | 4.5% |
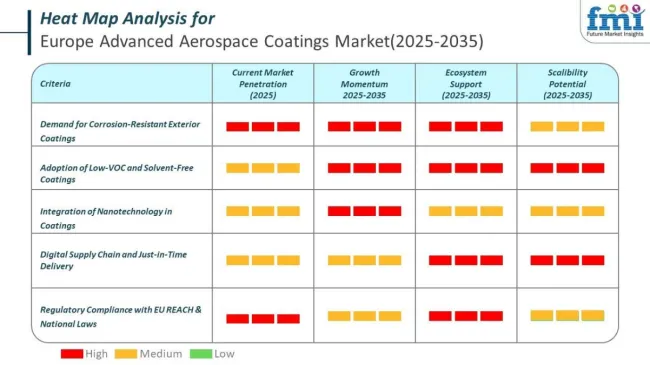
Aerospace coatings must meet strict chemical composition rules under European law. Manufacturers must ensure every ingredient is registered and that restricted substances are authorised before use. Failure to comply can block sales or trigger recalls.
Application and removal of aerospace coatings in Europe must meet stringent environmental controls. Plants must reduce emissions and implement approved abatement methods to retain their operating permits.
Aerospace coating operations involve hazardous substances, requiring strong worker protection and safety protocols. Companies must prove active compliance to avoid regulatory violations.
By End Use, the Commercial Segment Accounts for 55% of the Market Share
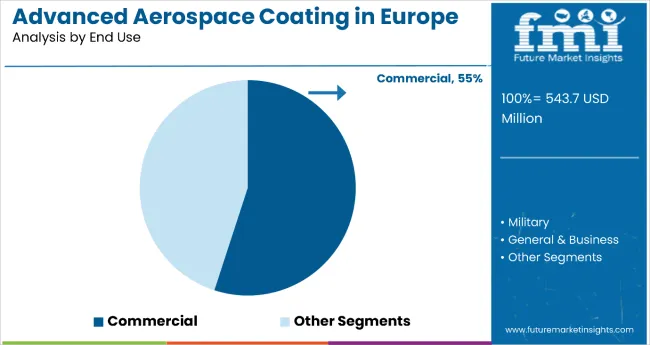
The commercial segment holds the dominant position with 55% of the market share in the end use category within the advanced aerospace coatings industry in Europe. This leadership is driven by the expanding commercial aviation sector, fleet modernization initiatives, and increasing air passenger traffic across European markets. Commercial aircraft require advanced coatings that provide superior corrosion resistance, fuel efficiency enhancement, and extended service life to meet stringent operational requirements and environmental regulations imposed by the European Aviation Safety Agency (EASA).
The segment's dominance is reinforced by the continuous expansion of airline fleets and the introduction of new, more efficient aircraft models from manufacturers like Airbus. Commercial aviation coatings must deliver exceptional performance in diverse climatic conditions across Europe while supporting sustainability goals through improved aerodynamics and reduced maintenance requirements. As European air traffic continues to grow and airlines prioritize cost-effective operations, the commercial segment is positioned to maintain its market leadership through continued investment in advanced coating technologies and eco-friendly formulations that align with the European Union's environmental objectives.
By Application, the Exterior Segment Accounts for 70% of the Market Share
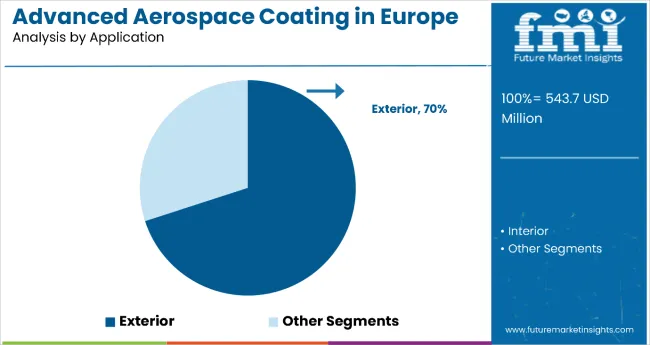
Exterior applications dominate the advanced aerospace coatings market in Europe with 70% of the market share, reflecting the critical importance of external surface protection in aircraft performance and durability. This segment's leadership is attributed to the extensive coating requirements for aircraft fuselages, wings, empennage, and other external components that must withstand harsh environmental conditions, UV radiation, temperature fluctuations, and atmospheric corrosion. Exterior coatings play a vital role in maintaining aircraft aesthetics, aerodynamic efficiency, and structural integrity throughout the aircraft's operational lifecycle.
The segment encompasses applications across primer coatings, topcoats, and specialized protective layers that provide comprehensive exterior surface protection while meeting strict European regulatory requirements for volatile organic compound (VOC) emissions. The growing emphasis on fuel efficiency and environmental compliance is driving demand for advanced exterior coating systems that reduce drag, improve thermal management, and extend maintenance intervals. As European aerospace manufacturers focus on developing next-generation aircraft with enhanced performance characteristics, the exterior segment is expected to strengthen its market position through innovations in nanotechnology, self-healing coatings, and smart coating systems that adapt to changing environmental conditions.
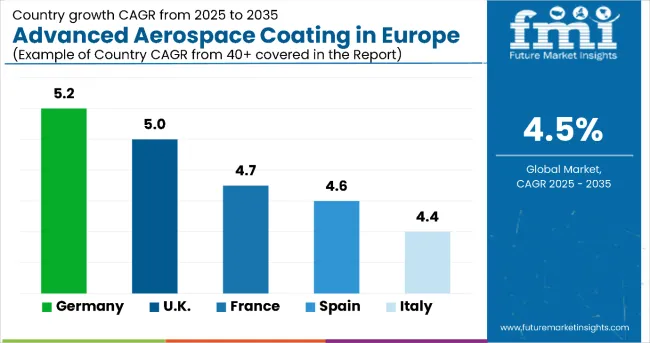
Germany represents one of the most attractive markets for advanced aerospace coatings in Europe. The market is estimated to be USD 120 million in 2025, growing to USD 200 million by 2035, reflecting a CAGR of 5.2%. This above-baseline growth is underpinned by Germany’s strong aerospace manufacturing base, which includes leading OEMs and an extensive MRO (Maintenance, Repair, and Overhaul) network. Regulatory frameworks prioritize sustainability and emission reductions, driving demand for eco-friendly, high-performance coatings.
Advanced composite adoption in aircraft structures intensifies the need for specialized primers and ceramic coatings that offer enhanced corrosion and thermal resistance. The country’s significant investment in aerospace innovation accelerates product development cycles and stimulates demand for cutting-edge coating technologies. Supply chain robustness and skilled labor availability further bolster market stability. Constraints include raw material price volatility and compliance costs related to stringent EU chemical regulations.
However, Germany’s strategic position as a key aerospace hub sustains the market’s upward trajectory. The growing emphasis on extending aircraft service life and reducing maintenance downtime adds quantitative strength to the coating segment’s expansion.
| 2025 Value | CAGR (2025 to 2035) |
|---|---|
| USD 120 million | 5.2% |
The UK advanced aerospace coatings industry is forecasted to achieve substantial growth, reaching USD 95 million in 2025 and USD 155 million by 2035, with a CAGR of 5.0%. This performance is attributed to the country’s well-established aerospace sector, which contributes approximately 17% to the UK’s manufacturing GDP. Strict environmental regulations enforced by UK authorities align with the EU REACH framework, pushing for low-VOC and sustainable coating formulations.
Increased demand for commercial aircraft refurbishment and maintenance, particularly in the MRO sector, propels coating consumption. Additionally, the UK’s robust defense aerospace programs create steady demand for military-grade coatings with specialized performance criteria. Technological innovation in coating chemistries and an emphasis on lightweight, durable finishes support the CAGR outperformance versus the global baseline. Supply chain diversification post-Brexit has introduced both challenges and opportunities, encouraging domestic coating manufacturers to innovate and meet localized standards.
While the regulatory environment imposes compliance costs, the proactive industry response supports sustained market expansion. Overall, the UK market exhibits balanced growth driven by commercial and defense aerospace segments, reflecting strong quantitative metrics.
| 2025 Value | CAGR (2025 to 2035) |
|---|---|
| USD 95 million | 5.0% |
France’s Advanced Aerospace Coatings market is positioned for moderate yet consistent growth. Estimated at USD 80 million in 2025, the sector is projected to expand to USD 130 million by 2035, growing at a CAGR of 4.7%. The presence of major OEMs such as Airbus significantly supports the coating demand for both commercial and military aircraft. France’s strict adherence to European environmental regulations incentivizes the adoption of eco-compliant coatings with reduced VOC emissions. Recent government initiatives to modernize aerospace manufacturing facilities contribute to growing coating consumption.
However, the market faces challenges from raw material price fluctuations and the complex certification process for new coating technologies. Innovations in ceramic coatings and primers tailored for lightweight composites drive value creation in high-growth subsegments. The growing focus on reducing aircraft turnaround times and maintenance costs also positively impacts coating volumes.
Despite these drivers, France’s growth rate remains slightly below Germany and the UK due to moderate investment levels and slower recovery in certain aerospace sub-sectors. Nevertheless, the market’s solid industrial base and regulatory alignment ensure steady value expansion.
| 2025 Value | CAGR (2025 to 2035) |
|---|---|
| USD 80 million | 4.7% |
Spain’s Advanced Aerospace Coatings industry is projected to demonstrate steady growth, with a market value of USD 40 million in 2025, rising to USD 65 million by 2035 at a CAGR of 4.6%. This trajectory aligns closely with the European average. The country’s growing aerospace manufacturing footprint, especially in commercial aviation components, underpins coating demand. Investments in aerospace MRO facilities bolster market consumption of primers and topcoats, particularly in corrosion protection.
Spain’s regulatory environment emphasizes sustainability but lacks the stringency seen in larger markets, allowing gradual adaptation to eco-friendly coating technologies. Innovation adoption is progressing, particularly for ceramic coatings used in thermal protection. However, slower infrastructure development and limited scale compared to peers constrain growth momentum.
Currency fluctuations and import dependencies on raw materials occasionally impact cost structures. Despite these challenges, Spain’s aerospace industry benefits from strong government support and international partnerships, maintaining a stable market outlook. Quantitatively, the segment’s moderate CAGR and value increase reflect incremental but reliable expansion.
| 2025 Value | CAGR (2025 to 2035) |
|---|---|
| USD 40 million | 4.6% |
Italy’s advanced aerospace coatings market is forecasted to expand moderately, reaching USD 38 million in 2025 and USD 62 million by 2035, with a CAGR of 4.4%. The country’s aerospace sector comprises both OEM and MRO activities, contributing to steady coating demand. However, slower adoption of advanced coating technologies compared to Northern European countries limits the CAGR slightly below the global average. Italy’s regulatory environment supports environmentally friendly products but enforcement varies regionally.
Demand is driven largely by the commercial aviation segment, with military applications contributing marginally. The focus on aircraft maintenance and refurbishment stimulates consistent use of primers and topcoats, while ceramic coatings are gradually entering the market. Infrastructure investments in aerospace manufacturing and maintenance hubs remain cautious, affecting rapid growth potential.
Raw material price sensitivity and supply chain complexities further temper expansion. Nonetheless, Italy’s integration within the broader European aerospace network ensures ongoing demand, sustaining the market’s upward trend despite below-average growth rates.
| 2025 Value | CAGR (2025 to 2035) |
|---|---|
| USD 38 million | 4.4% |
The Rest of Europe advanced aerospace coatings segment is projected to grow from USD 50 million in 2025 to USD 82 million by 2035, exhibiting a CAGR of 4.8%. This diverse region includes emerging aerospace manufacturing hubs alongside smaller markets, creating a mixed growth environment. Investments in regional aerospace capabilities and MRO facilities are increasing, especially in Eastern European countries. Regulatory alignment with EU standards drives adoption of low-VOC and high-performance coatings, though enforcement intensity varies.
The demand for advanced primers and ceramic coatings is rising in response to new aircraft manufacturing and maintenance projects. Supply chains are becoming more integrated, improving material availability and cost efficiency. However, market fragmentation and limited scale in some countries moderate overall expansion speed.
Emerging aerospace clusters attract investment, gradually closing the gap with Western Europe. The combination of growth in manufacturing capacity, modernization programs, and regulatory support makes this segment quantitatively attractive, slightly above the global CAGR baseline.
| 2025 Value | CAGR (2025 to 2035) |
|---|---|
| USD 50 million | 4.8% |
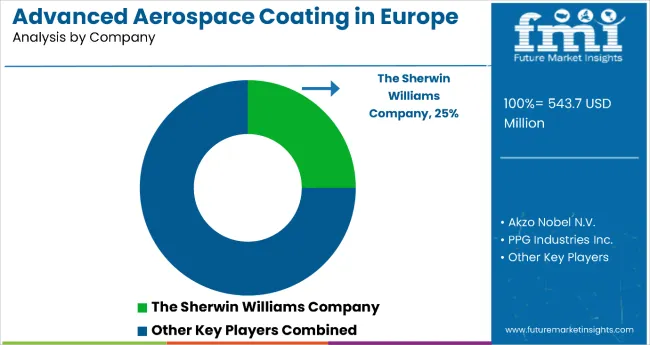
The Advanced Aerospace Coatings market remains moderately consolidated, with the top five players collectively controlling a significant share through robust innovation pipelines, strategic partnerships, and geographic expansion. Leading companies compete aggressively on product differentiation by advancing eco-friendly, high-performance coating formulations and expanding their footprint in emerging aerospace hubs. Pricing strategies focus on balancing cost competitiveness with premium product value, especially in high-tech ceramic and solvent-free coatings.
Strategic collaborations with aerospace OEMs and MRO providers enable access to long-term contracts and facilitate faster product adoption. Expansion efforts target increasing manufacturing capacities in key regions, leveraging digital tools for customer engagement and supply chain resilience.
The Sherwin Williams Company leads the segment by leveraging its broad product portfolio and recent acquisitions, focusing on sustainable coating technologies to meet stringent aerospace environmental standards. Akzo Nobel N.V. emphasizes innovation in low-VOC coatings and ceramic technologies, strengthening its presence in Europe and North America through strategic partnerships.
PPG Industries Inc. drives growth via advanced primer and topcoat formulations combined with aggressive MRO sector penetration. Henkel AG & Co. KGaA prioritizes specialty coatings and adhesives integration, enhancing cross-segment offerings. BASF SE capitalizes on its strong R&D in materials science to push next-generation aerospace coatings, targeting lightweight composite applications.
Together, these five dominate the competitive landscape, while mid-sized players like Axalta Coating Systems Ltd. and Bodycote plc focus on niche applications and regional growth.
| Company Name | Estimated Market Share (%) |
|---|---|
| The Sherwin Williams Company | 22-27% |
| Akzo Nobel N.V. | 18-22% |
| PPG Industries Inc. | 15-19% |
| Henkel AG & Co. KGaA | 10-14% |
| BASF SE | 9-12% |
| Report Attributes | Details |
|---|---|
| Current Total Market Size (2025) | USD 543.66 million |
| Projected Market Size (2035) | USD 844.3 million |
| CAGR (2025 to 2035) | 4.5% |
| Base Year for Estimation | 2024 |
| Historical Period | 2020 to 2024 |
| Projections Period | 2025 to 2035 |
| Market Analysis Parameters | Revenue in USD million /volumes in kilotons |
| By Product Type | Primer, Topcoat, Solvent, Ceramic Coatings |
| By Application | Interior, Exterior |
| By End Use | Commercial, General & Business, Military |
| Regions Covered | Europe |
| Countries Covered | Germany, UK, France, Spain, Italy, Rest of Europe |
| Key Players | The Sherwin Williams Company, Akzo Nobel N.V., PPG Industries Inc., Henkel AG & Co. KGaA, BASF SE, Axalta Coating Systems Ltd., Bodycote plc, Zircotec, Master Bond Inc., APV Engineered Coating, and Hardide Plc. |
| Additional Attributes | Dollar sales by value, market share analysis by region, country-wise analysis |
The market is valued at USD 543.66 million in 2025.
The industry is projected to reach USD 844.3 million by 2035.
Leading companies include The Sherwin Williams Company, Akzo Nobel N.V., PPG Industries Inc., Henkel AG & Co. KGaA, BASF SE, Axalta Coating Systems Ltd., Bodycote plc, and others.
Germany is forecasted to grow at a CAGR of 5.2% during the period 2025 to 2035.
Exterior a sub segment of application is expected to register a CAGR of 5.3% during assessment period.
Table 1: Industry Analysis Value (US$ Million) Forecast by Country, 2019 to 2034
Table 2: Industry Analysis Volume (Tons) Forecast by Country, 2019 to 2034
Table 3: Industry Analysis Value (US$ Million) Forecast by Product Type, 2019 to 2034
Table 4: Industry Analysis Volume (Tons) Forecast by Product Type, 2019 to 2034
Table 5: Industry Analysis Value (US$ Million) Forecast by Application, 2019 to 2034
Table 6: Industry Analysis Volume (Tons) Forecast by Application, 2019 to 2034
Table 7: Industry Analysis Value (US$ Million) Forecast by End Use, 2019 to 2034
Table 8: Industry Analysis Volume (Tons) Forecast by End Use, 2019 to 2034
Table 9: Germany Market Value (US$ Million) Forecast by Region, 2019 to 2034
Table 10: Germany Market Volume (Tons) Forecast by Region, 2019 to 2034
Table 11: Germany Market Value (US$ Million) Forecast by Product Type, 2019 to 2034
Table 12: Germany Market Volume (Tons) Forecast by Product Type, 2019 to 2034
Table 13: Germany Market Value (US$ Million) Forecast by Application, 2019 to 2034
Table 14: Germany Market Volume (Tons) Forecast by Application, 2019 to 2034
Table 15: Germany Market Value (US$ Million) Forecast by End Use, 2019 to 2034
Table 16: Germany Market Volume (Tons) Forecast by End Use, 2019 to 2034
Table 17: UK Market Value (US$ Million) Forecast by Region, 2019 to 2034
Table 18: UK Market Volume (Tons) Forecast by Region, 2019 to 2034
Table 19: UK Market Value (US$ Million) Forecast by Product Type, 2019 to 2034
Table 20: UK Market Volume (Tons) Forecast by Product Type, 2019 to 2034
Table 21: UK Market Value (US$ Million) Forecast by Application, 2019 to 2034
Table 22: UK Market Volume (Tons) Forecast by Application, 2019 to 2034
Table 23: UK Market Value (US$ Million) Forecast by End Use, 2019 to 2034
Table 24: UK Market Volume (Tons) Forecast by End Use, 2019 to 2034
Table 25: France Market Value (US$ Million) Forecast by Region, 2019 to 2034
Table 26: France Market Volume (Tons) Forecast by Region, 2019 to 2034
Table 27: France Market Value (US$ Million) Forecast by Product Type, 2019 to 2034
Table 28: France Market Volume (Tons) Forecast by Product Type, 2019 to 2034
Table 29: France Market Value (US$ Million) Forecast by Application, 2019 to 2034
Table 30: France Market Volume (Tons) Forecast by Application, 2019 to 2034
Table 31: France Market Value (US$ Million) Forecast by End Use, 2019 to 2034
Table 32: France Market Volume (Tons) Forecast by End Use, 2019 to 2034
Table 33: Spain Market Value (US$ Million) Forecast by Region, 2019 to 2034
Table 34: Spain Market Volume (Tons) Forecast by Region, 2019 to 2034
Table 35: Spain Market Value (US$ Million) Forecast by Product Type, 2019 to 2034
Table 36: Spain Market Volume (Tons) Forecast by Product Type, 2019 to 2034
Table 37: Spain Market Value (US$ Million) Forecast by Application, 2019 to 2034
Table 38: Spain Market Volume (Tons) Forecast by Application, 2019 to 2034
Table 39: Spain Market Value (US$ Million) Forecast by End Use, 2019 to 2034
Table 40: Spain Market Volume (Tons) Forecast by End Use, 2019 to 2034
Table 41: Italy Market Value (US$ Million) Forecast by Region, 2019 to 2034
Table 42: Italy Market Volume (Tons) Forecast by Region, 2019 to 2034
Table 43: Italy Market Value (US$ Million) Forecast by Product Type, 2019 to 2034
Table 44: Italy Market Volume (Tons) Forecast by Product Type, 2019 to 2034
Table 45: Italy Market Value (US$ Million) Forecast by Application, 2019 to 2034
Table 46: Italy Market Volume (Tons) Forecast by Application, 2019 to 2034
Table 47: Italy Market Value (US$ Million) Forecast by End Use, 2019 to 2034
Table 48: Italy Market Volume (Tons) Forecast by End Use, 2019 to 2034
Table 49: Rest of Industry Analysis Value (US$ Million) Forecast by Country, 2019 to 2034
Table 50: Rest of Industry Analysis Volume (Tons) Forecast by Country, 2019 to 2034
Table 51: Rest of Industry Analysis Value (US$ Million) Forecast by Product Type, 2019 to 2034
Table 52: Rest of Industry Analysis Volume (Tons) Forecast by Product Type, 2019 to 2034
Table 53: Rest of Industry Analysis Value (US$ Million) Forecast by Application, 2019 to 2034
Table 54: Rest of Industry Analysis Volume (Tons) Forecast by Application, 2019 to 2034
Table 55: Rest of Industry Analysis Value (US$ Million) Forecast by End Use, 2019 to 2034
Table 56: Rest of Industry Analysis Volume (Tons) Forecast by End Use, 2019 to 2034
Figure 1: Industry Analysis Value (US$ Million) by Product Type, 2024 to 2034
Figure 2: Industry Analysis Value (US$ Million) by Application, 2024 to 2034
Figure 3: Industry Analysis Value (US$ Million) by End Use, 2024 to 2034
Figure 4: Industry Analysis Value (US$ Million) by Country, 2024 to 2034
Figure 5: Industry Analysis Value (US$ Million) Analysis by Country, 2019 to 2034
Figure 6: Industry Analysis Volume (Tons) Analysis by Country, 2019 to 2034
Figure 7: Industry Analysis Value Share (%) and BPS Analysis by Country, 2024 to 2034
Figure 8: Industry Analysis Y-o-Y Growth (%) Projections by Country, 2024 to 2034
Figure 9: Industry Analysis Value (US$ Million) Analysis by Product Type, 2019 to 2034
Figure 10: Industry Analysis Volume (Tons) Analysis by Product Type, 2019 to 2034
Figure 11: Industry Analysis Value Share (%) and BPS Analysis by Product Type, 2024 to 2034
Figure 12: Industry Analysis Y-o-Y Growth (%) Projections by Product Type, 2024 to 2034
Figure 13: Industry Analysis Value (US$ Million) Analysis by Application, 2019 to 2034
Figure 14: Industry Analysis Volume (Tons) Analysis by Application, 2019 to 2034
Figure 15: Industry Analysis Value Share (%) and BPS Analysis by Application, 2024 to 2034
Figure 16: Industry Analysis Y-o-Y Growth (%) Projections by Application, 2024 to 2034
Figure 17: Industry Analysis Value (US$ Million) Analysis by End Use, 2019 to 2034
Figure 18: Industry Analysis Volume (Tons) Analysis by End Use, 2019 to 2034
Figure 19: Industry Analysis Value Share (%) and BPS Analysis by End Use, 2024 to 2034
Figure 20: Industry Analysis Y-o-Y Growth (%) Projections by End Use, 2024 to 2034
Figure 21: Industry Analysis Attractiveness by Product Type, 2024 to 2034
Figure 22: Industry Analysis Attractiveness by Application, 2024 to 2034
Figure 23: Industry Analysis Attractiveness by End Use, 2024 to 2034
Figure 24: Industry Analysis Attractiveness by Country, 2024 to 2034
Figure 25: Germany Market Value (US$ Million) by Product Type, 2024 to 2034
Figure 26: Germany Market Value (US$ Million) by Application, 2024 to 2034
Figure 27: Germany Market Value (US$ Million) by End Use, 2024 to 2034
Figure 28: Germany Market Value (US$ Million) by Region, 2024 to 2034
Figure 29: Germany Market Value (US$ Million) Analysis by Region, 2019 to 2034
Figure 30: Germany Market Volume (Tons) Analysis by Region, 2019 to 2034
Figure 31: Germany Market Value Share (%) and BPS Analysis by Region, 2024 to 2034
Figure 32: Germany Market Y-o-Y Growth (%) Projections by Region, 2024 to 2034
Figure 33: Germany Market Value (US$ Million) Analysis by Product Type, 2019 to 2034
Figure 34: Germany Market Volume (Tons) Analysis by Product Type, 2019 to 2034
Figure 35: Germany Market Value Share (%) and BPS Analysis by Product Type, 2024 to 2034
Figure 36: Germany Market Y-o-Y Growth (%) Projections by Product Type, 2024 to 2034
Figure 37: Germany Market Value (US$ Million) Analysis by Application, 2019 to 2034
Figure 38: Germany Market Volume (Tons) Analysis by Application, 2019 to 2034
Figure 39: Germany Market Value Share (%) and BPS Analysis by Application, 2024 to 2034
Figure 40: Germany Market Y-o-Y Growth (%) Projections by Application, 2024 to 2034
Figure 41: Germany Market Value (US$ Million) Analysis by End Use, 2019 to 2034
Figure 42: Germany Market Volume (Tons) Analysis by End Use, 2019 to 2034
Figure 43: Germany Market Value Share (%) and BPS Analysis by End Use, 2024 to 2034
Figure 44: Germany Market Y-o-Y Growth (%) Projections by End Use, 2024 to 2034
Figure 45: Germany Market Attractiveness by Product Type, 2024 to 2034
Figure 46: Germany Market Attractiveness by Application, 2024 to 2034
Figure 47: Germany Market Attractiveness by End Use, 2024 to 2034
Figure 48: Germany Market Attractiveness by Region, 2024 to 2034
Figure 49: UK Market Value (US$ Million) by Product Type, 2024 to 2034
Figure 50: UK Market Value (US$ Million) by Application, 2024 to 2034
Figure 51: UK Market Value (US$ Million) by End Use, 2024 to 2034
Figure 52: UK Market Value (US$ Million) by Region, 2024 to 2034
Figure 53: UK Market Value (US$ Million) Analysis by Region, 2019 to 2034
Figure 54: UK Market Volume (Tons) Analysis by Region, 2019 to 2034
Figure 55: UK Market Value Share (%) and BPS Analysis by Region, 2024 to 2034
Figure 56: UK Market Y-o-Y Growth (%) Projections by Region, 2024 to 2034
Figure 57: UK Market Value (US$ Million) Analysis by Product Type, 2019 to 2034
Figure 58: UK Market Volume (Tons) Analysis by Product Type, 2019 to 2034
Figure 59: UK Market Value Share (%) and BPS Analysis by Product Type, 2024 to 2034
Figure 60: UK Market Y-o-Y Growth (%) Projections by Product Type, 2024 to 2034
Figure 61: UK Market Value (US$ Million) Analysis by Application, 2019 to 2034
Figure 62: UK Market Volume (Tons) Analysis by Application, 2019 to 2034
Figure 63: UK Market Value Share (%) and BPS Analysis by Application, 2024 to 2034
Figure 64: UK Market Y-o-Y Growth (%) Projections by Application, 2024 to 2034
Figure 65: UK Market Value (US$ Million) Analysis by End Use, 2019 to 2034
Figure 66: UK Market Volume (Tons) Analysis by End Use, 2019 to 2034
Figure 67: UK Market Value Share (%) and BPS Analysis by End Use, 2024 to 2034
Figure 68: UK Market Y-o-Y Growth (%) Projections by End Use, 2024 to 2034
Figure 69: UK Market Attractiveness by Product Type, 2024 to 2034
Figure 70: UK Market Attractiveness by Application, 2024 to 2034
Figure 71: UK Market Attractiveness by End Use, 2024 to 2034
Figure 72: UK Market Attractiveness by Region, 2024 to 2034
Figure 73: France Market Value (US$ Million) by Product Type, 2024 to 2034
Figure 74: France Market Value (US$ Million) by Application, 2024 to 2034
Figure 75: France Market Value (US$ Million) by End Use, 2024 to 2034
Figure 76: France Market Value (US$ Million) by Region, 2024 to 2034
Figure 77: France Market Value (US$ Million) Analysis by Region, 2019 to 2034
Figure 78: France Market Volume (Tons) Analysis by Region, 2019 to 2034
Figure 79: France Market Value Share (%) and BPS Analysis by Region, 2024 to 2034
Figure 80: France Market Y-o-Y Growth (%) Projections by Region, 2024 to 2034
Figure 81: France Market Value (US$ Million) Analysis by Product Type, 2019 to 2034
Figure 82: France Market Volume (Tons) Analysis by Product Type, 2019 to 2034
Figure 83: France Market Value Share (%) and BPS Analysis by Product Type, 2024 to 2034
Figure 84: France Market Y-o-Y Growth (%) Projections by Product Type, 2024 to 2034
Figure 85: France Market Value (US$ Million) Analysis by Application, 2019 to 2034
Figure 86: France Market Volume (Tons) Analysis by Application, 2019 to 2034
Figure 87: France Market Value Share (%) and BPS Analysis by Application, 2024 to 2034
Figure 88: France Market Y-o-Y Growth (%) Projections by Application, 2024 to 2034
Figure 89: France Market Value (US$ Million) Analysis by End Use, 2019 to 2034
Figure 90: France Market Volume (Tons) Analysis by End Use, 2019 to 2034
Figure 91: France Market Value Share (%) and BPS Analysis by End Use, 2024 to 2034
Figure 92: France Market Y-o-Y Growth (%) Projections by End Use, 2024 to 2034
Figure 93: France Market Attractiveness by Product Type, 2024 to 2034
Figure 94: France Market Attractiveness by Application, 2024 to 2034
Figure 95: France Market Attractiveness by End Use, 2024 to 2034
Figure 96: France Market Attractiveness by Region, 2024 to 2034
Figure 97: Spain Market Value (US$ Million) by Product Type, 2024 to 2034
Figure 98: Spain Market Value (US$ Million) by Application, 2024 to 2034
Figure 99: Spain Market Value (US$ Million) by End Use, 2024 to 2034
Figure 100: Spain Market Value (US$ Million) by Region, 2024 to 2034
Figure 101: Spain Market Value (US$ Million) Analysis by Region, 2019 to 2034
Figure 102: Spain Market Volume (Tons) Analysis by Region, 2019 to 2034
Figure 103: Spain Market Value Share (%) and BPS Analysis by Region, 2024 to 2034
Figure 104: Spain Market Y-o-Y Growth (%) Projections by Region, 2024 to 2034
Figure 105: Spain Market Value (US$ Million) Analysis by Product Type, 2019 to 2034
Figure 106: Spain Market Volume (Tons) Analysis by Product Type, 2019 to 2034
Figure 107: Spain Market Value Share (%) and BPS Analysis by Product Type, 2024 to 2034
Figure 108: Spain Market Y-o-Y Growth (%) Projections by Product Type, 2024 to 2034
Figure 109: Spain Market Value (US$ Million) Analysis by Application, 2019 to 2034
Figure 110: Spain Market Volume (Tons) Analysis by Application, 2019 to 2034
Figure 111: Spain Market Value Share (%) and BPS Analysis by Application, 2024 to 2034
Figure 112: Spain Market Y-o-Y Growth (%) Projections by Application, 2024 to 2034
Figure 113: Spain Market Value (US$ Million) Analysis by End Use, 2019 to 2034
Figure 114: Spain Market Volume (Tons) Analysis by End Use, 2019 to 2034
Figure 115: Spain Market Value Share (%) and BPS Analysis by End Use, 2024 to 2034
Figure 116: Spain Market Y-o-Y Growth (%) Projections by End Use, 2024 to 2034
Figure 117: Spain Market Attractiveness by Product Type, 2024 to 2034
Figure 118: Spain Market Attractiveness by Application, 2024 to 2034
Figure 119: Spain Market Attractiveness by End Use, 2024 to 2034
Figure 120: Spain Market Attractiveness by Region, 2024 to 2034
Figure 121: Italy Market Value (US$ Million) by Product Type, 2024 to 2034
Figure 122: Italy Market Value (US$ Million) by Application, 2024 to 2034
Figure 123: Italy Market Value (US$ Million) by End Use, 2024 to 2034
Figure 124: Italy Market Value (US$ Million) by Region, 2024 to 2034
Figure 125: Italy Market Value (US$ Million) Analysis by Region, 2019 to 2034
Figure 126: Italy Market Volume (Tons) Analysis by Region, 2019 to 2034
Figure 127: Italy Market Value Share (%) and BPS Analysis by Region, 2024 to 2034
Figure 128: Italy Market Y-o-Y Growth (%) Projections by Region, 2024 to 2034
Figure 129: Italy Market Value (US$ Million) Analysis by Product Type, 2019 to 2034
Figure 130: Italy Market Volume (Tons) Analysis by Product Type, 2019 to 2034
Figure 131: Italy Market Value Share (%) and BPS Analysis by Product Type, 2024 to 2034
Figure 132: Italy Market Y-o-Y Growth (%) Projections by Product Type, 2024 to 2034
Figure 133: Italy Market Value (US$ Million) Analysis by Application, 2019 to 2034
Figure 134: Italy Market Volume (Tons) Analysis by Application, 2019 to 2034
Figure 135: Italy Market Value Share (%) and BPS Analysis by Application, 2024 to 2034
Figure 136: Italy Market Y-o-Y Growth (%) Projections by Application, 2024 to 2034
Figure 137: Italy Market Value (US$ Million) Analysis by End Use, 2019 to 2034
Figure 138: Italy Market Volume (Tons) Analysis by End Use, 2019 to 2034
Figure 139: Italy Market Value Share (%) and BPS Analysis by End Use, 2024 to 2034
Figure 140: Italy Market Y-o-Y Growth (%) Projections by End Use, 2024 to 2034
Figure 141: Italy Market Attractiveness by Product Type, 2024 to 2034
Figure 142: Italy Market Attractiveness by Application, 2024 to 2034
Figure 143: Italy Market Attractiveness by End Use, 2024 to 2034
Figure 144: Italy Market Attractiveness by Region, 2024 to 2034
Figure 145: Rest of Industry Analysis Value (US$ Million) by Product Type, 2024 to 2034
Figure 146: Rest of Industry Analysis Value (US$ Million) by Application, 2024 to 2034
Figure 147: Rest of Industry Analysis Value (US$ Million) by End Use, 2024 to 2034
Figure 148: Rest of Industry Analysis Value (US$ Million) by Country, 2024 to 2034
Figure 149: Rest of Industry Analysis Value (US$ Million) Analysis by Country, 2019 to 2034
Figure 150: Rest of Industry Analysis Volume (Tons) Analysis by Country, 2019 to 2034
Figure 151: Rest of Industry Analysis Value Share (%) and BPS Analysis by Country, 2024 to 2034
Figure 152: Rest of Industry Analysis Y-o-Y Growth (%) Projections by Country, 2024 to 2034
Figure 153: Rest of Industry Analysis Value (US$ Million) Analysis by Product Type, 2019 to 2034
Figure 154: Rest of Industry Analysis Volume (Tons) Analysis by Product Type, 2019 to 2034
Figure 155: Rest of Industry Analysis Value Share (%) and BPS Analysis by Product Type, 2024 to 2034
Figure 156: Rest of Industry Analysis Y-o-Y Growth (%) Projections by Product Type, 2024 to 2034
Figure 157: Rest of Industry Analysis Value (US$ Million) Analysis by Application, 2019 to 2034
Figure 158: Rest of Industry Analysis Volume (Tons) Analysis by Application, 2019 to 2034
Figure 159: Rest of Industry Analysis Value Share (%) and BPS Analysis by Application, 2024 to 2034
Figure 160: Rest of Industry Analysis Y-o-Y Growth (%) Projections by Application, 2024 to 2034
Figure 161: Rest of Industry Analysis Value (US$ Million) Analysis by End Use, 2019 to 2034
Figure 162: Rest of Industry Analysis Volume (Tons) Analysis by End Use, 2019 to 2034
Figure 163: Rest of Industry Analysis Value Share (%) and BPS Analysis by End Use, 2024 to 2034
Figure 164: Rest of Industry Analysis Y-o-Y Growth (%) Projections by End Use, 2024 to 2034
Figure 165: Rest of Industry Analysis Attractiveness by Product Type, 2024 to 2034
Figure 166: Rest of Industry Analysis Attractiveness by Application, 2024 to 2034
Figure 167: Rest of Industry Analysis Attractiveness by End Use, 2024 to 2034
Figure 168: Rest of Industry Analysis Attractiveness by Country, 2024 to 2034


Our Research Products

The "Full Research Suite" delivers actionable market intel, deep dives on markets or technologies, so clients act faster, cut risk, and unlock growth.

The Leaderboard benchmarks and ranks top vendors, classifying them as Established Leaders, Leading Challengers, or Disruptors & Challengers.

Locates where complements amplify value and substitutes erode it, forecasting net impact by horizon

We deliver granular, decision-grade intel: market sizing, 5-year forecasts, pricing, adoption, usage, revenue, and operational KPIs—plus competitor tracking, regulation, and value chains—across 60 countries broadly.

Spot the shifts before they hit your P&L. We track inflection points, adoption curves, pricing moves, and ecosystem plays to show where demand is heading, why it is changing, and what to do next across high-growth markets and disruptive tech

Real-time reads of user behavior. We track shifting priorities, perceptions of today’s and next-gen services, and provider experience, then pace how fast tech moves from trial to adoption, blending buyer, consumer, and channel inputs with social signals (#WhySwitch, #UX).

Partner with our analyst team to build a custom report designed around your business priorities. From analysing market trends to assessing competitors or crafting bespoke datasets, we tailor insights to your needs.
Supplier Intelligence
Discovery & Profiling
Capacity & Footprint
Performance & Risk
Compliance & Governance
Commercial Readiness
Who Supplies Whom
Scorecards & Shortlists
Playbooks & Docs
Category Intelligence
Definition & Scope
Demand & Use Cases
Cost Drivers
Market Structure
Supply Chain Map
Trade & Policy
Operating Norms
Deliverables
Buyer Intelligence
Account Basics
Spend & Scope
Procurement Model
Vendor Requirements
Terms & Policies
Entry Strategy
Pain Points & Triggers
Outputs
Pricing Analysis
Benchmarks
Trends
Should-Cost
Indexation
Landed Cost
Commercial Terms
Deliverables
Brand Analysis
Positioning & Value Prop
Share & Presence
Customer Evidence
Go-to-Market
Digital & Reputation
Compliance & Trust
KPIs & Gaps
Outputs
Full Research Suite comprises of:
Market outlook & trends analysis
Interviews & case studies
Strategic recommendations
Vendor profiles & capabilities analysis
5-year forecasts
8 regions and 60+ country-level data splits
Market segment data splits
12 months of continuous data updates
DELIVERED AS:
PDF EXCEL ONLINE
European Union Tourism Industry Size and Share Forecast Outlook 2025 to 2035
Europe Polyvinyl Alcohol Industry Analysis Size and Share Forecast Outlook 2025 to 2035
Europe OTR Tire Market Growth – Trends & Forecast 2024-2034
Trash Bag Industry Analysis in Europe Forecast Outlook 2025 to 2035
Mezcal Industry Analysis in Western Europe Report – Growth, Demand & Forecast 2025 to 2035
Western Europe Pectin Market Analysis by Product Type, Application, and Country Through 2035
Western Europe Automotive Lighting Market Growth – Trends & Forecast 2023-2033
Western Europe Probiotic Supplement Market Analysis in – Growth & Market Trends from 2025 to 2035
Europe Second-hand Apparel Market Growth – Trends & Forecast 2024-2034
I2C Bus Industry Analysis in Western Europe Size and Share Forecast Outlook 2025 to 2035
Western Europe Automotive Load Floor IndustryAnalysis in Western Europe Forecast & Analysis 2025 to 2035
Isomalt Industry Analysis in Western Europe – Size, Share & Forecast 2025 to 2035
Taurine Industry in Western Europe - Trends, Market Insights & Applications 2025 to 2035
Europe MDO-PE Film Market Trends & Growth Forecast 2024-2034
Western Europe Automated People Mover Industry Size and Share Forecast Outlook 2025 to 2035
Europe Packing Tape Market Trends & Growth Forecast 2024-2034
Western Europe Automotive Turbocharger Market Growth – Trends & Forecast 2023-2033
Industry Analysis of Electronic Skin in Western Europe Size and Share Forecast Outlook 2025 to 2035
Western Europe Building Automation System Market by System, Application and Region - Forecast for 2025 to 2035
Super Generics Industry Analysis in Europe Report - Trends & Innovations 2025 to 2035

Thank you!
You will receive an email from our Business Development Manager. Please be sure to check your SPAM/JUNK folder too.
Chat With
MaRIA