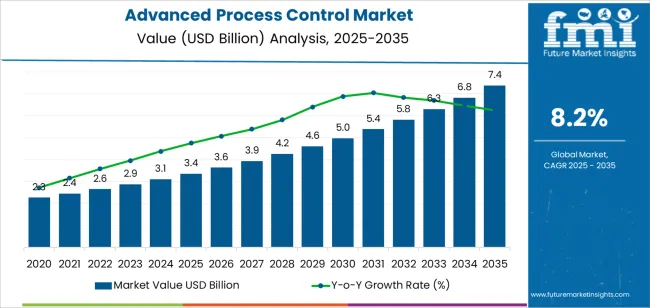
The advanced process control (APC) market is witnessing strong growth momentum driven by increasing demand for operational efficiency, process optimization, and real-time data analysis across industrial sectors. The current scenario reflects a growing shift toward intelligent automation, where manufacturers are integrating APC systems to minimize process variability, enhance yield, and reduce energy consumption.
Rising adoption of Industry 4.0 principles and the expanding use of AI and machine learning in process control environments are further accelerating market transformation. The future outlook indicates a continued move toward cloud-based deployment models, with emphasis on scalability, flexibility, and predictive analytics.
Growth rationale is anchored in the industry’s need to maintain competitive advantages through reduced downtime and improved production accuracy Market expansion is expected to be reinforced by investments in digital transformation, sustainability goals, and compliance with quality standards, collectively supporting long-term adoption and revenue growth across manufacturing and processing industries.

| Metric | Value |
|---|---|
| Advanced Process Control Market Estimated Value in (2025 E) | USD 3.4 billion |
| Advanced Process Control Market Forecast Value in (2035 F) | USD 7.4 billion |
| Forecast CAGR (2025 to 2035) | 8.2% |
The market is segmented by Solution, Deployment, and End-Use Industry and region. By Solution, the market is divided into Integrated Advanced Process Control (APC) Platform and Standalone Software. In terms of Deployment, the market is classified into SaaS-Based and On-Premises. Based on End-Use Industry, the market is segmented into Semiconductors, Pharma/biotech, Automotive, Military & Defense, Electronics And Electrical, Energy and Utilities, and Others (Chemicals, Food & Beverages, other manufacturing). Regionally, the market is classified into North America, Latin America, Western Europe, Eastern Europe, Balkan & Baltic Countries, Russia & Belarus, Central Asia, East Asia, South Asia & Pacific, and the Middle East & Africa.

The integrated advanced process control (APC) platform segment, holding 37.80% of the solution category, has been leading due to its comprehensive functionality and ability to coordinate multiple control layers within a unified system. Adoption has been driven by the platform’s capacity to integrate diverse process data, streamline automation workflows, and provide real-time decision-making insights.
End users are increasingly prioritizing integrated solutions that enhance interoperability between distributed control systems and plant-level applications. Continuous improvements in analytics, simulation modeling, and control algorithms have strengthened performance reliability.
Implementation benefits such as reduced process variability and optimized resource utilization have reinforced market preference for integrated APC platforms The segment’s dominance is expected to continue as industries seek advanced, cohesive control systems that improve operational efficiency and drive sustainable productivity gains.

The SaaS-based segment, representing 56.40% of the deployment category, has maintained its leading position due to rising adoption of cloud computing and the need for scalable, cost-efficient deployment options. The segment’s growth is supported by benefits such as remote accessibility, simplified maintenance, and reduced upfront capital investment.
Organizations are leveraging SaaS-based APC solutions to accelerate implementation timelines and gain access to continuous updates and performance analytics. Enhanced cybersecurity protocols and data encryption frameworks have strengthened confidence in cloud adoption.
The flexibility of subscription-based models allows enterprises to align costs with usage, driving higher acceptance among both large and mid-sized industrial players The SaaS-based segment is expected to retain its lead as more industries transition to digital ecosystems that prioritize agility, real-time monitoring, and data-driven optimization.

The semiconductors segment, accounting for 29.60% of the end-use industry category, has emerged as the primary driver of APC adoption due to its precision-driven manufacturing requirements and high sensitivity to process deviations. Advanced process control systems play a crucial role in ensuring consistent wafer quality, yield optimization, and defect reduction.
The increasing complexity of semiconductor fabrication processes has necessitated deployment of APC solutions capable of handling nanoscale variations and high-volume data processing. The segment’s leadership is also supported by continuous investments in automation and AI integration within semiconductor fabs.
Demand is further strengthened by the expansion of global semiconductor production capacity to meet rising needs in electronics, automotive, and telecommunications With technological advancements and rising emphasis on operational excellence, the semiconductors segment is expected to sustain its market share and remain a key contributor to overall APC market growth.
The advanced process control (APC) market experienced a CAGR of 7.7% during this period. This growth can be attributed to increasing adoption across various industries, driven by the need for operational efficiency, cost reduction, and quality enhancement.
The market is anticipated to maintain a steady growth trajectory, with a forecasted CAGR of 8.2%. Factors such as continued technological advancements, expanding application areas, and growing awareness about the benefits of APC solutions are expected to fuel this growth. Integrating APC with emerging technologies like machine learning and advanced analytics will likely contribute to market expansion.
Over the historical period 2020 to 2025, the APC market witnessed significant adoption as industries increasingly recognized the value of optimizing their processes. This was reflected in the strong CAGR of 7.7%, indicating sustained market growth. Looking ahead to the forecasted period (2025 to 2035), the market is poised to continue its upward trajectory with an even higher CAGR of 8.2%.
The anticipated growth is underpinned by several factors, including ongoing technological innovations driving efficiency gains, broader deployment across diverse sectors, and the growing emphasis on data-driven decision-making. As industries prioritize efficiency, quality, and sustainability, the demand for APC solutions is expected to remain robust, supporting the forecasted growth trend.
| Historical CAGR from 2020 to 2025 | 7.7% |
|---|---|
| Forecast CAGR from 2025 to 2035 | 8.2% |
The provided table illustrates the top five countries in terms of revenue, with Australia holding a prominent position in the market. Australia leads the advanced process control (APC) market by emphasizing sustainable resource management.
With mining, energy, and agriculture applications, APC systems optimize resource extraction, energy generation, and agricultural practices while minimizing environmental impact. The commitment to sustainability drives the adoption and innovation of APC solutions, positioning it as a global leader.
| Countries | Forecast CAGRs from 2025 to 2035 |
|---|---|
| The United States | 5.1% |
| Germany | 3.7% |
| China | 8.7% |
| Japan | 3% |
| Australia | 11.7% |
In the United States, the advanced process control (APC) market is integral to achieving manufacturing excellence across various industries. APC systems play a crucial role in optimizing production processes, improving product quality, and reducing operational costs.
Industries such as manufacturing, oil and gas, chemicals, and pharmaceuticals extensively utilize APC solutions to streamline operations and ensure regulatory compliance.
Germany is renowned for its industrial innovation heavily relies on advanced process control (APC) solutions to drive efficiency and productivity across sectors.
APC systems enable precision control, process automation, and predictive maintenance from automotive manufacturing to engineering. This emphasis on innovation and efficiency underscores its commitment to maintaining its position as a global leader in industrial excellence.
In China, the market plays a vital role in fueling the status of the country as a manufacturing powerhouse. Across manufacturing, energy, and electronics industries, APC systems are instrumental in optimizing production processes, enhancing product quality, and reducing waste.
The relentless focus on efficiency and sustainability drives the widespread adoption of APC solutions to maintain its competitive edge in the global market.

The commitment to technological precision is exemplified through its extensive utilization of advanced process control (APC) solutions. APC systems enable precise control, quality assurance, and adherence to stringent safety standards in the automotive, electronics, and robotics sectors.
The reputation for innovation and attention to detail is further solidified by its strategic integration of APC technologies to drive advancements in manufacturing and automation.
In Australia, the market plays a pivotal role in promoting sustainable resource management across industries such as mining, energy, and agriculture. APC systems are essential for optimizing resource extraction, energy generation, and agricultural practices while minimizing environmental impact.
The emphasis on sustainability underscores the significance of APC solutions in achieving long-term economic and environmental viability.
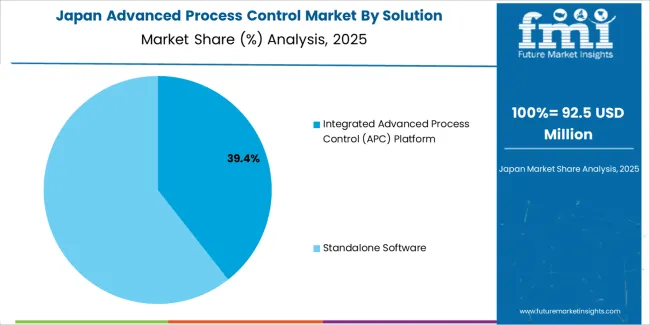
The below section shows the leading segment. Based on solution, the standalone software segment is accounted to hold a market share of 72.3% in 2025. Based on deployment, the on-premises segment is anticipated to hold a market share of 77.3% in 2025.
Standalone software allows businesses to select and implement specific features and functionalities tailored to their unique requirements. Organizations prioritize on-premises solutions to maintain control over their data and ensure compliance with regulatory requirements.
| Category | Market Share in 2025 |
|---|---|
| Standalone Software | 72.3% |
| On-Premises | 77.3% |
In 2025, the standalone software segment dominated the market with a 72.3% share. The prominence in this segment is attributed to the demand for specialized software solutions offering comprehensive features tailored to specific needs, providing flexibility and customization options for users.
The on-premises segment is forecasted to maintain a significant market share of 77.3% in 2025. Data security concerns, regulatory compliance requirements, and greater control over software infrastructure and resources drive this preference for on-premises deployment.
Organizations opt for on-premises solutions to retain data sovereignty and ensure seamless integration with existing IT systems.

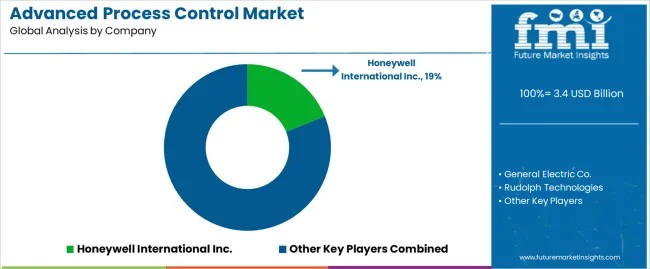
The advanced process control (APC) market features a competitive landscape characterized by established players and emerging vendors striving to innovate and expand their offerings.
The industry leaders focus on technological advancements, strategic partnerships, and mergers to strengthen their market presence. The market witnesses the entry of new entrants, intensifying competition and fostering innovation.
Some of the key developments are:
| Attributes | Details |
|---|---|
| Estimated Market Size in 2025 | USD 3.1 billion |
| Projected Market Valuation in 2035 | USD 6.8 billion |
| Value-based CAGR 2025 to 2035 | 8.2% |
| Forecast Period | 2025 to 2035 |
| Historical Data Available for | 2020 to 2025 |
| Market Analysis | Value in USD billion |
| Key Regions Covered | North America; Latin America; Western Europe; Eastern Europe; South Asia and Pacific; East Asia; Middle East and Africa |
| Key Market Segments Covered | Solution, Deployment, End-use Industry, Region |
| Key Countries Profiled | The United States, Canada, Brazil, Mexico, Germany, The United Kingdom, France, Spain, Italy, Russia, Poland, Czech Republic, Romania, India, Bangladesh, Australia, New Zealand, China, Japan, South Korea, GCC countries, South Africa, Israel |
| Key Companies Profiled | General Electric Co.; Rudolph Technologies; Yokogawa Electric Corp; Emerson Electric Co.; ABB Ltd.; Aspen Technology; Honeywell International Inc.; Schneider Electric Se; Rockwell Automation Inc.; Siemens AG |
The global advanced process control market is estimated to be valued at USD 3.4 billion in 2025.
The market size for the advanced process control market is projected to reach USD 7.4 billion by 2035.
The advanced process control market is expected to grow at a 8.2% CAGR between 2025 and 2035.
The key product types in advanced process control market are integrated advanced process control (apc) platform, standalone software, _asset performance management software, _operational risk management (orm) software, _production management software and _others (ems software, spc software).
In terms of deployment, saas-based segment to command 56.4% share in the advanced process control market in 2025.


Our Research Products

The "Full Research Suite" delivers actionable market intel, deep dives on markets or technologies, so clients act faster, cut risk, and unlock growth.

The Leaderboard benchmarks and ranks top vendors, classifying them as Established Leaders, Leading Challengers, or Disruptors & Challengers.

Locates where complements amplify value and substitutes erode it, forecasting net impact by horizon

We deliver granular, decision-grade intel: market sizing, 5-year forecasts, pricing, adoption, usage, revenue, and operational KPIs—plus competitor tracking, regulation, and value chains—across 60 countries broadly.

Spot the shifts before they hit your P&L. We track inflection points, adoption curves, pricing moves, and ecosystem plays to show where demand is heading, why it is changing, and what to do next across high-growth markets and disruptive tech

Real-time reads of user behavior. We track shifting priorities, perceptions of today’s and next-gen services, and provider experience, then pace how fast tech moves from trial to adoption, blending buyer, consumer, and channel inputs with social signals (#WhySwitch, #UX).

Partner with our analyst team to build a custom report designed around your business priorities. From analysing market trends to assessing competitors or crafting bespoke datasets, we tailor insights to your needs.
Supplier Intelligence
Discovery & Profiling
Capacity & Footprint
Performance & Risk
Compliance & Governance
Commercial Readiness
Who Supplies Whom
Scorecards & Shortlists
Playbooks & Docs
Category Intelligence
Definition & Scope
Demand & Use Cases
Cost Drivers
Market Structure
Supply Chain Map
Trade & Policy
Operating Norms
Deliverables
Buyer Intelligence
Account Basics
Spend & Scope
Procurement Model
Vendor Requirements
Terms & Policies
Entry Strategy
Pain Points & Triggers
Outputs
Pricing Analysis
Benchmarks
Trends
Should-Cost
Indexation
Landed Cost
Commercial Terms
Deliverables
Brand Analysis
Positioning & Value Prop
Share & Presence
Customer Evidence
Go-to-Market
Digital & Reputation
Compliance & Trust
KPIs & Gaps
Outputs
Full Research Suite comprises of:
Market outlook & trends analysis
Interviews & case studies
Strategic recommendations
Vendor profiles & capabilities analysis
5-year forecasts
8 regions and 60+ country-level data splits
Market segment data splits
12 months of continuous data updates
DELIVERED AS:
PDF EXCEL ONLINE
Automated Process Control System Market Growth – Trends & Forecast 2024-2034
Digital Signal Controller & Processor Market
Control Network Modules Market Size and Share Forecast Outlook 2025 to 2035
Controllable Shunt Reactor for UHV Market Size and Share Forecast Outlook 2025 to 2035
Advanced Active Cleaning System for ADAS Market Forecast and Outlook 2025 to 2035
Advanced Driver Assistance System (ADAS) Testing Equipment Market Size and Share Forecast Outlook 2025 to 2035
Process Automation and Instrumentation Market Size and Share Forecast Outlook 2025 to 2035
Process Pipe Coating Market Size and Share Forecast Outlook 2025 to 2035
Advanced Lead Acid Battery Market Size and Share Forecast Outlook 2025 to 2035
Advanced Energy Storage System Market Size and Share Forecast Outlook 2025 to 2035
Advanced Gear Shifter System Market Size and Share Forecast Outlook 2025 to 2035
Control Room Solution Market Size and Share Forecast Outlook 2025 to 2035
Advanced Therapeutics Pharmaceutical Outsourcing Market Size and Share Forecast Outlook 2025 to 2035
Control Knobs for Panel Potentiometer Market Size and Share Forecast Outlook 2025 to 2035
Controlled-Release Drug Delivery Technology Market Size and Share Forecast Outlook 2025 to 2035
Advanced Airport Technologies Market Size and Share Forecast Outlook 2025 to 2035
Advanced Air Mobility Market Size and Share Forecast Outlook 2025 to 2035
Controlled Environment Agriculture (CEA) Market Size and Share Forecast Outlook 2025 to 2035
Advanced Sensor Market Size and Share Forecast Outlook 2025 to 2035
Control Cable Market Size and Share Forecast Outlook 2025 to 2035

Thank you!
You will receive an email from our Business Development Manager. Please be sure to check your SPAM/JUNK folder too.
Chat With
MaRIA