Advanced Composites Market Size and Share Forecast Outlook 2025 to 2035

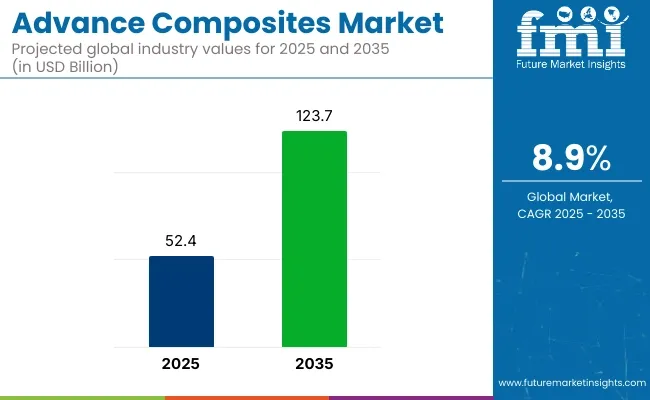
The advanced composites market is projected to grow from USD 52.4 billion in 2025 to USD 123.7 billion by 2035, registering a CAGR of 8.9% during the forecast period. Sales in 2024 reached USD 48.1 billion, reflecting the sector's resilience and growing demand across aerospace, automotive, construction, and renewable energy industries. This growth is attributed to the increasing need for lightweight, durable, and high-performance materials that enhance efficiency and sustainability in various applications.
Advanced Composites Market

Metric Value
Market Size in 2025 USD 52.4 Billion
Projected Market Size in 2035 USD 123.7 Billion
CAGR (2025 to 2035) 8.9%

Companies are enhancing their product offerings to meet the growing demand for advanced composites. For instance Hexcel Corporation is a global leader in advanced lightweight composites technology continues to innovate in the development of high-performance composite materials. In May 2025, Hexcel Corporation announced that it will demonstrate its latest developments for the Aerospace markets at the Paris Air Show 2025.

“As the aerospace industry gathers at the Paris Air Show, Hexcel will showcase its broad portfolio of innovative lightweight composite technology used across commercial and military aircraft,” said Tom Gentile, Chairman, CEO and President, Hexcel Corporation. “Hexcel’s advanced material solutions enable stronger and lighter aircraft designs, delivering extended range, greater fuel efficiency, and lower emissions. Our commitment to developing high-performance material solutions is shaping the future of flight.”

“With a comprehensive portfolio of high-performance solutions on display, Hexcel continues to shape the future of aerospace manufacturing delivering the materials, technologies, and expertise that enable the industry to fly faster and more efficiently,” concludes Thierry Merlot, Hexcel President

The shift towards sustainable and energy-efficient solutions is influencing the advanced composites market. Manufacturers are focusing on developing composites that are recyclable, bio-based, and made from renewable resources.

Innovations include the integration of nanotechnology to enhance material properties, the development of smart composites with self-healing capabilities, and the use of automated manufacturing processes to improve efficiency and reduce waste. These advancements align with global sustainability goals and regulatory requirements, making advanced composites an attractive option for environmentally conscious industries.

The advanced composites market is poised for significant growth, driven by increasing demand in aerospace, automotive, construction, and renewable energy industries. Companies investing in sustainable materials, innovative designs, and eco-friendly production processes are expected to gain a competitive edge. As global supply chains expand and environmental regulations become more stringent, the adoption of advanced composites is anticipated to rise, offering cost-effective and high-performance solutions for various applications.

Analyzing Advanced Composites Market by Top Investment Segments

Carbon Composites Anticipated to Lead Due to High Strength-to-Weight Ratio and Performance in Extreme Conditions

The carbon composites segment is projected to command approximately 54.7% of the advanced composites market by 2025, as their application across high-performance sectors has been continuously expanded. These composites have been engineered using carbon fibers embedded within polymer matrices, resulting in materials that offer excellent stiffness, fatigue resistance, and thermal stability while maintaining minimal weight.

Widespread adoption has been observed across aerospace, automotive, sporting goods, and energy industries, where structural performance and fuel efficiency are critical. Their superior mechanical characteristics under high stress and corrosive environments have been leveraged extensively in airframes, chassis components, and protective equipment.
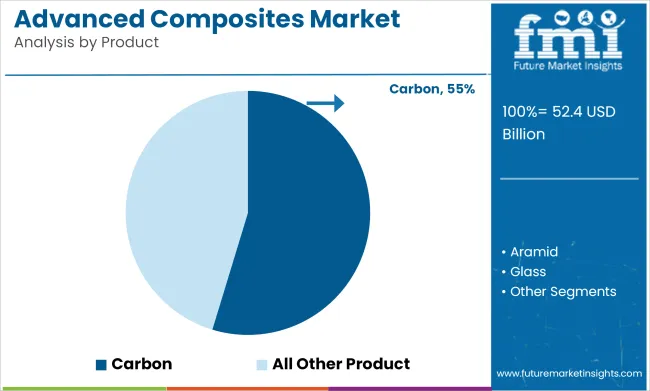
Advanced Composites Market Analysis By Product

Carbon composites have been manufactured with increasing process efficiency, including autoclave curing, resin transfer molding, and filament winding techniques. As recyclability technologies and cost optimization processes have progressed, their accessibility has been broadened across medium- and high-volume production sectors. With stringent emission standards and light weighting targets being enforced, demand for carbon-based composites is expected to be further stimulated, ensuring their continued dominance within the advanced composites product landscape.

Aerospace & Defense to Drive Sales due to Weight Reduction and Mission-Critical Performance

The aerospace and defense sector is forecasted to represent the largest application share in the advanced composites market by 2025, reaching approximately 38.5%, as lightweight and high-strength materials have remained essential in aviation and military applications. Significant structural components ranging from fuselages and wing panels to radar domes and engine nacelles-have been increasingly constructed using advanced composites to reduce weight while enhancing mechanical reliability.

Advanced Composites Market Analysis By  application

Adoption of composites in aerospace programs has been accelerated by both commercial aircraft OEMs and defense contractors, as fuel efficiency, payload capacity, and stealth capabilities have been prioritized. In addition, resistance to fatigue and environmental degradation has enabled extended service life in mission-critical systems.

Stringent regulatory certifications by aviation authorities and military specifications have been consistently met through high-performance composite integration. These materials have also been utilized for unmanned aerial vehicles (UAVs), space structures, and ballistic protection systems due to their customizable stiffness and directional strength. As next-generation aircraft and defense systems continue to emphasize operational efficiency and structural innovation, the aerospace and defense application segment is projected to retain its leading role in the advanced composites market through 2025 and beyond.

Challenges and Opportunities

Challenges

High Production Costs and Complex Manufacturing Processes

The Advanced Composites Market is limited by expensive raw materials and premium manufacturing processes. Advanced composites like carbon fiber and aramid composites require premium production processes, which drive costs up and limit mass-market entry.

Expensive tooling and labor-intensive production drive up total cost of production. The industry stakeholders need to invest in automation, new manufacturing technology, and low-cost raw material acquisition to drive affordability and scalability against this.

Recycling and Environmental Concerns

The recycling of advanced composite materials is one of the greatest challenges because traditional composites are non-biodegradable and have to be broken down through energy-intensive means. Aerospace and automotive industries are being pushed more and more to be more sustainable, but the lack of cheaply available recycling technologies is holding the industry back.

The development of new recycling processes, such as bio-based composite materials, and policy rewards for sustainable production can reverse these environmental concerns and move market take-up forward.

Opportunities

Growing Demand in Aerospace and Automotive Industries

The Advanced Composites Market is being propelled due to the ever-increasing demand for lightweight and high-performance material in aerospace and automotive industries. With the requirements of fuel efficiency, durability enhancement, and emissions reduction, manufacturers are compelled to include advanced composites in aircraft bodies, electric cars, and performance sports cars.

Organizations targeting increasing composite use, enhancing the manufacturing process efficiency, and developing alliances with OEMs will get an upper hand in the marketplace.

Expansion of Advanced Composites in Renewable Energy and Infrastructure

Application of next-generation composites in wind energy, construction, and infrastructure development offers new possibilities for growth. Application of carbon fiber composites by wind energy turbine manufacturers is increasingly being employed to make blades lighter yet more efficient, thereby increasing the potential for energy generation.

Composites are increasingly being applied to bridges, ship construction, and high-speed rail because they are more durable and corrosion-resistant. Companies which invest in composite technology for the infrastructure and energy from renewable resources are likely to be rewarded with this new business segment.
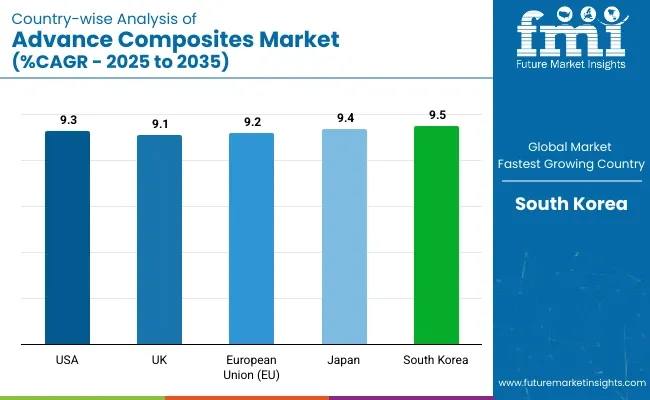
Country-wise Outlook - Advanced Composites Market

Country Wise Analysis Of Advanced Composites Market

United States

North America is expected to dominate the advanced composites market from 2018 to 2023, owing to the growth of the aerospace, automotive, and defense sectors in the United States. Major composite manufacturers in the country invest in research and development, helping to develop new lightweight and high-strength materials.

Market growth is also driven by government initiatives to promote the use of advanced composites in energy-efficient applications. Moreover, an increasing demand from the wind energy sector and the rising use of composites in various applications is propelling the market growth in the country.

Country CAGR (2025 to 2035)
USA 9.3%

United Kingdom

Aerospace and automotive industries in the UK serve as prominent markets for advanced composites. There is an upsurge in investments in carbon fibre and glass fibre composites due to the growing production of electric vehicles and next-generation turbine blades and aircraft.

The rising sustainability projects supported by the government, which promotes sustainable materials, further aids the market expansion through green energy application. Additionally, collaborative research-development efforts between research institutions and manufacturers facilitate innovation in advanced composites technology.

Country CAGR (2025 to 2035)
UK 9.1%

European Union

The European Union’s advanced composites market is currently led by Germany, France and Italy. Known for a strong automotive manufacturing, wind energy and aerospace bases, there's high demand for composite materials.

The European Commission’s sustainable materials and carbon-neutral manufacturing focus is growing investments in recyclable and bio-based composites. Market Growth is fueled by the increase in the funding for R&D of lightweight structures)

Region CAGR (2025 to 2035)
European Union (EU) 9.2%

Japan

Japan is also a major market, with expertise in high-performance materials and robotics contributing to the advanced composites sector. Demand for both lightweight and durable composites is fueled by the country’s advanced manufacturing sector, especially in automotive and electronics.

Furthermore, investments in carbon fiber technology and government-supported research programs propel market growth. Japan's interest in sustainable composites also aligns with international environmental programmes.

Country CAGR (2025 to 2035)
Japan 9.4%

South Korea

South Korea is one of the fastest-growing advanced composites markets, backed by robust automotive and electronics industries. The country’s top companies are harnessing high-performance composites for electric vehicles and applications in renewable energy.

The national policies fostering innovation in materials science and the expanded partnerships with international manufacturers strengthen the country’s market position. Industry growth is further driven by South Korea's specialisation in nanocomposites and smart materials.

Country CAGR (2025 to 2035)
South Korea 9.5%

Competitive Outlook

The enhanced composites market is propelled by the rising need and application of lightweight in aircraft, automotive, and sustainable energy industries. The companies are targeting the technological advancements in composite manufacturing, sustainable material solutions, and artificial intelligence (AI) driven quality control processes. Advancements in thermoset composites, carbon fiber reinforcement, and automation of the manufacturing process are revolutionizing the field.
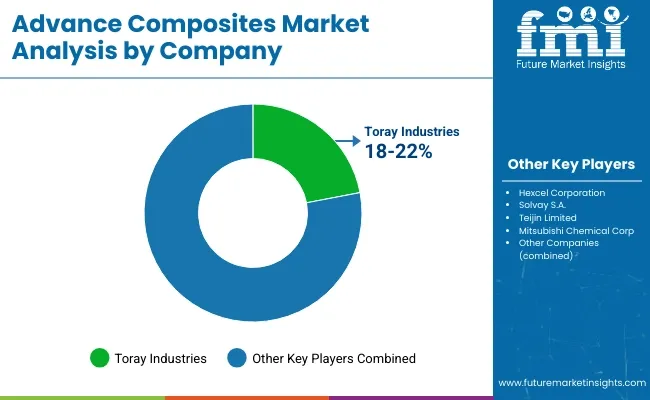
Key Company Insights

Advanced Composites Market Analysis Of Company

Toray Industries (18-22%)

Toray occupies a near-monopoly position in the carbon fiber market, with proprietary resin and fiber technology that can improve performance in aerospace and automotive markets.

Hexcel Corporation (14-18%)

Hexcel is a crucial player in high-performance aerospace composites with a focus on lighter, strong materials, for commercial and defense planes.

Solvay S.A. (10-14%)

Solvay is known to be a leader in thermoplastics composites and provides advanced material solutions to help customers create lighter components, improve fuel efficiency and increase structural integrity.

Teijin Limited (8-12%)

Teijin's core business is in aramid and carbon fiber composites for industrial applications, including next-generation mobility.

Mitsubishi Chemical Corporation (6-10%)

Mitsubishi Chemical is making an investment in eco-friendly composite solutions that focus on bio-based, renewable and recyclable materials as part of sustainable manufacturing, as per the company.

Other Key Players (40-50% Combined)

Dozens of companies are pushing innovations in advanced composites, particularly around next-gen materials and automation-based production methods. Key players include:

  • SGL Carbon (Advancing carbon fiber solutions for industrial and energy applications.)
  • Royal DSM (Developing bio-based composite materials and high-performance thermoplastics.)
  • Arkema S.A. (Pioneering nanotechnology-infused composites for enhanced durability and strength.)
  • Huntsman Corporation (Leading in specialty epoxy resins and structural adhesives for composite bonding.)
  • Owens Corning (Innovating in glass fiber composite solutions for infrastructure and wind energy applications.)

Top Segments Studied in the Advanced Composites Market Research Report

By Product:

  • Aramid
  • Carbon
  • Glass

By Application:

  • Aerospace & Defense
  • Automotive
  • Construction
  • Sporting Goods
  • Wind Energy

By Regions Covered:

  • North America
  • Latin America
  • Western Europe
  • Eastern Europe
  • East Asia
  • South Asia Pacific
  • Middle East and Africa

Table of Content

  1. Executive Summary
  2. Industry Introduction, including Taxonomy and Market Definition
  3. Trends and Success Factors, including Macro-economic Factors, Market Dynamics, and Recent Industry Developments
  4. Global Market Demand Analysis 2020 to 2024 and Forecast 2025 to 2035, including Historical Analysis and Future Projections
  5. Global Market Analysis 2020 to 2024 and Forecast 2025 to 2035
    • By Product
    • By Application
    • By Regions Covered
  6. Global Market Analysis 2020 to 2024 and Forecast 2025 to 2035, By Product
    • Aramid
    • Carbon
    • Glass
  7. Global Market Analysis 2020 to 2024 and Forecast 2025 to 2035, By Application
    • Aerospace & Defense
    • Automotive
    • Construction
    • Sporting Goods
    • Wind Energy
  8. Global Market Analysis 2020 to 2024 and Forecast 2025 to 2035, By Regions Covered
    • North America
    • Latin America
    • Western Europe
    • Eastern Europe
    • East Asia
    • South Asia Pacific
    • Middle East and Africa
  9. North America Sales Analysis 2020 to 2024 and Forecast 2025 to 2035, by Key Segments and Countries
  10. Latin America Sales Analysis 2020 to 2024 and Forecast 2025 to 2035, by Key Segments and Countries
  11. Western Europe Sales Analysis 2020 to 2024 and Forecast 2025 to 2035, by Key Segments and Countries
  12. Eastern Europe Sales Analysis 2020 to 2024 and Forecast 2025 to 2035, by Key Segments and Countries
  13. East Asia Sales Analysis 2020 to 2024 and Forecast 2025 to 2035, by Key Segments and Countries
  14. South Asia Pacific Sales Analysis 2020 to 2024 and Forecast 2025 to 2035, by Key Segments and Countries
  15. Middle East & Africa Sales Analysis 2020 to 2024 and Forecast 2025 to 2035, by Key Segments and Countries
  16. Sales Forecast to 2035 by Product, Application, and Regions Covered for 30 Countries
  17. Competitive Assessment, Company Share Analysis by Key Players, and Competition Dashboard
  18. Company Profile
    • Toray Industries, Inc.
    • Koninklijke Ten Cate NV
    • Teijin Limited
    • Hexcel Corporation
    • SGL Group
    • Cytec Solvay Group
    • E. I. DuPont De Nemours and Company
    • Huntsman Corporation
    • Momentive Performance Materials Inc.
    • WS Atkins plc

List of Tables

  • Table 1: Global Market Value (US$ Million) Forecast by Region, 2020 to 2035
  • Table 2: Global Market Volume (Tons) Forecast by Region, 2020 to 2035
  • Table 3: Global Market Value (US$ Million) Forecast by Product, 2020 to 2035
  • Table 4: Global Market Volume (Tons) Forecast by Product, 2020 to 2035
  • Table 5: Global Market Value (US$ Million) Forecast by Application, 2020 to 2035
  • Table 6: Global Market Volume (Tons) Forecast by Application, 2020 to 2035
  • Table 7: North America Market Value (US$ Million) Forecast by Country, 2020 to 2035
  • Table 8: North America Market Volume (Tons) Forecast by Country, 2020 to 2035
  • Table 9: North America Market Value (US$ Million) Forecast by Product, 2020 to 2035
  • Table 10: North America Market Volume (Tons) Forecast by Product, 2020 to 2035
  • Table 11: North America Market Value (US$ Million) Forecast by Application, 2020 to 2035
  • Table 12: North America Market Volume (Tons) Forecast by Application, 2020 to 2035
  • Table 13: Latin America Market Value (US$ Million) Forecast by Country, 2020 to 2035
  • Table 14: Latin America Market Volume (Tons) Forecast by Country, 2020 to 2035
  • Table 15: Latin America Market Value (US$ Million) Forecast by Product, 2020 to 2035
  • Table 16: Latin America Market Volume (Tons) Forecast by Product, 2020 to 2035
  • Table 17: Latin America Market Value (US$ Million) Forecast by Application, 2020 to 2035
  • Table 18: Latin America Market Volume (Tons) Forecast by Application, 2020 to 2035
  • Table 19: Western Europe Market Value (US$ Million) Forecast by Country, 2020 to 2035
  • Table 20: Western Europe Market Volume (Tons) Forecast by Country, 2020 to 2035
  • Table 21: Western Europe Market Value (US$ Million) Forecast by Product, 2020 to 2035
  • Table 22: Western Europe Market Volume (Tons) Forecast by Product, 2020 to 2035
  • Table 23: Western Europe Market Value (US$ Million) Forecast by Application, 2020 to 2035
  • Table 24: Western Europe Market Volume (Tons) Forecast by Application, 2020 to 2035
  • Table 25: Eastern Europe Market Value (US$ Million) Forecast by Country, 2020 to 2035
  • Table 26: Eastern Europe Market Volume (Tons) Forecast by Country, 2020 to 2035
  • Table 27: Eastern Europe Market Value (US$ Million) Forecast by Product, 2020 to 2035
  • Table 28: Eastern Europe Market Volume (Tons) Forecast by Product, 2020 to 2035
  • Table 29: Eastern Europe Market Value (US$ Million) Forecast by Application, 2020 to 2035
  • Table 30: Eastern Europe Market Volume (Tons) Forecast by Application, 2020 to 2035
  • Table 31: South Asia and Pacific Market Value (US$ Million) Forecast by Country, 2020 to 2035
  • Table 32: South Asia and Pacific Market Volume (Tons) Forecast by Country, 2020 to 2035
  • Table 33: South Asia and Pacific Market Value (US$ Million) Forecast by Product, 2020 to 2035
  • Table 34: South Asia and Pacific Market Volume (Tons) Forecast by Product, 2020 to 2035
  • Table 35: South Asia and Pacific Market Value (US$ Million) Forecast by Application, 2020 to 2035
  • Table 36: South Asia and Pacific Market Volume (Tons) Forecast by Application, 2020 to 2035
  • Table 37: East Asia Market Value (US$ Million) Forecast by Country, 2020 to 2035
  • Table 38: East Asia Market Volume (Tons) Forecast by Country, 2020 to 2035
  • Table 39: East Asia Market Value (US$ Million) Forecast by Product, 2020 to 2035
  • Table 40: East Asia Market Volume (Tons) Forecast by Product, 2020 to 2035
  • Table 41: East Asia Market Value (US$ Million) Forecast by Application, 2020 to 2035
  • Table 42: East Asia Market Volume (Tons) Forecast by Application, 2020 to 2035
  • Table 43: Middle East and Africa Market Value (US$ Million) Forecast by Country, 2020 to 2035
  • Table 44: Middle East and Africa Market Volume (Tons) Forecast by Country, 2020 to 2035
  • Table 45: Middle East and Africa Market Value (US$ Million) Forecast by Product, 2020 to 2035
  • Table 46: Middle East and Africa Market Volume (Tons) Forecast by Product, 2020 to 2035
  • Table 47: Middle East and Africa Market Value (US$ Million) Forecast by Application, 2020 to 2035
  • Table 48: Middle East and Africa Market Volume (Tons) Forecast by Application, 2020 to 2035

List of Figures

  • Figure 1: Global Market Value (US$ Million) by Product, 2025 to 2035
  • Figure 2: Global Market Value (US$ Million) by Application, 2025 to 2035
  • Figure 3: Global Market Value (US$ Million) by Region, 2025 to 2035
  • Figure 4: Global Market Value (US$ Million) Analysis by Region, 2020 to 2035
  • Figure 5: Global Market Volume (Tons) Analysis by Region, 2020 to 2035
  • Figure 6: Global Market Value Share (%) and BPS Analysis by Region, 2025 to 2035
  • Figure 7: Global Market Y-o-Y Growth (%) Projections by Region, 2025 to 2035
  • Figure 8: Global Market Value (US$ Million) Analysis by Product, 2020 to 2035
  • Figure 9: Global Market Volume (Tons) Analysis by Product, 2020 to 2035
  • Figure 10: Global Market Value Share (%) and BPS Analysis by Product, 2025 to 2035
  • Figure 11: Global Market Y-o-Y Growth (%) Projections by Product, 2025 to 2035
  • Figure 12: Global Market Value (US$ Million) Analysis by Application, 2020 to 2035
  • Figure 13: Global Market Volume (Tons) Analysis by Application, 2020 to 2035
  • Figure 14: Global Market Value Share (%) and BPS Analysis by Application, 2025 to 2035
  • Figure 15: Global Market Y-o-Y Growth (%) Projections by Application, 2025 to 2035
  • Figure 16: Global Market Attractiveness by Product, 2025 to 2035
  • Figure 17: Global Market Attractiveness by Application, 2025 to 2035
  • Figure 18: Global Market Attractiveness by Region, 2025 to 2035
  • Figure 19: North America Market Value (US$ Million) by Product, 2025 to 2035
  • Figure 20: North America Market Value (US$ Million) by Application, 2025 to 2035
  • Figure 21: North America Market Value (US$ Million) by Country, 2025 to 2035
  • Figure 22: North America Market Value (US$ Million) Analysis by Country, 2020 to 2035
  • Figure 23: North America Market Volume (Tons) Analysis by Country, 2020 to 2035
  • Figure 24: North America Market Value Share (%) and BPS Analysis by Country, 2025 to 2035
  • Figure 25: North America Market Y-o-Y Growth (%) Projections by Country, 2025 to 2035
  • Figure 26: North America Market Value (US$ Million) Analysis by Product, 2020 to 2035
  • Figure 27: North America Market Volume (Tons) Analysis by Product, 2020 to 2035
  • Figure 28: North America Market Value Share (%) and BPS Analysis by Product, 2025 to 2035
  • Figure 29: North America Market Y-o-Y Growth (%) Projections by Product, 2025 to 2035
  • Figure 30: North America Market Value (US$ Million) Analysis by Application, 2020 to 2035
  • Figure 31: North America Market Volume (Tons) Analysis by Application, 2020 to 2035
  • Figure 32: North America Market Value Share (%) and BPS Analysis by Application, 2025 to 2035
  • Figure 33: North America Market Y-o-Y Growth (%) Projections by Application, 2025 to 2035
  • Figure 34: North America Market Attractiveness by Product, 2025 to 2035
  • Figure 35: North America Market Attractiveness by Application, 2025 to 2035
  • Figure 36: North America Market Attractiveness by Country, 2025 to 2035
  • Figure 37: Latin America Market Value (US$ Million) by Product, 2025 to 2035
  • Figure 38: Latin America Market Value (US$ Million) by Application, 2025 to 2035
  • Figure 39: Latin America Market Value (US$ Million) by Country, 2025 to 2035
  • Figure 40: Latin America Market Value (US$ Million) Analysis by Country, 2020 to 2035
  • Figure 41: Latin America Market Volume (Tons) Analysis by Country, 2020 to 2035
  • Figure 42: Latin America Market Value Share (%) and BPS Analysis by Country, 2025 to 2035
  • Figure 43: Latin America Market Y-o-Y Growth (%) Projections by Country, 2025 to 2035
  • Figure 44: Latin America Market Value (US$ Million) Analysis by Product, 2020 to 2035
  • Figure 45: Latin America Market Volume (Tons) Analysis by Product, 2020 to 2035
  • Figure 46: Latin America Market Value Share (%) and BPS Analysis by Product, 2025 to 2035
  • Figure 47: Latin America Market Y-o-Y Growth (%) Projections by Product, 2025 to 2035
  • Figure 48: Latin America Market Value (US$ Million) Analysis by Application, 2020 to 2035
  • Figure 49: Latin America Market Volume (Tons) Analysis by Application, 2020 to 2035
  • Figure 50: Latin America Market Value Share (%) and BPS Analysis by Application, 2025 to 2035
  • Figure 51: Latin America Market Y-o-Y Growth (%) Projections by Application, 2025 to 2035
  • Figure 52: Latin America Market Attractiveness by Product, 2025 to 2035
  • Figure 53: Latin America Market Attractiveness by Application, 2025 to 2035
  • Figure 54: Latin America Market Attractiveness by Country, 2025 to 2035
  • Figure 55: Western Europe Market Value (US$ Million) by Product, 2025 to 2035
  • Figure 56: Western Europe Market Value (US$ Million) by Application, 2025 to 2035
  • Figure 57: Western Europe Market Value (US$ Million) by Country, 2025 to 2035
  • Figure 58: Western Europe Market Value (US$ Million) Analysis by Country, 2020 to 2035
  • Figure 59: Western Europe Market Volume (Tons) Analysis by Country, 2020 to 2035
  • Figure 60: Western Europe Market Value Share (%) and BPS Analysis by Country, 2025 to 2035
  • Figure 61: Western Europe Market Y-o-Y Growth (%) Projections by Country, 2025 to 2035
  • Figure 62: Western Europe Market Value (US$ Million) Analysis by Product, 2020 to 2035
  • Figure 63: Western Europe Market Volume (Tons) Analysis by Product, 2020 to 2035
  • Figure 64: Western Europe Market Value Share (%) and BPS Analysis by Product, 2025 to 2035
  • Figure 65: Western Europe Market Y-o-Y Growth (%) Projections by Product, 2025 to 2035
  • Figure 66: Western Europe Market Value (US$ Million) Analysis by Application, 2020 to 2035
  • Figure 67: Western Europe Market Volume (Tons) Analysis by Application, 2020 to 2035
  • Figure 68: Western Europe Market Value Share (%) and BPS Analysis by Application, 2025 to 2035
  • Figure 69: Western Europe Market Y-o-Y Growth (%) Projections by Application, 2025 to 2035
  • Figure 70: Western Europe Market Attractiveness by Product, 2025 to 2035
  • Figure 71: Western Europe Market Attractiveness by Application, 2025 to 2035
  • Figure 72: Western Europe Market Attractiveness by Country, 2025 to 2035
  • Figure 73: Eastern Europe Market Value (US$ Million) by Product, 2025 to 2035
  • Figure 74: Eastern Europe Market Value (US$ Million) by Application, 2025 to 2035
  • Figure 75: Eastern Europe Market Value (US$ Million) by Country, 2025 to 2035
  • Figure 76: Eastern Europe Market Value (US$ Million) Analysis by Country, 2020 to 2035
  • Figure 77: Eastern Europe Market Volume (Tons) Analysis by Country, 2020 to 2035
  • Figure 78: Eastern Europe Market Value Share (%) and BPS Analysis by Country, 2025 to 2035
  • Figure 79: Eastern Europe Market Y-o-Y Growth (%) Projections by Country, 2025 to 2035
  • Figure 80: Eastern Europe Market Value (US$ Million) Analysis by Product, 2020 to 2035
  • Figure 81: Eastern Europe Market Volume (Tons) Analysis by Product, 2020 to 2035
  • Figure 82: Eastern Europe Market Value Share (%) and BPS Analysis by Product, 2025 to 2035
  • Figure 83: Eastern Europe Market Y-o-Y Growth (%) Projections by Product, 2025 to 2035
  • Figure 84: Eastern Europe Market Value (US$ Million) Analysis by Application, 2020 to 2035
  • Figure 85: Eastern Europe Market Volume (Tons) Analysis by Application, 2020 to 2035
  • Figure 86: Eastern Europe Market Value Share (%) and BPS Analysis by Application, 2025 to 2035
  • Figure 87: Eastern Europe Market Y-o-Y Growth (%) Projections by Application, 2025 to 2035
  • Figure 88: Eastern Europe Market Attractiveness by Product, 2025 to 2035
  • Figure 89: Eastern Europe Market Attractiveness by Application, 2025 to 2035
  • Figure 90: Eastern Europe Market Attractiveness by Country, 2025 to 2035
  • Figure 91: South Asia and Pacific Market Value (US$ Million) by Product, 2025 to 2035
  • Figure 92: South Asia and Pacific Market Value (US$ Million) by Application, 2025 to 2035
  • Figure 93: South Asia and Pacific Market Value (US$ Million) by Country, 2025 to 2035
  • Figure 94: South Asia and Pacific Market Value (US$ Million) Analysis by Country, 2020 to 2035
  • Figure 95: South Asia and Pacific Market Volume (Tons) Analysis by Country, 2020 to 2035
  • Figure 96: South Asia and Pacific Market Value Share (%) and BPS Analysis by Country, 2025 to 2035
  • Figure 97: South Asia and Pacific Market Y-o-Y Growth (%) Projections by Country, 2025 to 2035
  • Figure 98: South Asia and Pacific Market Value (US$ Million) Analysis by Product, 2020 to 2035
  • Figure 99: South Asia and Pacific Market Volume (Tons) Analysis by Product, 2020 to 2035
  • Figure 100: South Asia and Pacific Market Value Share (%) and BPS Analysis by Product, 2025 to 2035
  • Figure 101: South Asia and Pacific Market Y-o-Y Growth (%) Projections by Product, 2025 to 2035
  • Figure 102: South Asia and Pacific Market Value (US$ Million) Analysis by Application, 2020 to 2035
  • Figure 103: South Asia and Pacific Market Volume (Tons) Analysis by Application, 2020 to 2035
  • Figure 104: South Asia and Pacific Market Value Share (%) and BPS Analysis by Application, 2025 to 2035
  • Figure 105: South Asia and Pacific Market Y-o-Y Growth (%) Projections by Application, 2025 to 2035
  • Figure 106: South Asia and Pacific Market Attractiveness by Product, 2025 to 2035
  • Figure 107: South Asia and Pacific Market Attractiveness by Application, 2025 to 2035
  • Figure 108: South Asia and Pacific Market Attractiveness by Country, 2025 to 2035
  • Figure 109: East Asia Market Value (US$ Million) by Product, 2025 to 2035
  • Figure 110: East Asia Market Value (US$ Million) by Application, 2025 to 2035
  • Figure 111: East Asia Market Value (US$ Million) by Country, 2025 to 2035
  • Figure 112: East Asia Market Value (US$ Million) Analysis by Country, 2020 to 2035
  • Figure 113: East Asia Market Volume (Tons) Analysis by Country, 2020 to 2035
  • Figure 114: East Asia Market Value Share (%) and BPS Analysis by Country, 2025 to 2035
  • Figure 115: East Asia Market Y-o-Y Growth (%) Projections by Country, 2025 to 2035
  • Figure 116: East Asia Market Value (US$ Million) Analysis by Product, 2020 to 2035
  • Figure 117: East Asia Market Volume (Tons) Analysis by Product, 2020 to 2035
  • Figure 118: East Asia Market Value Share (%) and BPS Analysis by Product, 2025 to 2035
  • Figure 119: East Asia Market Y-o-Y Growth (%) Projections by Product, 2025 to 2035
  • Figure 120: East Asia Market Value (US$ Million) Analysis by Application, 2020 to 2035
  • Figure 121: East Asia Market Volume (Tons) Analysis by Application, 2020 to 2035
  • Figure 122: East Asia Market Value Share (%) and BPS Analysis by Application, 2025 to 2035
  • Figure 123: East Asia Market Y-o-Y Growth (%) Projections by Application, 2025 to 2035
  • Figure 124: East Asia Market Attractiveness by Product, 2025 to 2035
  • Figure 125: East Asia Market Attractiveness by Application, 2025 to 2035
  • Figure 126: East Asia Market Attractiveness by Country, 2025 to 2035
  • Figure 127: Middle East and Africa Market Value (US$ Million) by Product, 2025 to 2035
  • Figure 128: Middle East and Africa Market Value (US$ Million) by Application, 2025 to 2035
  • Figure 129: Middle East and Africa Market Value (US$ Million) by Country, 2025 to 2035
  • Figure 130: Middle East and Africa Market Value (US$ Million) Analysis by Country, 2020 to 2035
  • Figure 131: Middle East and Africa Market Volume (Tons) Analysis by Country, 2020 to 2035
  • Figure 132: Middle East and Africa Market Value Share (%) and BPS Analysis by Country, 2025 to 2035
  • Figure 133: Middle East and Africa Market Y-o-Y Growth (%) Projections by Country, 2025 to 2035
  • Figure 134: Middle East and Africa Market Value (US$ Million) Analysis by Product, 2020 to 2035
  • Figure 135: Middle East and Africa Market Volume (Tons) Analysis by Product, 2020 to 2035
  • Figure 136: Middle East and Africa Market Value Share (%) and BPS Analysis by Product, 2025 to 2035
  • Figure 137: Middle East and Africa Market Y-o-Y Growth (%) Projections by Product, 2025 to 2035
  • Figure 138: Middle East and Africa Market Value (US$ Million) Analysis by Application, 2020 to 2035
  • Figure 139: Middle East and Africa Market Volume (Tons) Analysis by Application, 2020 to 2035
  • Figure 140: Middle East and Africa Market Value Share (%) and BPS Analysis by Application, 2025 to 2035
  • Figure 141: Middle East and Africa Market Y-o-Y Growth (%) Projections by Application, 2025 to 2035
  • Figure 142: Middle East and Africa Market Attractiveness by Product, 2025 to 2035
  • Figure 143: Middle East and Africa Market Attractiveness by Application, 2025 to 2035
  • Figure 144: Middle East and Africa Market Attractiveness by Country, 2025 to 2035

Frequently Asked Questions

What was the overall size of the advanced composites market in 2025?

The overall market size for advanced composites market USD 52.4 Billion was in 2025.

How big the Bio is based advanced composites market expected in 2035?

The advanced composites market expected to reach USD 123.7 Billion in 2035.

What will drive the demand for advanced composites market during the forecast period?

The demand for the advanced composites market will be driven by increasing applications in aerospace and defense, rising adoption in automotive light weighting, growing demand in renewable energy sectors like wind energy, advancements in manufacturing technologies, and the need for high-strength, durable, and corrosion-resistant materials.

List the top 5 countries contributing advanced composites market

The top 5 countries which drives the development of advanced composites market are USA, UK, Europe Union, Japan and South Korea.

Which segment in type is expected to lead in advanced composites market?

Aerospace & Defense and Automotive sectors growth to command significant share over the assessment period.

Explore Similar Insights

Future Market Insights

Advanced Composites Market