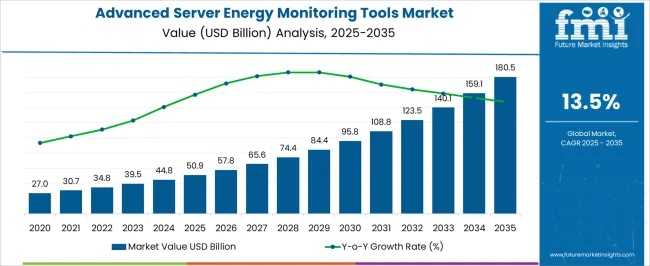
The Advanced Server Energy Monitoring Tools Market is estimated to be valued at USD 50.9 billion in 2025 and is projected to reach USD 180.5 billion by 2035, registering a compound annual growth rate (CAGR) of 13.5% over the forecast period.

| Metric | Value |
|---|---|
| Advanced Server Energy Monitoring Tools Market Estimated Value in (2025 E) | USD 50.9 billion |
| Advanced Server Energy Monitoring Tools Market Forecast Value in (2035 F) | USD 180.5 billion |
| Forecast CAGR (2025 to 2035) | 13.5% |
The Advanced Server Energy Monitoring Tools Market is witnessing strong momentum due to growing enterprise focus on energy optimization, sustainability goals, and real-time server infrastructure management. Enterprises and data centers are increasingly adopting advanced monitoring tools to reduce energy waste, improve operational efficiency, and support compliance with global environmental standards.
Corporate sustainability initiatives, combined with rising energy costs, are pushing IT infrastructure teams to integrate intelligent monitoring solutions that allow for granular visibility into server power usage. This market growth is also influenced by heightened emphasis on uptime, regulatory pressure to lower carbon emissions, and the rising complexity of distributed server environments.
Recent product rollouts and investor communications from major tech firms have reinforced the demand for scalable, software-defined monitoring systems that can be deployed across diverse server architectures With cloud computing, AI workloads, and edge data centers expanding globally, the need for high-efficiency server monitoring tools is expected to remain critical, paving the way for consistent long-term market expansion.
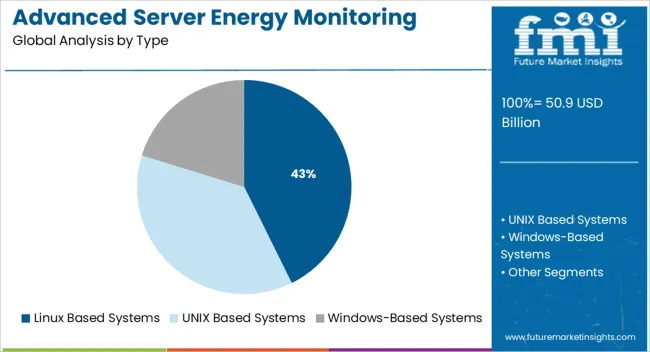
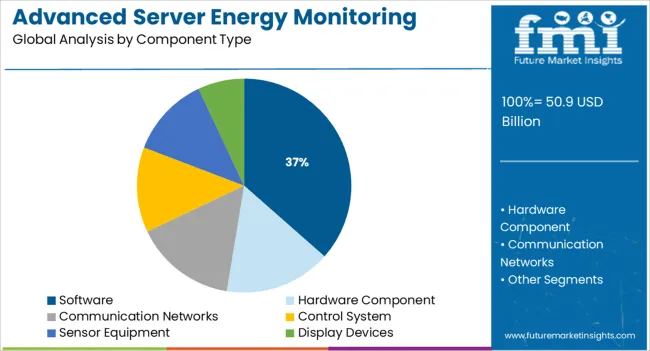
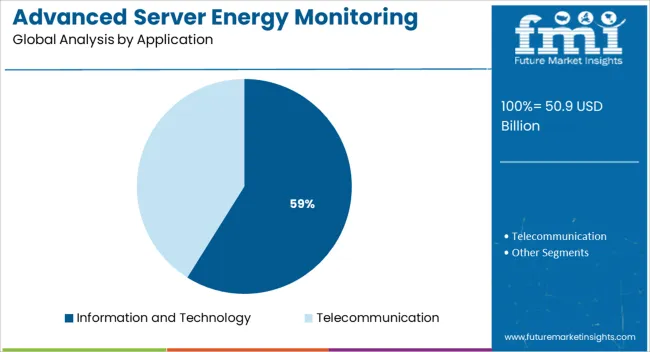
The market is segmented by Type, Component Type, and Application and region. By Type, the market is divided into Linux Based Systems, UNIX Based Systems, and Windows-Based Systems. In terms of Component Type, the market is classified into Software, Hardware Component, Communication Networks, Control System, Sensor Equipment, and Display Devices. Based on Application, the market is segmented into Information and Technology and Telecommunication. Regionally, the market is classified into North America, Latin America, Western Europe, Eastern Europe, Balkan & Baltic Countries, Russia & Belarus, Central Asia, East Asia, South Asia & Pacific, and the Middle East & Africa.

The Linux based systems segment is projected to account for 42.7% of the Advanced Server Energy Monitoring Tools Market revenue share in 2025, making it the dominant type in the market. This leadership position has been supported by the widespread deployment of Linux operating environments in data centers, high-performance computing, and cloud infrastructure. The open-source nature of Linux enables seamless integration with custom monitoring tools and APIs, providing organizations with a high degree of flexibility and control.
Enterprises have increasingly preferred Linux based systems due to their scalability, stability, and lower licensing costs. The segment’s growth has also been driven by enhanced support for energy management extensions and compatibility with modern virtualization platforms.
Additionally, data center managers have adopted Linux based energy monitoring systems for their ability to offer deeper visibility and configuration options tailored to complex IT environments These advantages have ensured that Linux based systems remain the leading type segment in the market.

The software segment is anticipated to capture 36.5% of the Advanced Server Energy Monitoring Tools Market revenue share in 2025, maintaining a strong foothold within the component type category. Growth in this segment has been influenced by the shift from traditional hardware-centric monitoring solutions to intelligent software-driven platforms. Enterprises are favoring software tools that provide real-time analytics, automated reporting, and customizable dashboards to track server energy consumption and optimize power usage.
The flexibility of software solutions to scale across hybrid and multi-cloud environments has been a key contributor to adoption, particularly among large organizations with diverse infrastructure needs. Furthermore, software offerings are being enhanced with machine learning capabilities, enabling predictive maintenance and smarter energy allocation strategies.
As noted in industry updates and enterprise tech briefings, demand for subscription-based and cloud-native monitoring tools has further strengthened the role of software in delivering sustainable IT operations These dynamics have reinforced the software segment’s position in the overall market.

The information and technology application segment is expected to contribute 58.9% of the Advanced Server Energy Monitoring Tools Market revenue share in 2025, securing its role as the leading application area. This growth is being driven by the rising number of data centers, cloud service providers, and enterprise IT departments that require precise monitoring tools to manage energy use efficiently. Organizations in the IT sector are under increasing pressure to optimize energy consumption while ensuring high availability and system performance.
The segment has benefited from the industry’s proactive approach to green computing, regulatory compliance, and sustainability targets. Technology firms are investing in energy monitoring to reduce operational costs, improve resource utilization, and align with environmental goals.
Additionally, the adoption of AI and edge computing within IT infrastructure has increased the need for energy-aware systems that can adapt dynamically to workload changes These trends have firmly established the information and technology segment as the largest contributor to market revenues.
According to FMI market analysis, the Advanced Server Energy Monitoring Tools market from 2020 to 2025 exhibited a historical growth rate of 9.4% CAGR. This historical growth is attributed to the continuous advancements in the information technology sector and the extensive use of data centers, in which efficient management of energy distribution, consumption, and allocation is important.
The demand for sophisticated server energy monitoring solutions is being driven by the requirement for clear management of consumption and allocation across numerous industry sectors.
However, according to the most recent FMI analysis, the market is expected to grow at a rate of 13.5% between 2025 and 2035. Advanced Server Energy Monitoring Tools are used to collect, comprehend, and simplify data.
It is very affordable to implement these tools into an existing system to not only identify the wastage of energy but also reduce or eliminate it, which leads to proper energy management, which refers to the dynamic management of server components performance to reduce power consumption.
This helps small and large organizations to measure, evaluate, and reduce up to 30% of their energy costs, which lessens the negative financial and environmental effects of inefficient energy consumption. Based on these features and facts, the Advanced Server Energy Monitoring Tools market is expected to witness significant growth during the forecast period.
Globally, organizations' profitability is being impacted by an increase in incidents connected to energy loss and inefficient distribution. In order to maximize the use of various energy resources and reduce energy loss, various end-use businesses are moving toward sophisticated server energy monitoring technologies. This helps to boost productivity and generate more revenue.
The demand for advanced server energy monitoring tools is likely to increase in the near future due to factors like the growing popularity of cloud computing, the growing demand for real-time data analytics, the increased need for reliable and efficient information technology platforms for monitoring, controlling, and optimizing energy resources in various end-use industries, and the increasing adoption of advanced energy monitoring tools to advance various business channels.
With the advancement of technology, the global key players are highly focused on launching their solutions with many advanced features, which include a high investment cost that is restricting the other players from entering the market.
Over the forecast period, the market is estimated to be hampered by factors such as the need for a large amount of investment capital, the high cost of energy monitoring tools, the presence of international key players with high-cost services, and a lack of awareness towards energy-efficient systems in emerging nations, which will lead to slow adoption of new technologies and limit the market growth.
The market for advanced server energy monitoring technologies is also growing as a result of increased government involvement, particularly in Europe and the USA, in efforts to increase energy savings potential and cut consumption.
The market for sophisticated server energy monitoring tools is likely to experience considerable growth in the coming year as a result of the rising adoption of ASPs, SaaS, and cloud computing technologies. Hence, these regions are expected to create noteworthy sales opportunities during the forecast period.
In the Asia Pacific region, especially in China and India, booms in the telecommunications and IT sectors are projected to create a sustainable demand for server energy monitoring tools during the assessment period. Market opportunities for advanced server energy monitoring tools are expected to remain limited in Latin America, the Middle East, and Africa due to limited IT infrastructure.
Key players in the global Advanced Server Energy Monitoring Tool Market are HP, IBM, Sun Microsystems, Alstom, ABB, OSI and Siemens, and others.
With the strong presence of several global and local players, the market appears to be highly competitive. The growing IT sector and industrial sector with rising automation in industrial sectors will present opportunities for key market participants.
| Attribute | Details |
|---|---|
| Growth Rate | CAGR of 13.5% from 2025 to 2035 |
| Base Year for Estimation | 2025 |
| Historical Data | 2020 to 2025 |
| Forecast Period | 2025 to 2035 |
| Quantitative Units | Revenue in USD Million, Volume in 000Units, and CAGR from 2025 to 2035 |
| Report Coverage | Revenue Forecast, Volume Forecast, Company Ranking, Competitive Landscape, Growth Factors, Trends, and Pricing Analysis |
| Segments Covered | Type, Component Type, Application, Region |
| Regions Covered | North America; Latin America; Europe; East Asia; South Asia Pacific; Middle East and Africa |
| Key Countries Covered | USA, Canada, Mexico, Brazil, Germany, Italy, France, United Kingdom, Spain, Benelux, Russia, China, Japan, South Korea, India, ASEAN, Australia and New Zealand, GCC Countries, Turkey, South Africa, North Africa |
| Key Companies Profiled | HP; IBM; Sun Microsystems; Alstom; ABB; OSI; Siemens; Cisco System; Dell |
| Customization Pricing | Available upon Request |
The global advanced server energy monitoring tools market is estimated to be valued at USD 50.9 billion in 2025.
The market size for the advanced server energy monitoring tools market is projected to reach USD 180.5 billion by 2035.
The advanced server energy monitoring tools market is expected to grow at a 13.5% CAGR between 2025 and 2035.
The key product types in advanced server energy monitoring tools market are linux based systems, unix based systems and windows-based systems.
In terms of component type, software segment to command 36.5% share in the advanced server energy monitoring tools market in 2025.


Our Research Products

The "Full Research Suite" delivers actionable market intel, deep dives on markets or technologies, so clients act faster, cut risk, and unlock growth.

The Leaderboard benchmarks and ranks top vendors, classifying them as Established Leaders, Leading Challengers, or Disruptors & Challengers.

Locates where complements amplify value and substitutes erode it, forecasting net impact by horizon

We deliver granular, decision-grade intel: market sizing, 5-year forecasts, pricing, adoption, usage, revenue, and operational KPIs—plus competitor tracking, regulation, and value chains—across 60 countries broadly.

Spot the shifts before they hit your P&L. We track inflection points, adoption curves, pricing moves, and ecosystem plays to show where demand is heading, why it is changing, and what to do next across high-growth markets and disruptive tech

Real-time reads of user behavior. We track shifting priorities, perceptions of today’s and next-gen services, and provider experience, then pace how fast tech moves from trial to adoption, blending buyer, consumer, and channel inputs with social signals (#WhySwitch, #UX).

Partner with our analyst team to build a custom report designed around your business priorities. From analysing market trends to assessing competitors or crafting bespoke datasets, we tailor insights to your needs.
Supplier Intelligence
Discovery & Profiling
Capacity & Footprint
Performance & Risk
Compliance & Governance
Commercial Readiness
Who Supplies Whom
Scorecards & Shortlists
Playbooks & Docs
Category Intelligence
Definition & Scope
Demand & Use Cases
Cost Drivers
Market Structure
Supply Chain Map
Trade & Policy
Operating Norms
Deliverables
Buyer Intelligence
Account Basics
Spend & Scope
Procurement Model
Vendor Requirements
Terms & Policies
Entry Strategy
Pain Points & Triggers
Outputs
Pricing Analysis
Benchmarks
Trends
Should-Cost
Indexation
Landed Cost
Commercial Terms
Deliverables
Brand Analysis
Positioning & Value Prop
Share & Presence
Customer Evidence
Go-to-Market
Digital & Reputation
Compliance & Trust
KPIs & Gaps
Outputs
Full Research Suite comprises of:
Market outlook & trends analysis
Interviews & case studies
Strategic recommendations
Vendor profiles & capabilities analysis
5-year forecasts
8 regions and 60+ country-level data splits
Market segment data splits
12 months of continuous data updates
DELIVERED AS:
PDF EXCEL ONLINE
Advanced Energy Storage System Market Size and Share Forecast Outlook 2025 to 2035
Media Monitoring Tools Market Size and Share Forecast Outlook 2025 to 2035
Industrial Energy Monitoring Market
Network Fault Monitoring Tools Market Size and Share Forecast Outlook 2025 to 2035
Application Metrics and Monitoring Tools Market Analysis By Component, Mode, Deployment, Verticals, and Region through 2035
Energy-saving Constant Humidity Storage Cabinet Market Size and Share Forecast Outlook 2025 to 2035
Energy Efficient Window and Door Market Size and Share Forecast Outlook 2025 to 2035
Advanced Process Control Market Size and Share Forecast Outlook 2025 to 2035
Monitoring Tool Market Size and Share Forecast Outlook 2025 to 2035
Advanced Active Cleaning System for ADAS Market Forecast and Outlook 2025 to 2035
Energy Efficient Motor Market Size and Share Forecast Outlook 2025 to 2035
Energy Gel Product Market Size and Share Forecast Outlook 2025 to 2035
Advanced Driver Assistance System (ADAS) Testing Equipment Market Size and Share Forecast Outlook 2025 to 2035
Energy Dispersive X-ray Spectrometer Market Size and Share Forecast Outlook 2025 to 2035
Server Management Software Market Size and Share Forecast Outlook 2025 to 2035
Server Microprocessor Market Size and Share Forecast Outlook 2025 to 2035
Server Less Computing Market Size and Share Forecast Outlook 2025 to 2035
Advanced Lead Acid Battery Market Size and Share Forecast Outlook 2025 to 2035
Advanced Gear Shifter System Market Size and Share Forecast Outlook 2025 to 2035
Advanced Therapeutics Pharmaceutical Outsourcing Market Size and Share Forecast Outlook 2025 to 2035

Thank you!
You will receive an email from our Business Development Manager. Please be sure to check your SPAM/JUNK folder too.
Chat With
MaRIA