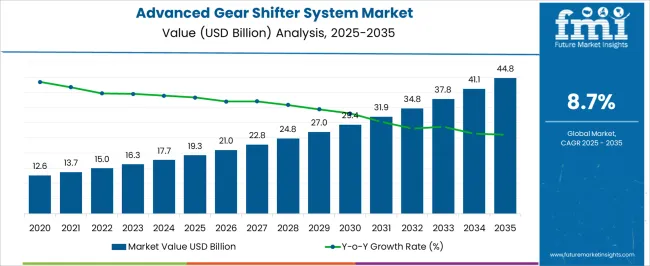
The global advanced gear shifter system market is anticipated to be worth USD 41.2 billion by 2034. The market is projected to register an impressive 8.8% CAGR until 2034. In 2024, the market is estimated to be valued at USD 17.7 billion.
Attributes | Details |
---|---|
Advanced Gear Shifter System Market Size, 2023 | USD 16.0 billion |
Advanced Gear Shifter System Market Size, 2024 | USD 17.7 billion |
Anticipated Market Size, 2034 | USD 41.2 billion |
Value-based CAGR (2024 to 2034) | 8.8% |
Soaring Electric and Hybrid Vehicle Sales Spur Market Demand
The increasing popularity of hybrid and electric cars has spurred demand for intelligent gear shift systems designed specifically for these vehicles. Product portfolios are carefully aligned by automakers with the changing propulsion landscape, making gear shifters suited for electric powertrains necessary.
This change is a calculated move to gain market share in the rapidly growing electric automobile sector, where modern gear shifter designs are essential to maximize efficiency and customer satisfaction, helping businesses gain a competitive edge in the auto industry.
Introduction of Dynamic Shifting Profiles Enhances Market Appeal and Versatility
Dynamic shifting profiles are a thoughtful solution to modern gear shift systems' wide range of driving preferences. Automakers are creating shifting profiles that adjust to various driving conditions, such as eco-friendly modes for fuel-efficient commuting and performance-oriented shifts for aggressive driving.
This tactical approach enhances the vehicles' market appeal and adaptability by catering to a wide range of consumer preferences. Brand loyalty and competitive distinction in the congested automotive sector are fostered by firms positioning themselves as cognizant of consumer demands through customizable driving experiences.
Businesses Aim to Gain a Competitive Edge Using Integration with ADAS
In line with the industry's strategic objective of augmenting vehicle safety and automation, electronic automotive shifter systems are being incorporated with advanced driver assistance systems (ADAS). In order to enable features like automated parking and cooperation with adaptive cruise control, automakers are deliberately integrating intelligent gear shift systems into larger ADAS frameworks.
In addition to improving overall vehicle safety, this smart move gives businesses a competitive edge in a market where improvements in automation and safety are rapidly defining the industry. Companies are also positioned as leaders in the integration of smart technology.
Trends |
|
---|---|
Opportunities |
|
Challenges |
|
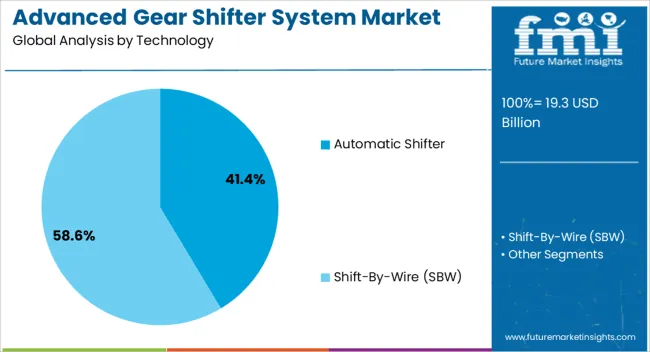
Top Technology | Automatic Shifter |
---|---|
CAGR (2024 to 2034) | 8.6% |
Based on technology, the automatic shifter segment is projected to lead the market, growing at an 8.6% CAGR through 2034. This is attributable to the following reasons:
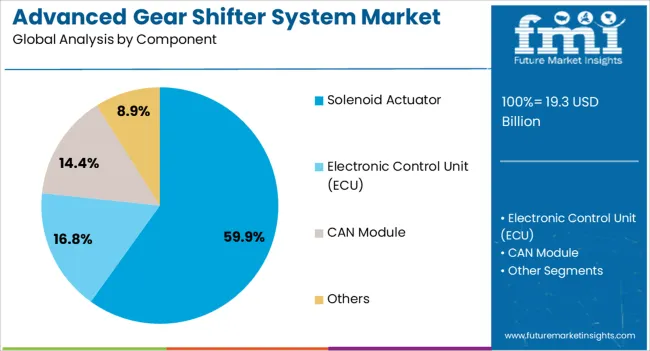
Top Component | Solenoid Actuator |
---|---|
CAGR (2024 to 2034) | 8.4% |
Based on the component, the solenoid actuator segment is predicted to thrive at an 8.4% CAGR through 2034. The key factors driving the segment’s growth are:
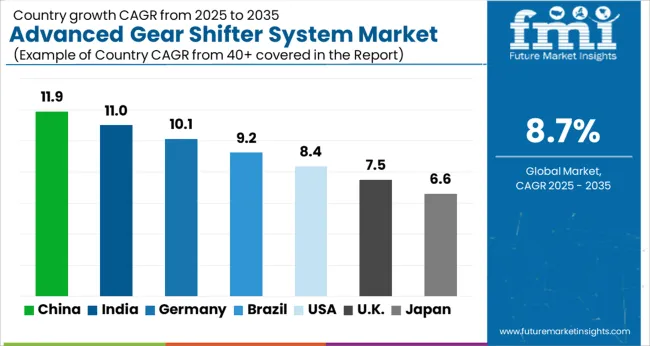
Countries | CAGR (2024 to 2034) |
---|---|
United States | 9.1% |
United Kingdom | 10.0% |
China | 9.6% |
Japan | 10.3% |
South Korea | 11.1% |
The demand for advanced gear shifter systems in the United States is predicted to rise at a 9.1% CAGR through 2034. The key drivers are:
Sales of advanced gear shifter systems in the United Kingdom are projected to increase at a 9.1% CAGR through 2034. The key factors are:
The advanced gear shifter system market growth in China is estimated at a 9.6% CAGR through 2034. The key drivers are:
The demand for advanced gear shifter systems in Japan is anticipated to surge at a 10.3% CAGR through 2034. The key drivers are:
The advanced gear shifter systems market in South Korea is projected to thrive at an 11.1% CAGR through 2034. The key factors propelling the market growth are:
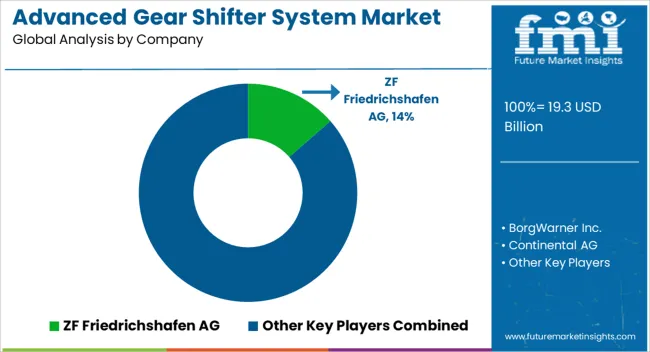
The competitive environment of the advanced gear shifter system market is defined by constant competition among traditional automotive suppliers, new tech-focused startups, and their strategic partners. With a wide range of cutting-edge gear shifter options, leading companies in the automotive component industry include ZF Friedrichshafen AG, BorgWarner Inc., Continental AG, etc.
These industry titans retain a competitive edge by utilizing their vast R&D skills and worldwide production networks to meet the various demands of automakers in multiple locations.
Recent Developments
Table 1: Global Market Value (US$ Million) Forecast by Region, 2019 to 2034
Table 2: Global Market Volume (Units) Forecast by Region, 2019 to 2034
Table 3: Global Market Value (US$ Million) Forecast by Technology, 2019 to 2034
Table 4: Global Market Volume (Units) Forecast by Technology, 2019 to 2034
Table 5: Global Market Value (US$ Million) Forecast by Component, 2019 to 2034
Table 6: Global Market Volume (Units) Forecast by Component, 2019 to 2034
Table 7: Global Market Value (US$ Million) Forecast by Vehicle Type, 2019 to 2034
Table 8: Global Market Volume (Units) Forecast by Vehicle Type, 2019 to 2034
Table 9: North America Market Value (US$ Million) Forecast by Country, 2019 to 2034
Table 10: North America Market Volume (Units) Forecast by Country, 2019 to 2034
Table 11: North America Market Value (US$ Million) Forecast by Technology, 2019 to 2034
Table 12: North America Market Volume (Units) Forecast by Technology, 2019 to 2034
Table 13: North America Market Value (US$ Million) Forecast by Component, 2019 to 2034
Table 14: North America Market Volume (Units) Forecast by Component, 2019 to 2034
Table 15: North America Market Value (US$ Million) Forecast by Vehicle Type, 2019 to 2034
Table 16: North America Market Volume (Units) Forecast by Vehicle Type, 2019 to 2034
Table 17: Latin America Market Value (US$ Million) Forecast by Country, 2019 to 2034
Table 18: Latin America Market Volume (Units) Forecast by Country, 2019 to 2034
Table 19: Latin America Market Value (US$ Million) Forecast by Technology, 2019 to 2034
Table 20: Latin America Market Volume (Units) Forecast by Technology, 2019 to 2034
Table 21: Latin America Market Value (US$ Million) Forecast by Component, 2019 to 2034
Table 22: Latin America Market Volume (Units) Forecast by Component, 2019 to 2034
Table 23: Latin America Market Value (US$ Million) Forecast by Vehicle Type, 2019 to 2034
Table 24: Latin America Market Volume (Units) Forecast by Vehicle Type, 2019 to 2034
Table 25: Europe Market Value (US$ Million) Forecast by Country, 2019 to 2034
Table 26: Europe Market Volume (Units) Forecast by Country, 2019 to 2034
Table 27: Europe Market Value (US$ Million) Forecast by Technology, 2019 to 2034
Table 28: Europe Market Volume (Units) Forecast by Technology, 2019 to 2034
Table 29: Europe Market Value (US$ Million) Forecast by Component, 2019 to 2034
Table 30: Europe Market Volume (Units) Forecast by Component, 2019 to 2034
Table 31: Europe Market Value (US$ Million) Forecast by Vehicle Type, 2019 to 2034
Table 32: Europe Market Volume (Units) Forecast by Vehicle Type, 2019 to 2034
Table 33: East Asia Market Value (US$ Million) Forecast by Country, 2019 to 2034
Table 34: East Asia Market Volume (Units) Forecast by Country, 2019 to 2034
Table 35: East Asia Market Value (US$ Million) Forecast by Technology, 2019 to 2034
Table 36: East Asia Market Volume (Units) Forecast by Technology, 2019 to 2034
Table 37: East Asia Market Value (US$ Million) Forecast by Component, 2019 to 2034
Table 38: East Asia Market Volume (Units) Forecast by Component, 2019 to 2034
Table 39: East Asia Market Value (US$ Million) Forecast by Vehicle Type, 2019 to 2034
Table 40: East Asia Market Volume (Units) Forecast by Vehicle Type, 2019 to 2034
Table 41: South Asia Market Value (US$ Million) Forecast by Country, 2019 to 2034
Table 42: South Asia Market Volume (Units) Forecast by Country, 2019 to 2034
Table 43: South Asia Market Value (US$ Million) Forecast by Technology, 2019 to 2034
Table 44: South Asia Market Volume (Units) Forecast by Technology, 2019 to 2034
Table 45: South Asia Market Value (US$ Million) Forecast by Component, 2019 to 2034
Table 46: South Asia Market Volume (Units) Forecast by Component, 2019 to 2034
Table 47: South Asia Market Value (US$ Million) Forecast by Vehicle Type, 2019 to 2034
Table 48: South Asia Market Volume (Units) Forecast by Vehicle Type, 2019 to 2034
Table 49: Oceania Market Value (US$ Million) Forecast by Country, 2019 to 2034
Table 50: Oceania Market Volume (Units) Forecast by Country, 2019 to 2034
Table 51: Oceania Market Value (US$ Million) Forecast by Technology, 2019 to 2034
Table 52: Oceania Market Volume (Units) Forecast by Technology, 2019 to 2034
Table 53: Oceania Market Value (US$ Million) Forecast by Component, 2019 to 2034
Table 54: Oceania Market Volume (Units) Forecast by Component, 2019 to 2034
Table 55: Oceania Market Value (US$ Million) Forecast by Vehicle Type, 2019 to 2034
Table 56: Oceania Market Volume (Units) Forecast by Vehicle Type, 2019 to 2034
Table 57: MEA Market Value (US$ Million) Forecast by Country, 2019 to 2034
Table 58: MEA Market Volume (Units) Forecast by Country, 2019 to 2034
Table 59: MEA Market Value (US$ Million) Forecast by Technology, 2019 to 2034
Table 60: MEA Market Volume (Units) Forecast by Technology, 2019 to 2034
Table 61: MEA Market Value (US$ Million) Forecast by Component, 2019 to 2034
Table 62: MEA Market Volume (Units) Forecast by Component, 2019 to 2034
Table 63: MEA Market Value (US$ Million) Forecast by Vehicle Type, 2019 to 2034
Table 64: MEA Market Volume (Units) Forecast by Vehicle Type, 2019 to 2034
Figure 1: Global Market Value (US$ Million) by Technology, 2024 to 2034
Figure 2: Global Market Value (US$ Million) by Component, 2024 to 2034
Figure 3: Global Market Value (US$ Million) by Vehicle Type, 2024 to 2034
Figure 4: Global Market Value (US$ Million) by Region, 2024 to 2034
Figure 5: Global Market Value (US$ Million) Analysis by Region, 2019 to 2034
Figure 6: Global Market Volume (Units) Analysis by Region, 2019 to 2034
Figure 7: Global Market Value Share (%) and BPS Analysis by Region, 2024 to 2034
Figure 8: Global Market Y-o-Y Growth (%) Projections by Region, 2024 to 2034
Figure 9: Global Market Value (US$ Million) Analysis by Technology, 2019 to 2034
Figure 10: Global Market Volume (Units) Analysis by Technology, 2019 to 2034
Figure 11: Global Market Value Share (%) and BPS Analysis by Technology, 2024 to 2034
Figure 12: Global Market Y-o-Y Growth (%) Projections by Technology, 2024 to 2034
Figure 13: Global Market Value (US$ Million) Analysis by Component, 2019 to 2034
Figure 14: Global Market Volume (Units) Analysis by Component, 2019 to 2034
Figure 15: Global Market Value Share (%) and BPS Analysis by Component, 2024 to 2034
Figure 16: Global Market Y-o-Y Growth (%) Projections by Component, 2024 to 2034
Figure 17: Global Market Value (US$ Million) Analysis by Vehicle Type, 2019 to 2034
Figure 18: Global Market Volume (Units) Analysis by Vehicle Type, 2019 to 2034
Figure 19: Global Market Value Share (%) and BPS Analysis by Vehicle Type, 2024 to 2034
Figure 20: Global Market Y-o-Y Growth (%) Projections by Vehicle Type, 2024 to 2034
Figure 21: Global Market Attractiveness by Technology, 2024 to 2034
Figure 22: Global Market Attractiveness by Component, 2024 to 2034
Figure 23: Global Market Attractiveness by Vehicle Type, 2024 to 2034
Figure 24: Global Market Attractiveness by Region, 2024 to 2034
Figure 25: North America Market Value (US$ Million) by Technology, 2024 to 2034
Figure 26: North America Market Value (US$ Million) by Component, 2024 to 2034
Figure 27: North America Market Value (US$ Million) by Vehicle Type, 2024 to 2034
Figure 28: North America Market Value (US$ Million) by Country, 2024 to 2034
Figure 29: North America Market Value (US$ Million) Analysis by Country, 2019 to 2034
Figure 30: North America Market Volume (Units) Analysis by Country, 2019 to 2034
Figure 31: North America Market Value Share (%) and BPS Analysis by Country, 2024 to 2034
Figure 32: North America Market Y-o-Y Growth (%) Projections by Country, 2024 to 2034
Figure 33: North America Market Value (US$ Million) Analysis by Technology, 2019 to 2034
Figure 34: North America Market Volume (Units) Analysis by Technology, 2019 to 2034
Figure 35: North America Market Value Share (%) and BPS Analysis by Technology, 2024 to 2034
Figure 36: North America Market Y-o-Y Growth (%) Projections by Technology, 2024 to 2034
Figure 37: North America Market Value (US$ Million) Analysis by Component, 2019 to 2034
Figure 38: North America Market Volume (Units) Analysis by Component, 2019 to 2034
Figure 39: North America Market Value Share (%) and BPS Analysis by Component, 2024 to 2034
Figure 40: North America Market Y-o-Y Growth (%) Projections by Component, 2024 to 2034
Figure 41: North America Market Value (US$ Million) Analysis by Vehicle Type, 2019 to 2034
Figure 42: North America Market Volume (Units) Analysis by Vehicle Type, 2019 to 2034
Figure 43: North America Market Value Share (%) and BPS Analysis by Vehicle Type, 2024 to 2034
Figure 44: North America Market Y-o-Y Growth (%) Projections by Vehicle Type, 2024 to 2034
Figure 45: North America Market Attractiveness by Technology, 2024 to 2034
Figure 46: North America Market Attractiveness by Component, 2024 to 2034
Figure 47: North America Market Attractiveness by Vehicle Type, 2024 to 2034
Figure 48: North America Market Attractiveness by Country, 2024 to 2034
Figure 49: Latin America Market Value (US$ Million) by Technology, 2024 to 2034
Figure 50: Latin America Market Value (US$ Million) by Component, 2024 to 2034
Figure 51: Latin America Market Value (US$ Million) by Vehicle Type, 2024 to 2034
Figure 52: Latin America Market Value (US$ Million) by Country, 2024 to 2034
Figure 53: Latin America Market Value (US$ Million) Analysis by Country, 2019 to 2034
Figure 54: Latin America Market Volume (Units) Analysis by Country, 2019 to 2034
Figure 55: Latin America Market Value Share (%) and BPS Analysis by Country, 2024 to 2034
Figure 56: Latin America Market Y-o-Y Growth (%) Projections by Country, 2024 to 2034
Figure 57: Latin America Market Value (US$ Million) Analysis by Technology, 2019 to 2034
Figure 58: Latin America Market Volume (Units) Analysis by Technology, 2019 to 2034
Figure 59: Latin America Market Value Share (%) and BPS Analysis by Technology, 2024 to 2034
Figure 60: Latin America Market Y-o-Y Growth (%) Projections by Technology, 2024 to 2034
Figure 61: Latin America Market Value (US$ Million) Analysis by Component, 2019 to 2034
Figure 62: Latin America Market Volume (Units) Analysis by Component, 2019 to 2034
Figure 63: Latin America Market Value Share (%) and BPS Analysis by Component, 2024 to 2034
Figure 64: Latin America Market Y-o-Y Growth (%) Projections by Component, 2024 to 2034
Figure 65: Latin America Market Value (US$ Million) Analysis by Vehicle Type, 2019 to 2034
Figure 66: Latin America Market Volume (Units) Analysis by Vehicle Type, 2019 to 2034
Figure 67: Latin America Market Value Share (%) and BPS Analysis by Vehicle Type, 2024 to 2034
Figure 68: Latin America Market Y-o-Y Growth (%) Projections by Vehicle Type, 2024 to 2034
Figure 69: Latin America Market Attractiveness by Technology, 2024 to 2034
Figure 70: Latin America Market Attractiveness by Component, 2024 to 2034
Figure 71: Latin America Market Attractiveness by Vehicle Type, 2024 to 2034
Figure 72: Latin America Market Attractiveness by Country, 2024 to 2034
Figure 73: Europe Market Value (US$ Million) by Technology, 2024 to 2034
Figure 74: Europe Market Value (US$ Million) by Component, 2024 to 2034
Figure 75: Europe Market Value (US$ Million) by Vehicle Type, 2024 to 2034
Figure 76: Europe Market Value (US$ Million) by Country, 2024 to 2034
Figure 77: Europe Market Value (US$ Million) Analysis by Country, 2019 to 2034
Figure 78: Europe Market Volume (Units) Analysis by Country, 2019 to 2034
Figure 79: Europe Market Value Share (%) and BPS Analysis by Country, 2024 to 2034
Figure 80: Europe Market Y-o-Y Growth (%) Projections by Country, 2024 to 2034
Figure 81: Europe Market Value (US$ Million) Analysis by Technology, 2019 to 2034
Figure 82: Europe Market Volume (Units) Analysis by Technology, 2019 to 2034
Figure 83: Europe Market Value Share (%) and BPS Analysis by Technology, 2024 to 2034
Figure 84: Europe Market Y-o-Y Growth (%) Projections by Technology, 2024 to 2034
Figure 85: Europe Market Value (US$ Million) Analysis by Component, 2019 to 2034
Figure 86: Europe Market Volume (Units) Analysis by Component, 2019 to 2034
Figure 87: Europe Market Value Share (%) and BPS Analysis by Component, 2024 to 2034
Figure 88: Europe Market Y-o-Y Growth (%) Projections by Component, 2024 to 2034
Figure 89: Europe Market Value (US$ Million) Analysis by Vehicle Type, 2019 to 2034
Figure 90: Europe Market Volume (Units) Analysis by Vehicle Type, 2019 to 2034
Figure 91: Europe Market Value Share (%) and BPS Analysis by Vehicle Type, 2024 to 2034
Figure 92: Europe Market Y-o-Y Growth (%) Projections by Vehicle Type, 2024 to 2034
Figure 93: Europe Market Attractiveness by Technology, 2024 to 2034
Figure 94: Europe Market Attractiveness by Component, 2024 to 2034
Figure 95: Europe Market Attractiveness by Vehicle Type, 2024 to 2034
Figure 96: Europe Market Attractiveness by Country, 2024 to 2034
Figure 97: East Asia Market Value (US$ Million) by Technology, 2024 to 2034
Figure 98: East Asia Market Value (US$ Million) by Component, 2024 to 2034
Figure 99: East Asia Market Value (US$ Million) by Vehicle Type, 2024 to 2034
Figure 100: East Asia Market Value (US$ Million) by Country, 2024 to 2034
Figure 101: East Asia Market Value (US$ Million) Analysis by Country, 2019 to 2034
Figure 102: East Asia Market Volume (Units) Analysis by Country, 2019 to 2034
Figure 103: East Asia Market Value Share (%) and BPS Analysis by Country, 2024 to 2034
Figure 104: East Asia Market Y-o-Y Growth (%) Projections by Country, 2024 to 2034
Figure 105: East Asia Market Value (US$ Million) Analysis by Technology, 2019 to 2034
Figure 106: East Asia Market Volume (Units) Analysis by Technology, 2019 to 2034
Figure 107: East Asia Market Value Share (%) and BPS Analysis by Technology, 2024 to 2034
Figure 108: East Asia Market Y-o-Y Growth (%) Projections by Technology, 2024 to 2034
Figure 109: East Asia Market Value (US$ Million) Analysis by Component, 2019 to 2034
Figure 110: East Asia Market Volume (Units) Analysis by Component, 2019 to 2034
Figure 111: East Asia Market Value Share (%) and BPS Analysis by Component, 2024 to 2034
Figure 112: East Asia Market Y-o-Y Growth (%) Projections by Component, 2024 to 2034
Figure 113: East Asia Market Value (US$ Million) Analysis by Vehicle Type, 2019 to 2034
Figure 114: East Asia Market Volume (Units) Analysis by Vehicle Type, 2019 to 2034
Figure 115: East Asia Market Value Share (%) and BPS Analysis by Vehicle Type, 2024 to 2034
Figure 116: East Asia Market Y-o-Y Growth (%) Projections by Vehicle Type, 2024 to 2034
Figure 117: East Asia Market Attractiveness by Technology, 2024 to 2034
Figure 118: East Asia Market Attractiveness by Component, 2024 to 2034
Figure 119: East Asia Market Attractiveness by Vehicle Type, 2024 to 2034
Figure 120: East Asia Market Attractiveness by Country, 2024 to 2034
Figure 121: South Asia Market Value (US$ Million) by Technology, 2024 to 2034
Figure 122: South Asia Market Value (US$ Million) by Component, 2024 to 2034
Figure 123: South Asia Market Value (US$ Million) by Vehicle Type, 2024 to 2034
Figure 124: South Asia Market Value (US$ Million) by Country, 2024 to 2034
Figure 125: South Asia Market Value (US$ Million) Analysis by Country, 2019 to 2034
Figure 126: South Asia Market Volume (Units) Analysis by Country, 2019 to 2034
Figure 127: South Asia Market Value Share (%) and BPS Analysis by Country, 2024 to 2034
Figure 128: South Asia Market Y-o-Y Growth (%) Projections by Country, 2024 to 2034
Figure 129: South Asia Market Value (US$ Million) Analysis by Technology, 2019 to 2034
Figure 130: South Asia Market Volume (Units) Analysis by Technology, 2019 to 2034
Figure 131: South Asia Market Value Share (%) and BPS Analysis by Technology, 2024 to 2034
Figure 132: South Asia Market Y-o-Y Growth (%) Projections by Technology, 2024 to 2034
Figure 133: South Asia Market Value (US$ Million) Analysis by Component, 2019 to 2034
Figure 134: South Asia Market Volume (Units) Analysis by Component, 2019 to 2034
Figure 135: South Asia Market Value Share (%) and BPS Analysis by Component, 2024 to 2034
Figure 136: South Asia Market Y-o-Y Growth (%) Projections by Component, 2024 to 2034
Figure 137: South Asia Market Value (US$ Million) Analysis by Vehicle Type, 2019 to 2034
Figure 138: South Asia Market Volume (Units) Analysis by Vehicle Type, 2019 to 2034
Figure 139: South Asia Market Value Share (%) and BPS Analysis by Vehicle Type, 2024 to 2034
Figure 140: South Asia Market Y-o-Y Growth (%) Projections by Vehicle Type, 2024 to 2034
Figure 141: South Asia Market Attractiveness by Technology, 2024 to 2034
Figure 142: South Asia Market Attractiveness by Component, 2024 to 2034
Figure 143: South Asia Market Attractiveness by Vehicle Type, 2024 to 2034
Figure 144: South Asia Market Attractiveness by Country, 2024 to 2034
Figure 145: Oceania Market Value (US$ Million) by Technology, 2024 to 2034
Figure 146: Oceania Market Value (US$ Million) by Component, 2024 to 2034
Figure 147: Oceania Market Value (US$ Million) by Vehicle Type, 2024 to 2034
Figure 148: Oceania Market Value (US$ Million) by Country, 2024 to 2034
Figure 149: Oceania Market Value (US$ Million) Analysis by Country, 2019 to 2034
Figure 150: Oceania Market Volume (Units) Analysis by Country, 2019 to 2034
Figure 151: Oceania Market Value Share (%) and BPS Analysis by Country, 2024 to 2034
Figure 152: Oceania Market Y-o-Y Growth (%) Projections by Country, 2024 to 2034
Figure 153: Oceania Market Value (US$ Million) Analysis by Technology, 2019 to 2034
Figure 154: Oceania Market Volume (Units) Analysis by Technology, 2019 to 2034
Figure 155: Oceania Market Value Share (%) and BPS Analysis by Technology, 2024 to 2034
Figure 156: Oceania Market Y-o-Y Growth (%) Projections by Technology, 2024 to 2034
Figure 157: Oceania Market Value (US$ Million) Analysis by Component, 2019 to 2034
Figure 158: Oceania Market Volume (Units) Analysis by Component, 2019 to 2034
Figure 159: Oceania Market Value Share (%) and BPS Analysis by Component, 2024 to 2034
Figure 160: Oceania Market Y-o-Y Growth (%) Projections by Component, 2024 to 2034
Figure 161: Oceania Market Value (US$ Million) Analysis by Vehicle Type, 2019 to 2034
Figure 162: Oceania Market Volume (Units) Analysis by Vehicle Type, 2019 to 2034
Figure 163: Oceania Market Value Share (%) and BPS Analysis by Vehicle Type, 2024 to 2034
Figure 164: Oceania Market Y-o-Y Growth (%) Projections by Vehicle Type, 2024 to 2034
Figure 165: Oceania Market Attractiveness by Technology, 2024 to 2034
Figure 166: Oceania Market Attractiveness by Component, 2024 to 2034
Figure 167: Oceania Market Attractiveness by Vehicle Type, 2024 to 2034
Figure 168: Oceania Market Attractiveness by Country, 2024 to 2034
Figure 169: MEA Market Value (US$ Million) by Technology, 2024 to 2034
Figure 170: MEA Market Value (US$ Million) by Component, 2024 to 2034
Figure 171: MEA Market Value (US$ Million) by Vehicle Type, 2024 to 2034
Figure 172: MEA Market Value (US$ Million) by Country, 2024 to 2034
Figure 173: MEA Market Value (US$ Million) Analysis by Country, 2019 to 2034
Figure 174: MEA Market Volume (Units) Analysis by Country, 2019 to 2034
Figure 175: MEA Market Value Share (%) and BPS Analysis by Country, 2024 to 2034
Figure 176: MEA Market Y-o-Y Growth (%) Projections by Country, 2024 to 2034
Figure 177: MEA Market Value (US$ Million) Analysis by Technology, 2019 to 2034
Figure 178: MEA Market Volume (Units) Analysis by Technology, 2019 to 2034
Figure 179: MEA Market Value Share (%) and BPS Analysis by Technology, 2024 to 2034
Figure 180: MEA Market Y-o-Y Growth (%) Projections by Technology, 2024 to 2034
Figure 181: MEA Market Value (US$ Million) Analysis by Component, 2019 to 2034
Figure 182: MEA Market Volume (Units) Analysis by Component, 2019 to 2034
Figure 183: MEA Market Value Share (%) and BPS Analysis by Component, 2024 to 2034
Figure 184: MEA Market Y-o-Y Growth (%) Projections by Component, 2024 to 2034
Figure 185: MEA Market Value (US$ Million) Analysis by Vehicle Type, 2019 to 2034
Figure 186: MEA Market Volume (Units) Analysis by Vehicle Type, 2019 to 2034
Figure 187: MEA Market Value Share (%) and BPS Analysis by Vehicle Type, 2024 to 2034
Figure 188: MEA Market Y-o-Y Growth (%) Projections by Vehicle Type, 2024 to 2034
Figure 189: MEA Market Attractiveness by Technology, 2024 to 2034
Figure 190: MEA Market Attractiveness by Component, 2024 to 2034
Figure 191: MEA Market Attractiveness by Vehicle Type, 2024 to 2034
Figure 192: MEA Market Attractiveness by Country, 2024 to 2034
The global advanced gear shifter system market is valued at USD 17.7 billion in 2024.
The advanced gear shifter system market size is estimated to increase at an 8.8% CAGR through 2034.
The advanced gear shifter system market is anticipated to be worth USD 41.2 billion by 2034.
The demand for solenoid actuators is rising in the industry.
The market in South Korea is predicted to rise at an 11.1% CAGR through 2034.
Explore Similar Insights
Thank you!
You will receive an email from our Business Development Manager. Please be sure to check your SPAM/JUNK folder too.