Advanced Lead Acid Battery Market Size and Share Forecast Outlook (2024 to 2034)

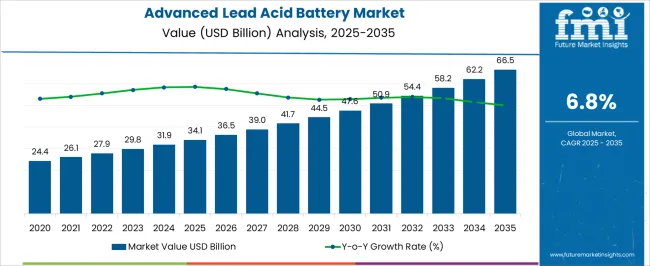
The advanced lead acid battery market is estimated to be valued at USD 31.9 billion in 2024. The demand for advanced lead acid batteries is predicted to rise at a CAGR of 6.9% from 2024 to 2034. The global advanced lead acid battery market is anticipated to reach USD 62.0 billion by 2034.

Advanced lead-acid batteries find applications in various sectors, including automotive, industrial, and renewable energy. They are being considered for energy storage in renewable energy systems and grid applications.

Lead-acid batteries have been widely used for decades, particularly in automotive applications. Advanced lead-acid batteries represent an improved and more sophisticated version of traditional lead-acid batteries.

Advanced Lead Acid Battery Market Trend Analysis

  • The increasing emphasis within the automotive sector on electric and hybrid vehicles has generated a heightened demand for advanced lead-acid batteries
  • The telecommunications sector continues to be a key user of advanced lead-acid batteries for backup power in cell towers and communication infrastructure.
Attributes Key Insights
Advanced Lead Acid Battery Market Estimated Size in 2024 USD 31.9 billion
Projected Market Value in 2034 USD 62.0 billion
Value-based CAGR from 2024 to 2034 6.9%

Sales Analysis of Advanced Lead Acid Battery (2019 to 2023) vs Forecast (2024 to 2034)

Fueled by heightened emphasis on research and development and substantial investments in the automotive sector, particularly in the domain of electric vehicles, the advanced lead-acid battery market is projected to experience a CAGR of 6.9% from 2024 to 2034. The 8.6% CAGR recorded during the period from 2019 to 2023.

The rise in global demand for energy-efficient solutions has been a driving force behind the growth of the advanced lead-acid battery market. The consistent increase in the adoption of advanced lead-acid batteries aligns with the emergence of electric and hybrid vehicles in recent years.

Market Value in 2023 USD 29.6 billion
Market Value in 2034 USD 62.0 billion

Key Drivers Fueling Growth in the Advanced Lead Acid Battery Industry

  • Advanced lead-acid batteries are versatile and find applications in various sectors, including automotive, telecommunications, renewable energy storage, and industrial power backup.
  • The increasing demand for energy storage solutions, driven by the growth of renewable energy sources and the need for grid stability, has provided opportunities for advanced lead-acid batteries.
  • Growing industrialization and infrastructure development in emerging economies have led to increased demand for these batteries.

Key Challenges Impacting the Advanced Lead Acid Battery Market

  • The increasing competition from other energy storage technologies, particularly lithium-ion batteries. Lithium-ion batteries often offer higher energy density and longer cycle life, making them more suitable for certain applications.
  • Stricter environmental regulations could pose challenges for the widespread adoption of lead-acid batteries in some regions.
  • Some stakeholders may have safety concerns associated with lead-acid batteries, particularly in comparison to newer battery technologies.

Analysis of Top Countries Manufacturing, Certifying, and Using Advanced Lead Acid Batteries

The following table shows the top five countries by revenue, led by South Korea and Japan. The ongoing advancements in lead-acid battery technology, leading to improved performance, energy density, and cycle life, could contribute to the growth of the market in South Korea.

Government policies and support for renewable energy, energy storage, and environmental sustainability can significantly influence the growth of the advanced lead-acid battery market. These two countries are predicted to boost their market sales through 2034.

Countries Forecast CAGRs from 2024 to 2034
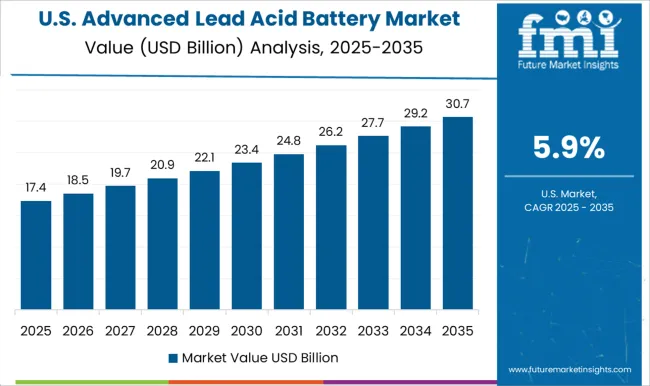
United States 7.1%
United Kingdom 8.0%
China 7.9%
Japan 8.5%
South Korea 9.0%

The Growing Automotive Application to Drive Market Growth in the United States

The advanced lead acid battery market in the United States is expected to grow with a CAGR of 7.1% from 2024 to 2034. The growth of the automotive sector and the increasing adoption of electric and hybrid vehicles in the United States could contribute to the demand for advanced lead-acid batteries.

The United States has been actively working towards increasing the share of renewable energy in its energy mix. Advanced lead-acid batteries may find applications in energy storage systems connected to renewable energy sources, helping to stabilize the grid and store excess energy.

The advanced lead-acid battery market in the United States may be influenced by competition with other energy storage technologies, such as lithium-ion batteries. Innovations and advancements that improve the competitiveness of advanced lead-acid batteries may influence market dynamics.

Increasing Demand in Telecommunication to Boost the Market Demand in China

China has been a significant player in the electric vehicle (EV) market, and advanced lead-acid batteries have found applications in start-stop systems and mild-hybrid vehicles. The growth of the automotive sector, including electric and hybrid vehicles, could contribute to increased demand for advanced lead-acid batteries.

Lead-acid batteries, including advanced variants, are widely used in the telecommunications sector for backup power in cell towers and other communication infrastructure. The ongoing expansion and development of power infrastructure in China may drive demand for reliable energy storage solutions

China's focus on renewable energy and the integration of solar and wind power into the grid could drive the demand for energy storage solutions. Advanced lead-acid batteries may find applications in energy storage systems that support renewable energy sources. Over the assessment period, the demand for advanced lead acid batteries in China is projected to surge at a 7.9% CAGR.

Growing Industrial and Commercial Applications Drive the Market Demand in the United Kingdom

The advanced lead acid battery market in the United Kingdom is expected to expand at a CAGR of 8.0% by 2024. The market growth in the country is attributed to the United Kingdom's commitment to reducing carbon emissions and promoting sustainable transportation.

Increased use of advanced lead-acid batteries in industrial and commercial applications, such as backup power systems, forklifts, and telecommunications, can contribute to market growth in the United Kingdom.
Japan is Fuelling Industry Growth with a Significant CAGR

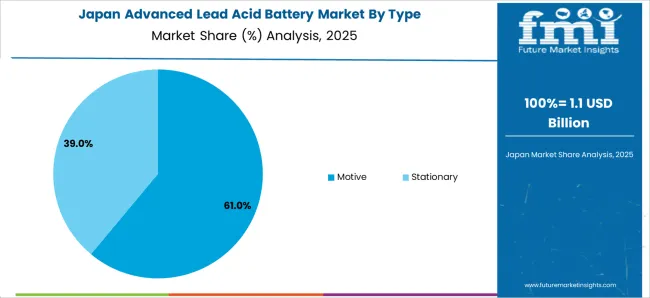
The demand for advanced lead acid batteries is expected to rise in Japan. By 2034, the market is expected to expand at a CAGR of 8.5%. Japan has been a major player in the automotive industry, and advanced lead-acid batteries find applications in vehicles, particularly in start-stop systems and mild-hybrid vehicles.

The growth of the automotive sector, including electric and hybrid vehicles, could drive the demand for advanced lead-acid batteries. Lead-acid batteries, including advanced types, are widely used for backup power in the telecommunications sector.

With the continuous expansion and development of telecommunications infrastructure, there may be a growing demand for advanced lead-acid batteries in the country.
Increasing Renewable Energy Integration in South Korea Drive Market Growth

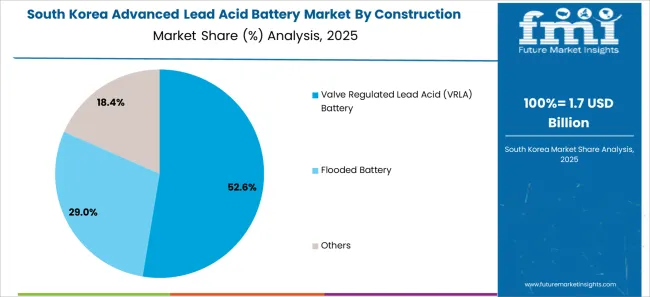
The advanced lead acid battery market in South Korea is expected to expand at a CAGR of 9.0% by 2024. The market growth in the country is influenced by the presence of a strong automotive industry. The growth of electric and hybrid vehicles in the country could drive the demand for advanced lead-acid batteries, especially in applications like start-stop systems and mild-hybrid vehicles.

South Korea has been making efforts to increase the share of renewable energy in its energy mix. Advanced lead-acid batteries may find applications in energy storage systems connected to renewable sources, contributing to the growth of the market.

Ongoing advancements in lead-acid battery technology, leading to improved performance, energy density, and cycle life, could contribute to the growth of the market in South Korea.

Advanced Lead Acid Battery Industry Analysis by Top Investment Segments

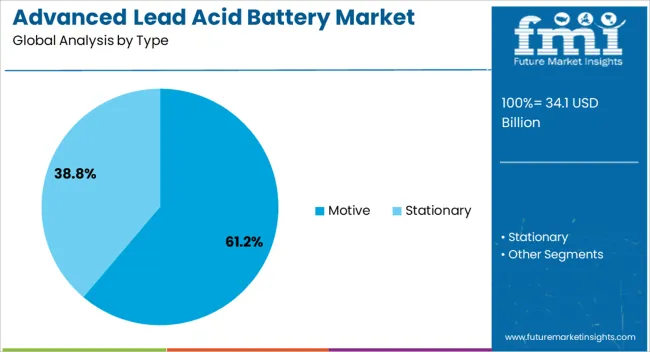
The below section shows the leading segment leading type and construction method. The motive segment is forecast to have a 6.7% CAGR between 2024 and 2034.

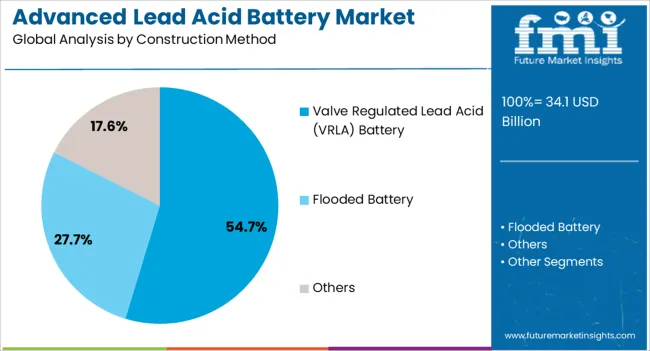
Based on the construction method, the Valve Regulated Lead Acid (VRLA) Battery segment is anticipated to hold a dominant share through 2034. It is set to exhibit a CAGR of 6.5% during the forecast period.

Category Market share
Motive 6.7%
Valve Regulated Lead Acid (VRLA) Battery 6.5%

Vvalve regulated lead acid (VRLA) battery to lead the advanced lead acid market. Valve Regulated Lead Acid (VRLA) batteries will dominate the advanced lead acid battery market, and this dominance is expected to continue throughout the forecast period, with a CAGR of 6.5%.

Valve Regulated Lead Acid (VRLA) batteries are known for their maintenance-free operation, which makes them attractive for a wide range of applications. They do not require regular watering, and users do not need to check the electrolyte levels or add water periodically. The sealed design of VRLA batteries eliminates the need for ventilation and minimizes the risk of acid leakage. This feature enhances safety, making them suitable for applications where safety and environmental concerns are critical.

VRLA batteries are generally more cost-effective than some other types of batteries, such as lithium-ion batteries. This cost advantage makes them a preferred choice, particularly in applications where cost is a significant consideration.

VRLA batteries offer reliable performance and have a relatively long service life. This makes them suitable for applications where a dependable power source is crucial, such as backup power systems and emergency lighting.

Adoption of Motive Type Batteries Will Remain High

Based on type, the motive segment is expected to account for a CAGR of 6.7% from 2024 to 2034. Advanced lead-acid batteries have a well-established track record in motive applications, providing predictable performance and minimal maintenance requirements.

Lead-acid batteries boast an impressive recycling rate, making them a more environmentally friendly choice compared to some alternatives. Advanced lead-acid batteries offer several attractive features for motive applications like electric vehicles, forklifts, and other industrial equipment.

Advanced lead-acid batteries represent a mature and reliable technology for motive applications, offering a balance of cost-effectiveness, durability, and safety
Competitive Landscape of the Advanced Lead Acid Battery Market

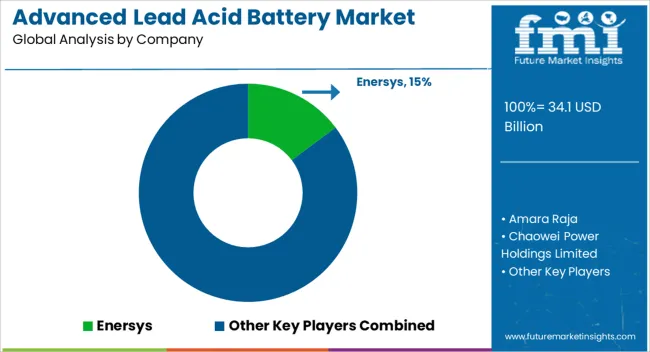
Leading advanced lead acid battery companies are investing heavily in the research and development of novel battery technologies and acquiring new patents to gain a competitive edge over other market players.

Key players operating in the advanced lead acid battery market include Amara Raja, Chaowei Power Holdings Limited, Coslight Technology International Group Co., Ltd, Crown Battery, East Penn Manufacturing, Enersys, Exide Industries Ltd, Hitachi Chemical Energy Technology, GS Yuasa International Ltd, Furukawa Battery Co., Ltd,

  • In December 2022, Amara Raja Batteries Limited (ARBL), a prominent player in India's industrial and automotive battery sector (listed on BSE as 500008 and NSE as AMARAJABAT), formalized a memorandum of understanding (MoU) with the Government of Telangana. The agreement outlines plans for the establishment of cutting-edge research and manufacturing facilities dedicated to the production of lithium-ion batteries in Mahbubnagar district, Telangana.
  • East Penn Manufacturing has recently introduced a notable addition to its 12-volt AGM battery lineup. The introduction of a distinct brand, EHP® (Electric Hybrid Performance), aims to provide consumers with a clear and informed choice in the evolving landscape of vehicle electrification. This new distinction is specifically tailored to signify the optimal suitability of these AGM batteries for electric, hybrid, and start-stop 12-volt systems, thereby helping consumers navigate the complexities of modern vehicle technologies.

Scope and Coverage of the Advanced Lead Acid Battery Market Report

Attributes Details
Estimated Market Size in 2024 USD 31.9 billion
Projected Market Valuation in 2034 USD 62.0 billion
Value-based CAGR 2024 to 2034 6.9%
Forecast Period 2024 to 2034
Historical Data Available for 2019 to 2023
Market Analysis Value in USD billion
Key Regions Covered North America; Latin America; Western Europe; Eastern Europe; South Asia and Pacific; East Asia; Middle East and Africa
Key Market Segments Covered Type, Construction Method, End-use Industry, Region
Key Countries Profiled The United States, Canada, Brazil, Mexico, Germany, The United Kingdom, France, Spain, Italy, Russia, Poland, Czech Republic, Romania, India, Bangladesh, Australia, New Zealand, China, Japan, South Korea, GCC countries, South Africa, Israel
Key Companies Profiled Amara Raja; Chaowei Power Holdings Limited; Coslight Technology International Group Co. Ltd; Crown Battery; East Penn Manufacturing; Enersys; Exide Industries Ltd; Hitachi Chemical Energy Technology; GS Yuasa International Ltd; Furukawa Battery Co. Ltd

Top Segments Studied in the Advanced Lead Acid Battery Market

By Type:

  • Motive
  • Stationary

By Construction Method:

  • Valve Regulated Lead Acid (VRLA) Battery
  • Flooded Battery
  • Others

By End-Use Industry:

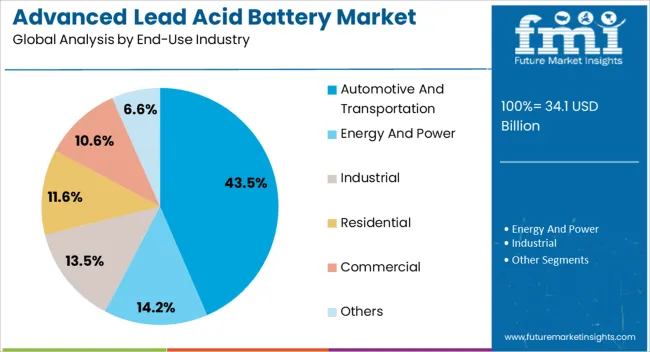
  • Automotive and Transportation
  • Energy and Power
  • Industrial
  • Residential
  • Commercial
  • Others

By Region:

  • North America
  • Latin America
  • Western Europe
  • Eastern Europe
  • South Asia and Pacific
  • East Asia
  • Middle East and Africa

Table of Content

  • 1. Executive Summary
  • 2. Market Overview
  • 3. Market Background
  • 4. Global Market Analysis 2019 to 2023 and Forecast, 2024 to 2034
  • 5. Global Market Analysis 2019 to 2023 and Forecast 2024 to 2034, By Type
    • 5.1. Motive
    • 5.2. Stationary
  • 6. Global Market Analysis 2019 to 2023 and Forecast 2024 to 2034, By Construction Method
    • 6.1. Valve Regulated Lead Acid (VRLA) Battery
    • 6.2. Flooded Battery
    • 6.3. Others
  • 7. Global Market Analysis 2019 to 2023 and Forecast 2024 to 2034, By End-Use Industry
    • 7.1. Automotive and Transportation
    • 7.2. Energy and Power
    • 7.3. Industrial
    • 7.4. Residential
    • 7.5. Commercial
    • 7.6. Others
  • 8. Global Market Analysis 2019 to 2023 and Forecast 2024 to 2034, By Region
    • 8.1. North America
    • 8.2. Latin America
    • 8.3. Europe
    • 8.4. East Asia
    • 8.5. South Asia
    • 8.6. Oceania
    • 8.7. MEA
  • 9. North America Market Analysis 2019 to 2023 and Forecast 2024 to 2034, By Country
  • 10. Latin America Market Analysis 2019 to 2023 and Forecast 2024 to 2034, By Country
  • 11. Europe Market Analysis 2019 to 2023 and Forecast 2024 to 2034, By Country
  • 12. East Asia Market Analysis 2019 to 2023 and Forecast 2024 to 2034, By Country
  • 13. South Asia Market Analysis 2019 to 2023 and Forecast 2024 to 2034, By Country
  • 14. Oceania Market Analysis 2019 to 2023 and Forecast 2024 to 2034, By Country
  • 15. MEA Market Analysis 2019 to 2023 and Forecast 2024 to 2034, By Country
  • 16. Key Countries Market Analysis
  • 17. Market Structure Analysis
  • 18. Competition Analysis
    • 18.1. Amara Raja
    • 18.2. Chaowei Power Holdings Limited
    • 18.3. Coslight Technology International Group Co., Ltd
    • 18.4. Crown Battery
    • 18.5. East Penn Manufacturing
    • 18.6. Enersys
    • 18.7. Exide Industries Ltd
    • 18.8. Furukawa Battery Co., Ltd
    • 18.9. GS Yuasa International Ltd
    • 18.10. Hitachi Chemical Energy Technology
  • 19. Assumptions & Acronyms Used
  • 20. Research Methodology

List of Tables

Table 1: Global Market Value (US$ Million) Forecast by Region, 2019 to 2034

Table 2: Global Market Volume (Units) Forecast by Region, 2019 to 2034

Table 3: Global Market Value (US$ Million) Forecast by Type, 2019 to 2034

Table 4: Global Market Volume (Units) Forecast by Type, 2019 to 2034

Table 5: Global Market Value (US$ Million) Forecast by Construction Method, 2019 to 2034

Table 6: Global Market Volume (Units) Forecast by Construction Method, 2019 to 2034

Table 7: Global Market Value (US$ Million) Forecast by End-Use Industry, 2019 to 2034

Table 8: Global Market Volume (Units) Forecast by End-Use Industry, 2019 to 2034

Table 9: North America Market Value (US$ Million) Forecast by Country, 2019 to 2034

Table 10: North America Market Volume (Units) Forecast by Country, 2019 to 2034

Table 11: North America Market Value (US$ Million) Forecast by Type, 2019 to 2034

Table 12: North America Market Volume (Units) Forecast by Type, 2019 to 2034

Table 13: North America Market Value (US$ Million) Forecast by Construction Method, 2019 to 2034

Table 14: North America Market Volume (Units) Forecast by Construction Method, 2019 to 2034

Table 15: North America Market Value (US$ Million) Forecast by End-Use Industry, 2019 to 2034

Table 16: North America Market Volume (Units) Forecast by End-Use Industry, 2019 to 2034

Table 17: Latin America Market Value (US$ Million) Forecast by Country, 2019 to 2034

Table 18: Latin America Market Volume (Units) Forecast by Country, 2019 to 2034

Table 19: Latin America Market Value (US$ Million) Forecast by Type, 2019 to 2034

Table 20: Latin America Market Volume (Units) Forecast by Type, 2019 to 2034

Table 21: Latin America Market Value (US$ Million) Forecast by Construction Method, 2019 to 2034

Table 22: Latin America Market Volume (Units) Forecast by Construction Method, 2019 to 2034

Table 23: Latin America Market Value (US$ Million) Forecast by End-Use Industry, 2019 to 2034

Table 24: Latin America Market Volume (Units) Forecast by End-Use Industry, 2019 to 2034

Table 25: Europe Market Value (US$ Million) Forecast by Country, 2019 to 2034

Table 26: Europe Market Volume (Units) Forecast by Country, 2019 to 2034

Table 27: Europe Market Value (US$ Million) Forecast by Type, 2019 to 2034

Table 28: Europe Market Volume (Units) Forecast by Type, 2019 to 2034

Table 29: Europe Market Value (US$ Million) Forecast by Construction Method, 2019 to 2034

Table 30: Europe Market Volume (Units) Forecast by Construction Method, 2019 to 2034

Table 31: Europe Market Value (US$ Million) Forecast by End-Use Industry, 2019 to 2034

Table 32: Europe Market Volume (Units) Forecast by End-Use Industry, 2019 to 2034

Table 33: East Asia Market Value (US$ Million) Forecast by Country, 2019 to 2034

Table 34: East Asia Market Volume (Units) Forecast by Country, 2019 to 2034

Table 35: East Asia Market Value (US$ Million) Forecast by Type, 2019 to 2034

Table 36: East Asia Market Volume (Units) Forecast by Type, 2019 to 2034

Table 37: East Asia Market Value (US$ Million) Forecast by Construction Method, 2019 to 2034

Table 38: East Asia Market Volume (Units) Forecast by Construction Method, 2019 to 2034

Table 39: East Asia Market Value (US$ Million) Forecast by End-Use Industry, 2019 to 2034

Table 40: East Asia Market Volume (Units) Forecast by End-Use Industry, 2019 to 2034

Table 41: South Asia Market Value (US$ Million) Forecast by Country, 2019 to 2034

Table 42: South Asia Market Volume (Units) Forecast by Country, 2019 to 2034

Table 43: South Asia Market Value (US$ Million) Forecast by Type, 2019 to 2034

Table 44: South Asia Market Volume (Units) Forecast by Type, 2019 to 2034

Table 45: South Asia Market Value (US$ Million) Forecast by Construction Method, 2019 to 2034

Table 46: South Asia Market Volume (Units) Forecast by Construction Method, 2019 to 2034

Table 47: South Asia Market Value (US$ Million) Forecast by End-Use Industry, 2019 to 2034

Table 48: South Asia Market Volume (Units) Forecast by End-Use Industry, 2019 to 2034

Table 49: Oceania Market Value (US$ Million) Forecast by Country, 2019 to 2034

Table 50: Oceania Market Volume (Units) Forecast by Country, 2019 to 2034

Table 51: Oceania Market Value (US$ Million) Forecast by Type, 2019 to 2034

Table 52: Oceania Market Volume (Units) Forecast by Type, 2019 to 2034

Table 53: Oceania Market Value (US$ Million) Forecast by Construction Method, 2019 to 2034

Table 54: Oceania Market Volume (Units) Forecast by Construction Method, 2019 to 2034

Table 55: Oceania Market Value (US$ Million) Forecast by End-Use Industry, 2019 to 2034

Table 56: Oceania Market Volume (Units) Forecast by End-Use Industry, 2019 to 2034

Table 57: MEA Market Value (US$ Million) Forecast by Country, 2019 to 2034

Table 58: MEA Market Volume (Units) Forecast by Country, 2019 to 2034

Table 59: MEA Market Value (US$ Million) Forecast by Type, 2019 to 2034

Table 60: MEA Market Volume (Units) Forecast by Type, 2019 to 2034

Table 61: MEA Market Value (US$ Million) Forecast by Construction Method, 2019 to 2034

Table 62: MEA Market Volume (Units) Forecast by Construction Method, 2019 to 2034

Table 63: MEA Market Value (US$ Million) Forecast by End-Use Industry, 2019 to 2034

Table 64: MEA Market Volume (Units) Forecast by End-Use Industry, 2019 to 2034

List of Figures

Figure 1: Global Market Value (US$ Million) by Type, 2024 to 2034

Figure 2: Global Market Value (US$ Million) by Construction Method, 2024 to 2034

Figure 3: Global Market Value (US$ Million) by End-Use Industry, 2024 to 2034

Figure 4: Global Market Value (US$ Million) by Region, 2024 to 2034

Figure 5: Global Market Value (US$ Million) Analysis by Region, 2019 to 2034

Figure 6: Global Market Volume (Units) Analysis by Region, 2019 to 2034

Figure 7: Global Market Value Share (%) and BPS Analysis by Region, 2024 to 2034

Figure 8: Global Market Y-o-Y Growth (%) Projections by Region, 2024 to 2034

Figure 9: Global Market Value (US$ Million) Analysis by Type, 2019 to 2034

Figure 10: Global Market Volume (Units) Analysis by Type, 2019 to 2034

Figure 11: Global Market Value Share (%) and BPS Analysis by Type, 2024 to 2034

Figure 12: Global Market Y-o-Y Growth (%) Projections by Type, 2024 to 2034

Figure 13: Global Market Value (US$ Million) Analysis by Construction Method, 2019 to 2034

Figure 14: Global Market Volume (Units) Analysis by Construction Method, 2019 to 2034

Figure 15: Global Market Value Share (%) and BPS Analysis by Construction Method, 2024 to 2034

Figure 16: Global Market Y-o-Y Growth (%) Projections by Construction Method, 2024 to 2034

Figure 17: Global Market Value (US$ Million) Analysis by End-Use Industry, 2019 to 2034

Figure 18: Global Market Volume (Units) Analysis by End-Use Industry, 2019 to 2034

Figure 19: Global Market Value Share (%) and BPS Analysis by End-Use Industry, 2024 to 2034

Figure 20: Global Market Y-o-Y Growth (%) Projections by End-Use Industry, 2024 to 2034

Figure 21: Global Market Attractiveness by Type, 2024 to 2034

Figure 22: Global Market Attractiveness by Construction Method, 2024 to 2034

Figure 23: Global Market Attractiveness by End-Use Industry, 2024 to 2034

Figure 24: Global Market Attractiveness by Region, 2024 to 2034

Figure 25: North America Market Value (US$ Million) by Type, 2024 to 2034

Figure 26: North America Market Value (US$ Million) by Construction Method, 2024 to 2034

Figure 27: North America Market Value (US$ Million) by End-Use Industry, 2024 to 2034

Figure 28: North America Market Value (US$ Million) by Country, 2024 to 2034

Figure 29: North America Market Value (US$ Million) Analysis by Country, 2019 to 2034

Figure 30: North America Market Volume (Units) Analysis by Country, 2019 to 2034

Figure 31: North America Market Value Share (%) and BPS Analysis by Country, 2024 to 2034

Figure 32: North America Market Y-o-Y Growth (%) Projections by Country, 2024 to 2034

Figure 33: North America Market Value (US$ Million) Analysis by Type, 2019 to 2034

Figure 34: North America Market Volume (Units) Analysis by Type, 2019 to 2034

Figure 35: North America Market Value Share (%) and BPS Analysis by Type, 2024 to 2034

Figure 36: North America Market Y-o-Y Growth (%) Projections by Type, 2024 to 2034

Figure 37: North America Market Value (US$ Million) Analysis by Construction Method, 2019 to 2034

Figure 38: North America Market Volume (Units) Analysis by Construction Method, 2019 to 2034

Figure 39: North America Market Value Share (%) and BPS Analysis by Construction Method, 2024 to 2034

Figure 40: North America Market Y-o-Y Growth (%) Projections by Construction Method, 2024 to 2034

Figure 41: North America Market Value (US$ Million) Analysis by End-Use Industry, 2019 to 2034

Figure 42: North America Market Volume (Units) Analysis by End-Use Industry, 2019 to 2034

Figure 43: North America Market Value Share (%) and BPS Analysis by End-Use Industry, 2024 to 2034

Figure 44: North America Market Y-o-Y Growth (%) Projections by End-Use Industry, 2024 to 2034

Figure 45: North America Market Attractiveness by Type, 2024 to 2034

Figure 46: North America Market Attractiveness by Construction Method, 2024 to 2034

Figure 47: North America Market Attractiveness by End-Use Industry, 2024 to 2034

Figure 48: North America Market Attractiveness by Country, 2024 to 2034

Figure 49: Latin America Market Value (US$ Million) by Type, 2024 to 2034

Figure 50: Latin America Market Value (US$ Million) by Construction Method, 2024 to 2034

Figure 51: Latin America Market Value (US$ Million) by End-Use Industry, 2024 to 2034

Figure 52: Latin America Market Value (US$ Million) by Country, 2024 to 2034

Figure 53: Latin America Market Value (US$ Million) Analysis by Country, 2019 to 2034

Figure 54: Latin America Market Volume (Units) Analysis by Country, 2019 to 2034

Figure 55: Latin America Market Value Share (%) and BPS Analysis by Country, 2024 to 2034

Figure 56: Latin America Market Y-o-Y Growth (%) Projections by Country, 2024 to 2034

Figure 57: Latin America Market Value (US$ Million) Analysis by Type, 2019 to 2034

Figure 58: Latin America Market Volume (Units) Analysis by Type, 2019 to 2034

Figure 59: Latin America Market Value Share (%) and BPS Analysis by Type, 2024 to 2034

Figure 60: Latin America Market Y-o-Y Growth (%) Projections by Type, 2024 to 2034

Figure 61: Latin America Market Value (US$ Million) Analysis by Construction Method, 2019 to 2034

Figure 62: Latin America Market Volume (Units) Analysis by Construction Method, 2019 to 2034

Figure 63: Latin America Market Value Share (%) and BPS Analysis by Construction Method, 2024 to 2034

Figure 64: Latin America Market Y-o-Y Growth (%) Projections by Construction Method, 2024 to 2034

Figure 65: Latin America Market Value (US$ Million) Analysis by End-Use Industry, 2019 to 2034

Figure 66: Latin America Market Volume (Units) Analysis by End-Use Industry, 2019 to 2034

Figure 67: Latin America Market Value Share (%) and BPS Analysis by End-Use Industry, 2024 to 2034

Figure 68: Latin America Market Y-o-Y Growth (%) Projections by End-Use Industry, 2024 to 2034

Figure 69: Latin America Market Attractiveness by Type, 2024 to 2034

Figure 70: Latin America Market Attractiveness by Construction Method, 2024 to 2034

Figure 71: Latin America Market Attractiveness by End-Use Industry, 2024 to 2034

Figure 72: Latin America Market Attractiveness by Country, 2024 to 2034

Figure 73: Europe Market Value (US$ Million) by Type, 2024 to 2034

Figure 74: Europe Market Value (US$ Million) by Construction Method, 2024 to 2034

Figure 75: Europe Market Value (US$ Million) by End-Use Industry, 2024 to 2034

Figure 76: Europe Market Value (US$ Million) by Country, 2024 to 2034

Figure 77: Europe Market Value (US$ Million) Analysis by Country, 2019 to 2034

Figure 78: Europe Market Volume (Units) Analysis by Country, 2019 to 2034

Figure 79: Europe Market Value Share (%) and BPS Analysis by Country, 2024 to 2034

Figure 80: Europe Market Y-o-Y Growth (%) Projections by Country, 2024 to 2034

Figure 81: Europe Market Value (US$ Million) Analysis by Type, 2019 to 2034

Figure 82: Europe Market Volume (Units) Analysis by Type, 2019 to 2034

Figure 83: Europe Market Value Share (%) and BPS Analysis by Type, 2024 to 2034

Figure 84: Europe Market Y-o-Y Growth (%) Projections by Type, 2024 to 2034

Figure 85: Europe Market Value (US$ Million) Analysis by Construction Method, 2019 to 2034

Figure 86: Europe Market Volume (Units) Analysis by Construction Method, 2019 to 2034

Figure 87: Europe Market Value Share (%) and BPS Analysis by Construction Method, 2024 to 2034

Figure 88: Europe Market Y-o-Y Growth (%) Projections by Construction Method, 2024 to 2034

Figure 89: Europe Market Value (US$ Million) Analysis by End-Use Industry, 2019 to 2034

Figure 90: Europe Market Volume (Units) Analysis by End-Use Industry, 2019 to 2034

Figure 91: Europe Market Value Share (%) and BPS Analysis by End-Use Industry, 2024 to 2034

Figure 92: Europe Market Y-o-Y Growth (%) Projections by End-Use Industry, 2024 to 2034

Figure 93: Europe Market Attractiveness by Type, 2024 to 2034

Figure 94: Europe Market Attractiveness by Construction Method, 2024 to 2034

Figure 95: Europe Market Attractiveness by End-Use Industry, 2024 to 2034

Figure 96: Europe Market Attractiveness by Country, 2024 to 2034

Figure 97: East Asia Market Value (US$ Million) by Type, 2024 to 2034

Figure 98: East Asia Market Value (US$ Million) by Construction Method, 2024 to 2034

Figure 99: East Asia Market Value (US$ Million) by End-Use Industry, 2024 to 2034

Figure 100: East Asia Market Value (US$ Million) by Country, 2024 to 2034

Figure 101: East Asia Market Value (US$ Million) Analysis by Country, 2019 to 2034

Figure 102: East Asia Market Volume (Units) Analysis by Country, 2019 to 2034

Figure 103: East Asia Market Value Share (%) and BPS Analysis by Country, 2024 to 2034

Figure 104: East Asia Market Y-o-Y Growth (%) Projections by Country, 2024 to 2034

Figure 105: East Asia Market Value (US$ Million) Analysis by Type, 2019 to 2034

Figure 106: East Asia Market Volume (Units) Analysis by Type, 2019 to 2034

Figure 107: East Asia Market Value Share (%) and BPS Analysis by Type, 2024 to 2034

Figure 108: East Asia Market Y-o-Y Growth (%) Projections by Type, 2024 to 2034

Figure 109: East Asia Market Value (US$ Million) Analysis by Construction Method, 2019 to 2034

Figure 110: East Asia Market Volume (Units) Analysis by Construction Method, 2019 to 2034

Figure 111: East Asia Market Value Share (%) and BPS Analysis by Construction Method, 2024 to 2034

Figure 112: East Asia Market Y-o-Y Growth (%) Projections by Construction Method, 2024 to 2034

Figure 113: East Asia Market Value (US$ Million) Analysis by End-Use Industry, 2019 to 2034

Figure 114: East Asia Market Volume (Units) Analysis by End-Use Industry, 2019 to 2034

Figure 115: East Asia Market Value Share (%) and BPS Analysis by End-Use Industry, 2024 to 2034

Figure 116: East Asia Market Y-o-Y Growth (%) Projections by End-Use Industry, 2024 to 2034

Figure 117: East Asia Market Attractiveness by Type, 2024 to 2034

Figure 118: East Asia Market Attractiveness by Construction Method, 2024 to 2034

Figure 119: East Asia Market Attractiveness by End-Use Industry, 2024 to 2034

Figure 120: East Asia Market Attractiveness by Country, 2024 to 2034

Figure 121: South Asia Market Value (US$ Million) by Type, 2024 to 2034

Figure 122: South Asia Market Value (US$ Million) by Construction Method, 2024 to 2034

Figure 123: South Asia Market Value (US$ Million) by End-Use Industry, 2024 to 2034

Figure 124: South Asia Market Value (US$ Million) by Country, 2024 to 2034

Figure 125: South Asia Market Value (US$ Million) Analysis by Country, 2019 to 2034

Figure 126: South Asia Market Volume (Units) Analysis by Country, 2019 to 2034

Figure 127: South Asia Market Value Share (%) and BPS Analysis by Country, 2024 to 2034

Figure 128: South Asia Market Y-o-Y Growth (%) Projections by Country, 2024 to 2034

Figure 129: South Asia Market Value (US$ Million) Analysis by Type, 2019 to 2034

Figure 130: South Asia Market Volume (Units) Analysis by Type, 2019 to 2034

Figure 131: South Asia Market Value Share (%) and BPS Analysis by Type, 2024 to 2034

Figure 132: South Asia Market Y-o-Y Growth (%) Projections by Type, 2024 to 2034

Figure 133: South Asia Market Value (US$ Million) Analysis by Construction Method, 2019 to 2034

Figure 134: South Asia Market Volume (Units) Analysis by Construction Method, 2019 to 2034

Figure 135: South Asia Market Value Share (%) and BPS Analysis by Construction Method, 2024 to 2034

Figure 136: South Asia Market Y-o-Y Growth (%) Projections by Construction Method, 2024 to 2034

Figure 137: South Asia Market Value (US$ Million) Analysis by End-Use Industry, 2019 to 2034

Figure 138: South Asia Market Volume (Units) Analysis by End-Use Industry, 2019 to 2034

Figure 139: South Asia Market Value Share (%) and BPS Analysis by End-Use Industry, 2024 to 2034

Figure 140: South Asia Market Y-o-Y Growth (%) Projections by End-Use Industry, 2024 to 2034

Figure 141: South Asia Market Attractiveness by Type, 2024 to 2034

Figure 142: South Asia Market Attractiveness by Construction Method, 2024 to 2034

Figure 143: South Asia Market Attractiveness by End-Use Industry, 2024 to 2034

Figure 144: South Asia Market Attractiveness by Country, 2024 to 2034

Figure 145: Oceania Market Value (US$ Million) by Type, 2024 to 2034

Figure 146: Oceania Market Value (US$ Million) by Construction Method, 2024 to 2034

Figure 147: Oceania Market Value (US$ Million) by End-Use Industry, 2024 to 2034

Figure 148: Oceania Market Value (US$ Million) by Country, 2024 to 2034

Figure 149: Oceania Market Value (US$ Million) Analysis by Country, 2019 to 2034

Figure 150: Oceania Market Volume (Units) Analysis by Country, 2019 to 2034

Figure 151: Oceania Market Value Share (%) and BPS Analysis by Country, 2024 to 2034

Figure 152: Oceania Market Y-o-Y Growth (%) Projections by Country, 2024 to 2034

Figure 153: Oceania Market Value (US$ Million) Analysis by Type, 2019 to 2034

Figure 154: Oceania Market Volume (Units) Analysis by Type, 2019 to 2034

Figure 155: Oceania Market Value Share (%) and BPS Analysis by Type, 2024 to 2034

Figure 156: Oceania Market Y-o-Y Growth (%) Projections by Type, 2024 to 2034

Figure 157: Oceania Market Value (US$ Million) Analysis by Construction Method, 2019 to 2034

Figure 158: Oceania Market Volume (Units) Analysis by Construction Method, 2019 to 2034

Figure 159: Oceania Market Value Share (%) and BPS Analysis by Construction Method, 2024 to 2034

Figure 160: Oceania Market Y-o-Y Growth (%) Projections by Construction Method, 2024 to 2034

Figure 161: Oceania Market Value (US$ Million) Analysis by End-Use Industry, 2019 to 2034

Figure 162: Oceania Market Volume (Units) Analysis by End-Use Industry, 2019 to 2034

Figure 163: Oceania Market Value Share (%) and BPS Analysis by End-Use Industry, 2024 to 2034

Figure 164: Oceania Market Y-o-Y Growth (%) Projections by End-Use Industry, 2024 to 2034

Figure 165: Oceania Market Attractiveness by Type, 2024 to 2034

Figure 166: Oceania Market Attractiveness by Construction Method, 2024 to 2034

Figure 167: Oceania Market Attractiveness by End-Use Industry, 2024 to 2034

Figure 168: Oceania Market Attractiveness by Country, 2024 to 2034

Figure 169: MEA Market Value (US$ Million) by Type, 2024 to 2034

Figure 170: MEA Market Value (US$ Million) by Construction Method, 2024 to 2034

Figure 171: MEA Market Value (US$ Million) by End-Use Industry, 2024 to 2034

Figure 172: MEA Market Value (US$ Million) by Country, 2024 to 2034

Figure 173: MEA Market Value (US$ Million) Analysis by Country, 2019 to 2034

Figure 174: MEA Market Volume (Units) Analysis by Country, 2019 to 2034

Figure 175: MEA Market Value Share (%) and BPS Analysis by Country, 2024 to 2034

Figure 176: MEA Market Y-o-Y Growth (%) Projections by Country, 2024 to 2034

Figure 177: MEA Market Value (US$ Million) Analysis by Type, 2019 to 2034

Figure 178: MEA Market Volume (Units) Analysis by Type, 2019 to 2034

Figure 179: MEA Market Value Share (%) and BPS Analysis by Type, 2024 to 2034

Figure 180: MEA Market Y-o-Y Growth (%) Projections by Type, 2024 to 2034

Figure 181: MEA Market Value (US$ Million) Analysis by Construction Method, 2019 to 2034

Figure 182: MEA Market Volume (Units) Analysis by Construction Method, 2019 to 2034

Figure 183: MEA Market Value Share (%) and BPS Analysis by Construction Method, 2024 to 2034

Figure 184: MEA Market Y-o-Y Growth (%) Projections by Construction Method, 2024 to 2034

Figure 185: MEA Market Value (US$ Million) Analysis by End-Use Industry, 2019 to 2034

Figure 186: MEA Market Volume (Units) Analysis by End-Use Industry, 2019 to 2034

Figure 187: MEA Market Value Share (%) and BPS Analysis by End-Use Industry, 2024 to 2034

Figure 188: MEA Market Y-o-Y Growth (%) Projections by End-Use Industry, 2024 to 2034

Figure 189: MEA Market Attractiveness by Type, 2024 to 2034

Figure 190: MEA Market Attractiveness by Construction Method, 2024 to 2034

Figure 191: MEA Market Attractiveness by End-Use Industry, 2024 to 2034

Figure 192: MEA Market Attractiveness by Country, 2024 to 2034

Frequently Asked Questions

What is the expected worth of the advanced lead acid battery market in 2024?

As of 2024, the market for advanced lead acid batteries is expected to be valued at USD 31.9 billion, as per FMI.

According to FMI, what is the anticipated market value for advanced lead acid battery in 2034?

By 2034, the market value of advanced lead acid batteries is expected to reach USD 62.0 billion.

What is the projected forecast CAGR for the advanced lead acid battery market from 2024 to 2034?

From 2024 to 2034, advanced lead acid batteries are expected to flourish at a CAGR of 6.9%

Based on end-use, which segment dominates the advanced lead acid battery market?

The Valve Regulated Lead Acid (VRLA) Battery segment is expected to account for a market share of 6.5% in 2024.

Which country is likely to be at the pinnacle of the market?

South Korea is likely the top-performing market, with a CAGR of 9.0%.

Explore Similar Insights

Future Market Insights

Advanced Lead Acid Battery Market