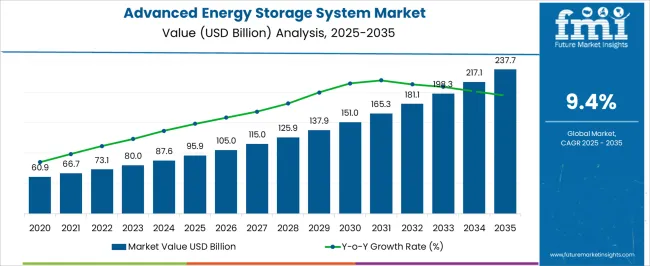
The Advanced Energy Storage System Market is estimated to be valued at USD 95.9 billion in 2025 and is projected to reach USD 237.7 billion by 2035, registering a compound annual growth rate (CAGR) of 9.4% over the forecast period.
| Metric | Value |
|---|---|
| Advanced Energy Storage System Market Estimated Value in (2025 E) | USD 95.9 billion |
| Advanced Energy Storage System Market Forecast Value in (2035 F) | USD 237.7 billion |
| Forecast CAGR (2025 to 2035) | 9.4% |
The advanced energy storage system market is growing robustly, propelled by rising integration of renewable energy, grid modernization, and the need for efficient energy management solutions. Energy storage systems are increasingly deployed to balance demand-supply fluctuations, improve grid stability, and support electrification initiatives across transportation and industrial sectors.
Current adoption trends are reinforced by favorable policies promoting clean energy, declining costs of storage technologies, and ongoing innovation in performance optimization. Both centralized and distributed storage systems are being implemented to ensure energy reliability and resilience.
The market outlook is particularly strong in regions with ambitious renewable energy targets and electrification programs. As digital monitoring, AI integration, and hybrid storage solutions advance, the sector is expected to play a pivotal role in the global energy transition.
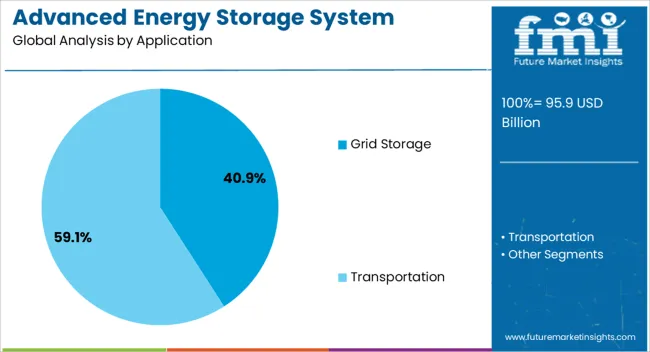
The grid storage segment leads the application category with approximately 40.90% share, reflecting the critical role of storage systems in stabilizing electricity networks. The need to integrate intermittent renewable energy sources such as wind and solar has significantly boosted demand for grid-scale storage.
Grid operators rely on storage solutions to manage peak loads, ensure frequency regulation, and reduce reliance on fossil fuel-based peaking plants. Increasing investments in utility-scale battery projects and government-led energy transition initiatives have reinforced the segment’s prominence.
With growing emphasis on decarbonization and energy reliability, grid storage is expected to remain the largest application area for advanced storage systems.
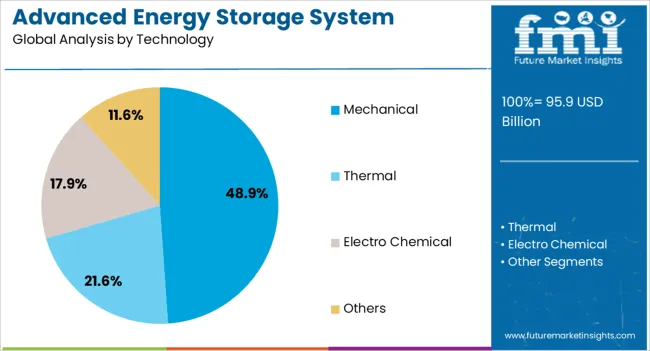
The mechanical segment holds approximately 48.90% share of the technology category, led by established solutions such as pumped hydro storage, compressed air energy storage, and flywheels. These technologies are valued for their large-scale capacity, long lifespan, and cost efficiency in bulk storage applications.
Mechanical storage plays a vital role in grid balancing and frequency regulation, offering advantages in stability and scalability. The segment benefits from ongoing infrastructure investments and retrofitting of existing facilities to accommodate renewable integration.
Although newer electrochemical and thermal solutions are expanding, mechanical technologies remain a cornerstone of global storage infrastructure. With strong institutional support and proven performance, the mechanical segment is projected to sustain its leadership.
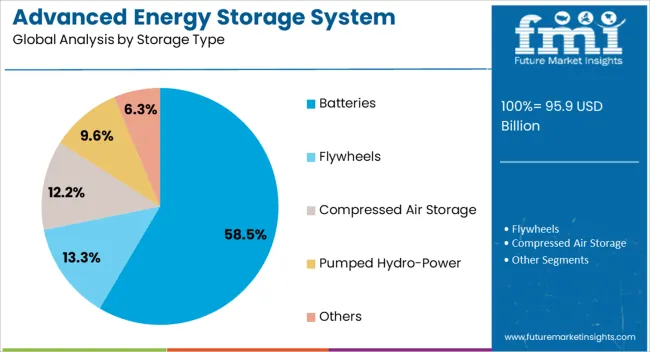
The batteries segment dominates the storage type category with approximately 58.50% share, driven by rapid advancements in lithium-ion technology and the accelerating adoption of electric vehicles and renewable integration projects. Batteries provide high energy density, modularity, and fast response capabilities, making them suitable for both grid-scale and distributed applications.
Declining costs of lithium-ion batteries, along with emerging chemistries such as solid-state and flow batteries, are broadening adoption. Residential and commercial installations, coupled with utility-scale projects, have further boosted demand.
With strong policy support, expanding manufacturing capacity, and continuous innovation in performance and safety, the batteries segment is expected to maintain its dominant role in the advanced energy storage system market.
The global demand for advanced energy storage system market was estimated to reach a global market valuation of USD 60.9 billion in 2020, according to a report from Future Market Insights (FMI). From 2020 to 2025, sales witnessed significant growth in the advanced energy storage system market, registering a CAGR of 11.6%.
| Historical CAGR from 2020 to 2025 | 11.6% |
|---|---|
| Forecast CAGR from 2025 to 2035 | 9.5% |
The energy storage industry is constantly researching and developing new technologies. Advanced energy storage systems now feature more safety, lower prices, and increased efficiency owing to technological advancements, which makes them even more appealing to companies and individuals. Some crucial factors that will boost the market growth through 2035 are:
These positive aspects position the market for long-term growth, making it critical for players to stay agile as well as strategic during the projection period.
A Shift towards Sustainable Energy Sources to Boot Market Growth
One major factor propelling the market for advanced energy storage systems is the global push for sustainability and the shift to low-carbon energy. The globe is embracing renewable energy sources like wind and solar power more and more, but their intermittent nature highlights how important energy storage is to preserving system stability.
Governments and companies realizing the value of clean energy and pushing laws and incentives in this regard are creating a strong market demand for advanced energy storage technologies as essential parts of a sustainable and resilient energy infrastructure.
Rising Demand for EVs to Accelerate Market Growth
The market for advanced energy storage systems is mostly driven by the growing demand for electric vehicles (EVs). High-capacity, effective batteries are becoming more and more necessary as the automotive industry moves toward electrification.
In addition to providing electricity for EVs, advanced energy storage technologies also allow for bidirectional energy flow between vehicles and the grid, which promotes grid stability. This dual function, together with the growing adoption of electric vehicles and related infrastructure needs, boosts the total market demand for advanced energy storage systems.
High Upfront Costs and Technological Challenges to Restrict the Overall Market Growth
Despite the long-term advantages, high upfront costs continue to be a major obstacle, discouraging potential consumers. Technological obstacles like scarce materials and low energy density might prevent efficiency gains. Scalability can be constrained by regulatory uncertainty and the absence of standard frameworks, which can act as obstacles to market participation.
Challenges also arise from worries about safety, the environment, and how to dispose of used batteries. To fully realize the potential of advanced energy storage systems and promote their wider use, it will be imperative to remove these obstacles as the market develops through legislative support, research, and cooperative initiatives.
This section concentrates on offering in-depth analyses of particular categories within the advanced energy storage system market. The analysis will focus on two prominent segments, grid storage and mechanical technology.
| Key Segments | Growth Rate |
|---|---|
| Grid Storage by Application | 9.3% CAGR |
| Mechanical by Technology | 9.0% CAGR |
During the forecast period, the grid storage segment is likely to rise at a 9.3% CAGR. Grid storage by application type is projected to achieve a dominating market share within the advanced energy storage systems industry owing to its critical role in improving grid dependability and stability.
Grid storage, which stores extra power during peak generating periods and releases it during high-demand periods or whenever renewable sources are inactive, guarantees effective energy management as renewable energy integration grows.
Grid storage is positioned as a crucial solution by the increased emphasis on grid modernization and the growing requirement for grid resilience and flexibility. Governments throughout the world realizing its importance, putting supporting laws in place, and funding large-scale grid storage initiatives, are fostering its presence in the market.
In 2025, the mechanical technology segment was estimated to have acquired a 48.9% global market share. The market for advanced energy storage systems is expected to witness growth in the mechanical technology sector because of its inherent benefits. In comparison to certain chemical-based options, mechanical systems like flywheels and pumped hydro storage offer greater efficiency, longer operating lifespans, and less environmental effect.
They are ideally suited for grid balancing as well as stabilizing variations in renewable energy output because of their quick energy storage and release capabilities. Mechanical technologies are becoming more and more popular in the market because of their dependable and strong performance, which makes them appealing solutions in an industry that places a high value on sustainability and dependability. A 9% CAGR is forecasted for this segment until 2035.
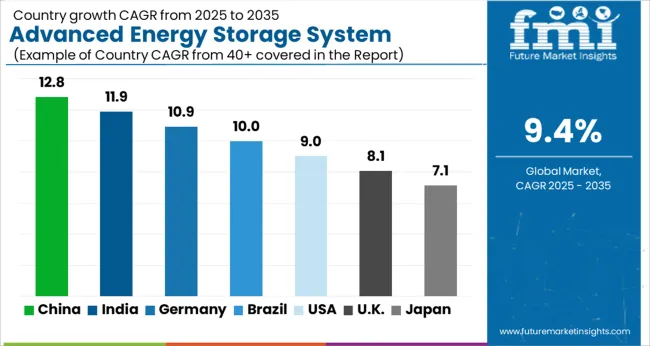
This section analyzes the markets for advanced energy storage systems in many important nations, such as the United States, the United Kingdom, China, Japan, and South Korea. The section goes into the particular aspects that influence the demand, acceptance, and sales of advanced energy storage systems in different countries.
The United States advanced energy storage system is anticipated to gain a CAGR of 9.9% through 2035. Factors that are boosting the growth are:
The market in the United Kingdom is expected to expand with a 10.9% CAGR through 2035. The factors pushing the growth are:
China advanced energy storage system ecosystem is anticipated to develop with a 10.4% CAGR from 2025 to 2035. The probable reasons behind this growth are:
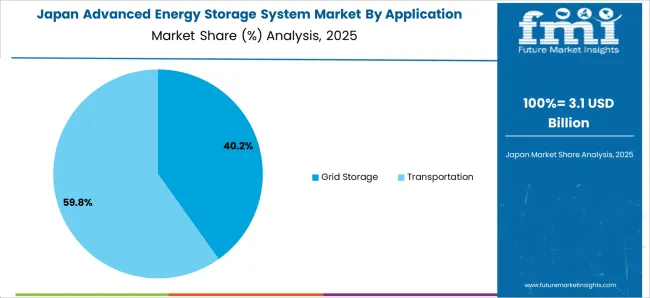
The advanced energy storage system in Japan is expected to reach an 11.1% CAGR from 2025 to 2035. The reasons accelerating growth are:
The South Korea advanced energy storage industry is likely to attain a 6.4% CAGR during the forecast period. The factors boosting the growth are:
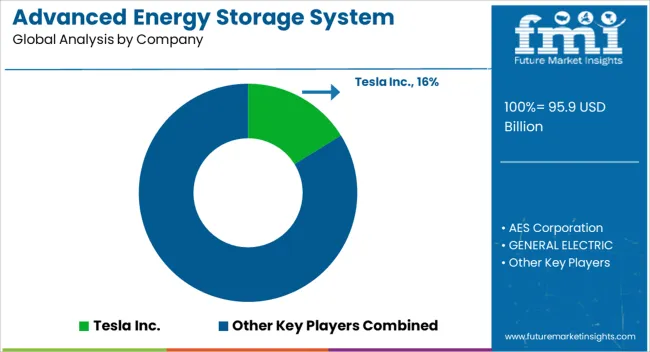
To take advantage of the rising demand, significant players in the market for advanced energy storage systems are launching calculated campaigns. Prominent corporations allocate significant resources to research and development with the aim of improving technology's efficacy, longevity, and affordability.
They work together with utilities and governments to get over regulatory obstacles and take use of financial incentives to enter new markets. Alliances and acquisitions help businesses grow into new markets and diversify their product lines. Common tactics to convey the advantages of enhanced energy storage include customer education and awareness campaigns. Together, these initiatives solve environmental issues and spur market expansion and innovation.
Key market participants are making significant advancements in the advanced energy storage system sector, and these include:
| Report Attribute | Details |
|---|---|
| Growth Rate | CAGR of 9.5% from 2025 to 2035 |
| Market value in 2025 | USD 87.6 billion |
| Market value in 2035 | USD 218.0 billion |
| Base Year for Estimation | 2025 |
| Historical Data | 2020 to 2025 |
| Forecast Period | 2025 to 2035 |
| Quantitative Units | USD billion for value |
| Report Coverage | Revenue Forecast, Company Ranking, Competitive Landscape, Growth Factors, Trends, and Pricing Analysis |
| Segments Covered | Applications, Technology, Storage Type, Region |
| Region Covered | North America; Latin America; Western Europe; Eastern Europe; South Asia and Pacific; East Asia; Middle East & Africa |
| Countries Profiled | United States, Canada, Brazil, Mexico, Germany, United Kingdom, France, Spain, Italy, Poland, Russia, Czech Republic, Romania, India, Bangladesh, Australia, New Zealand, China, Japan, South Korea, GCC Countries, South Africa, Israel |
| Key Companies Profiled | AES Corporation; Tesla Inc.; GENERAL ELECTRIC; ABB; Saft; LG Chem.; Siemens AG; Panasonic Corporation; Electrovaya; Hitachi Ltd. |
| Customization Scope | Available on Request |
The global advanced energy storage system market is estimated to be valued at USD 95.9 billion in 2025.
The market size for the advanced energy storage system market is projected to reach USD 237.7 billion by 2035.
The advanced energy storage system market is expected to grow at a 9.4% CAGR between 2025 and 2035.
The key product types in advanced energy storage system market are grid storage and transportation.
In terms of technology, mechanical segment to command 48.9% share in the advanced energy storage system market in 2025.


Full Research Suite comprises of:
Market outlook & trends analysis
Interviews & case studies
Strategic recommendations
Vendor profiles & capabilities analysis
5-year forecasts
8 regions and 60+ country-level data splits
Market segment data splits
12 months of continuous data updates
DELIVERED AS:
PDF EXCEL ONLINE
Advanced Process Control Market Size and Share Forecast Outlook 2025 to 2035
Advanced Lead Acid Battery Market Size and Share Forecast Outlook 2025 to 2035
Advanced Therapeutics Pharmaceutical Outsourcing Market Size and Share Forecast Outlook 2025 to 2035
Advanced Airport Technologies Market Size and Share Forecast Outlook 2025 to 2035
Advanced Air Mobility Market Size and Share Forecast Outlook 2025 to 2035
Advanced Sensor Market Size and Share Forecast Outlook 2025 to 2035
Advanced Combat Helmet Market Size and Share Forecast Outlook 2025 to 2035
Advanced Optics Material Market Size and Share Forecast Outlook 2025 to 2035
Advanced Functional Materials Market Size and Share Forecast Outlook 2025 to 2035
Advanced Drill Data Management Solutions Market Size and Share Forecast Outlook 2025 to 2035
Advanced Water Management And Filtration Equipment Market Size and Share Forecast Outlook 2025 to 2035
Advanced Coating Market Size and Share Forecast Outlook 2025 to 2035
Advanced Aerospace Coatings Industry Analysis in Europe - Size, Share, and Forecast 2025 to 2035
Advanced Tires Market Size and Share Forecast Outlook 2025 to 2035
Advanced Therapy Medicinal Products Market Size and Share Forecast Outlook 2025 to 2035
Advanced Glass Market Size and Share Forecast Outlook 2025 to 2035
Advanced Sports Materials Market Size and Share Forecast Outlook 2025 to 2035
Advanced Wound Management Market Growth - Industry Outlook 2025 to 2035
Advanced Packaging Market Size & Share Forecast 2025 to 2035
Advanced Polymer Composites Market Growth - Trends & Forecast 2025 to 2035

Thank you!
You will receive an email from our Business Development Manager. Please be sure to check your SPAM/JUNK folder too.
Chat With
MaRIA