The global EV (electric vehicle) charging station market is projected to grow from USD 26.87 billion in 2025 to USD 143 billion by 2035, expanding at an impressive compound annual growth rate (CAGR) of 18.2% during the forecast period.
This sustained growth is attributed to the surging adoption of electric vehicles globally, driven by carbon neutrality targets, energy security goals, and strong government initiatives aimed at reducing vehicular emissions. The market expansion is intrinsically linked to the growing fleet of electric cars, particularly as environmental sustainability becomes a central theme in transport policy frameworks across major economies.
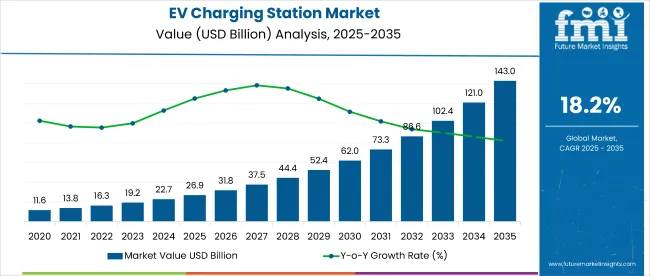
The growth trajectory of the EV charging station market is fueled by a convergence of factors including policy incentives, technological breakthroughs, and the escalating demand for fast and convenient charging options. Public and private investments are intensifying to deploy ultra-fast charging stations, with the ability to deliver 350 kW output or more, significantly reducing vehicle downtime. Moreover, industry innovations such as wireless inductive charging, smart grid integration, and vehicle-to-grid (V2G) technology are enhancing grid stability while optimizing energy distribution.
Leading regions such as North America and Europe dominate the EV charging infrastructure landscape, underpinned by favorable legislative mandates, EV subsidies, and climate pledges. In contrast, Asia Pacific-especially China and India-is projected to witness the fastest market growth owing to urbanization, economic incentives, and infrastructure development. In India, cities like Delhi, Bangalore, and Mumbai are witnessing rapid deployment of public charging networks supported by state schemes and private-sector partnerships.
An article published in the journal Renewable and Sustainable Energy Reviews (2023) emphasizes the importance of renewable energy-powered charging stations in reducing the carbon footprint of electric mobility. Solar and wind energy integration into EV charging grids is becoming mainstream, aligning with decarbonization targets.
Additionally, the issue of "range anxiety" is being addressed by widespread fast-charging corridors on highways, ensuring reliable long-distance travel. The emphasis on battery swapping stations in certain markets further diversifies the charging ecosystem. A combination of technological evolution, regulatory support, and market-driven innovation is establishing EV charging stations as a critical component of the future global transport infrastructure.
The integration of sensors and IoT in the EV charging station market is redefining the way charging infrastructure operates by making it smarter, safer, and more efficient. These technologies enable real-time data collection and connectivity between vehicles, charging stations, and power grids, ensuring optimized energy usage and enhanced user experience. By embedding intelligent systems, operators can monitor performance, detect faults proactively, and implement predictive maintenance strategies that reduce downtime and operational costs.
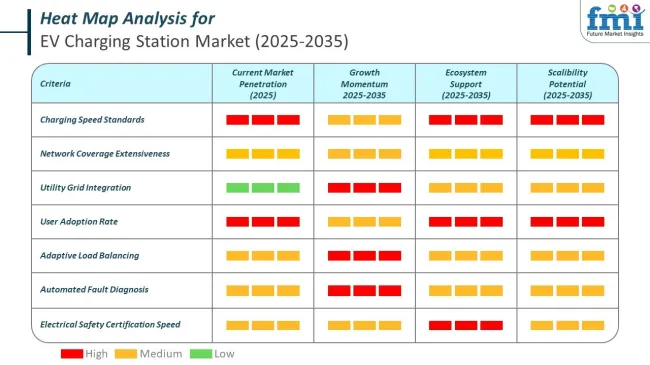
The adoption of sensors and IoT in the EV charging station industry is enabling companies to create intelligent, connected infrastructure that enhances safety, efficiency, and user experience. These technologies provide real-time monitoring, predictive maintenance, and smart energy management, helping operators reduce downtime and optimize performance.
The table below presents a comparative assessment of the variation in CAGR over six months for the base year (2024) and the current year (2025).
This analysis reveals crucial shifts in performance and indicates growth patterns, thereby providing stakeholders with a better vision of the growth trajectory over the year. The first half of the year, or H1, spans from January to June. The second half, i.e., H2, includes the months from July to December.
While there was a slight fluctuation in growth rate between 2024 and 2025, the overall demand remained positive, demonstrating consistent growth as manufacturers were able to capitalize on opportunities despite economic fluctuations.
The figures included in the table below show the growth of the sector for each half-year between 2024 and 2025.
| Particular | Value CAGR |
|---|---|
| H1 | 18.5% (2024 to 2034) |
| H2 | 17.9% (2024 to 2034) |
| H1 | 18.6% (2025 to 2035) |
| H2 | 18.1% (2025 to 2035) |
During 2024 H1, the industry experienced a strong growth rate of 18.5% and a marginally lower growth rate of 17.9% in 2024 H2, indicating low growth momentum in 2024.
Moving to the subsequent period, from H1 of 2024 to 2025. Growth will remain strong at 18.1% in 2025 H2 as compared to 2024 H2 with an increase of 20 BPS, indicating stability and providing stakeholders confidence on the market’s growth trajectory. Industry experienced substantial growth reflecting rising demand for charging infrastructure owing to increased EV sales and government subsidies boosting the demand.
The private charging station segment is expected to dominate the market, growing at a robust 18.3% CAGR through 2035. Residential charging stations also show significant growth, with a 18.3% CAGR during the forecast period, driven by convenience and financial incentives for consumers.
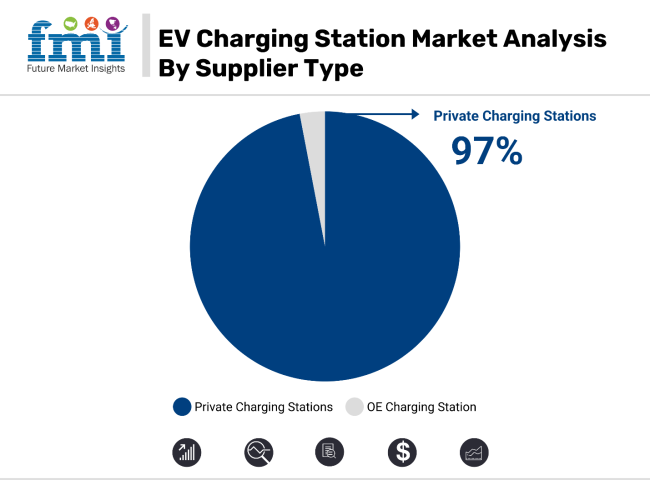
The private charging station segment is expected to dominate the EV charging station market, accounting for over 97% of the market share in 2025 and continuing its dominance through 2035. With a value CAGR of 18.3%, this segment is primarily driven by technological innovations in charging speed, digital charging solutions, and integration with renewable energy sources. These advancements make private charging stations more efficient, faster, and more reliable, catering to the increasing demand for accessible charging infrastructure.
Governments across the globe are offering financial incentives to promote the installation of private EV chargers, helping reduce upfront costs and making it more affordable for consumers. These incentives are particularly important in markets where EV adoption is accelerating, contributing to the expansion of private charging infrastructure.
Additionally, the convenience of home-based charging, combined with lower energy costs during off-peak hours, further fuels market growth. As the demand for EVs and related infrastructure continues to rise, private charging stations will remain a key driver in the EV charging station industry.
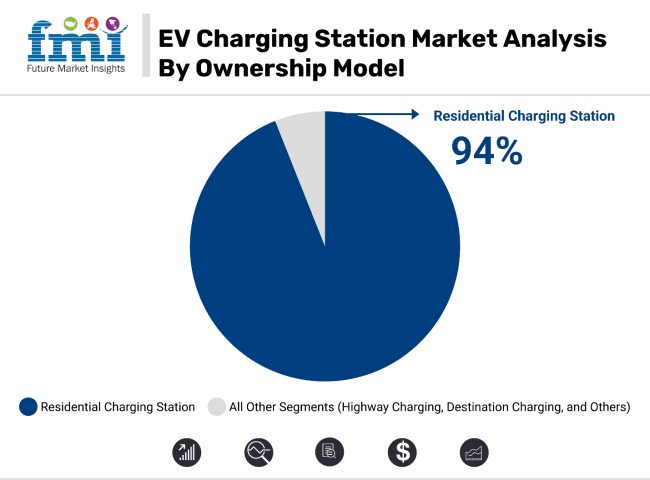
Residential charging stations are projected to see significant growth, with an 18.3% CAGR during the forecast period. The residential charging segment holds more than 94% of the total market share. This growth is fueled by the convenience of overnight charging at home, allowing EV owners to benefit from lower electricity prices during off-peak hours. In countries like Norway, where EV sales exceed 90%, over 80% of EV owners have access to home charging, showcasing a strong adoption rate.
In regions such as India, the UK, and Mexico, residential charging stations are gaining traction due to government incentives, such as tax rebates and installation subsidies, which reduce the cost for consumers. For example, the USA offers a 30% federal tax credit for home charger installations up to USD 1,000.
The UK's early adoption of smart charging regulations, alongside the rise of wireless charging solutions, also contributes to the segment’s growth. As the demand for EVs continues to rise, residential charging stations will remain a key segment in the overall EV charging infrastructure landscape.
OEMs entering the charging station market, transforming the EV landscape
Access to reliable fast charging stations is one of the biggest hurdles for many developed countries while trying to boost adoption of electric mobility. Tesla’s supercharger network is one of the largest globally and continues to expand in regions like Europe.
BMW, GM, Kia, Honda, Mercedez-Benz, Hyundai, and Stellantis are partnering to develop a new public charging network across North America. This unmanned venture promises to bring up to 30,000 new high speed charging stations on highways and urban areas by 2030.
Notably, the new charging infrastructure will be compatible with vehicles manufactured by all partner companies. These stations will integrate the Plug and Charge standard, which offers more secure and convenient charging at compatible stations.
The USA government has planned to invest USD7.5 billion in EV charging infrastructure to reach a goal of 500,000 charging stations nationwide. The joint venture leans into this initiative. It will leverage funding from the National Electric Vehicle Infrastructure (NEVI) plan as well as other private and public sources.
Wireless charging technology revolutionizing urban EV infrastructure
Increasing adoption of autonomous charging robots and wireless charging technology across developing regions is projected to bolster the EV charging station demand. Wireless power transfer (WPT) or inductive technology might deliver high convenience to EV owners.
This wireless charging using inductive technology eliminates the need for physical connections and improves owner’s convenience of EV charging. Major competitors include WiTriCity, Momentum Dynamics, ChargePoint, and Plugless.
Rising adoption of EVs in Asia Pacific is anticipated to propel the demand for new charging infrastructure. Autonomous charging robots' ability to improve charging station functions by connecting EVs to charging points automatically might drive sales. Such charging robots also send real-time notifications to the user when the charging is complete.
Autonomous robots and wireless charging technologies could further lower the requirement for extensive infrastructure and cabling upgrades at charging stations. Their cost-effectiveness is anticipated to push government bodies and companies across Asia Pacific to invest in EV charging station expansion plans.
Renewable energy powering the future of EV charging stations
Charging station operators strategically integrate on-site wind and solar power systems as primary energy sources for EV charging. This sustainable approach is set to ensure uninterrupted operations while remaining connected to the grid. When EV charging demand aligns with the capacity of these renewable energy sources, these stations become entirely self-reliant.
Excess energy generated during periods of low demand can be fed back into the grid for credits or stored for future use. During high-demand periods, additional power required for charging can seamlessly be drawn from the grid. This dynamic strategy can optimize resource utilization, minimize operational costs, and stabilize the grid.
Consequently, charging stations will likely enhance their environmental credentials and financial sustainability by efficiently managing energy generation, consumption, and distribution.
Government policies and investments support expanding charging network
The Alternative Fuel Infrastructure Directive (AFID) policy was initially conceived by the European Union (EU) but adopted widely beyond its borders. It advocates deploying public electric vehicle (EV) charging stations with a recommended 1 kilowatt (KW) capacity per vehicle.
The policy shift is expected to push the replacement of slow, low-capacity chargers with high-capacity alternatives, significantly reducing EV charging times. Moreover, introducing faster charging points might enhance accessibility, increasing engagement and potential revenue for charging station operators.
For instance, in India, FAME II has offered financial support and set targets to build charging infrastructure, i.e., chargers to be installed at every 25 km along highways. In March, the ministry of heavy industries announced financial aid for the development of charging networks across the country.
The USA government has announced around USD 50 million to subsidize projects aiming to expand convenient charging in line with its target of reaching 900,000 chargers by 2030 and 1.7 million by 2035. Thus, government policies and subsidies worldwide are driving the expansion of high-capacity EV charging infrastructure with enhanced accessibility.
Tier 1 companies comprise players capturing a significant share of 50% to 60% in the global market. These players are distinguished by their extensive expertise in manufacturing and system-integrating capabilities with a broad geographical reach. Prominent companies within Tier 1 include Tesla, ABB, BYD, Schneider Electric SE, Shell, Tritium, etc.
Tier 2 companies include mid-size players having presence in specific regions and highly influencing the local industry characterized by strong industry knowledge. Tier 2 players such as Delta Electronics, Siemens, and Webasto, among others, are projected to account for 30% to 40% of the overall industry.
The section below covers the industry analysis for EV charging station growth potential in different countries. China and Japan are likely to remain leading market in the EV charging station market owing to their dominance in automotive sales.
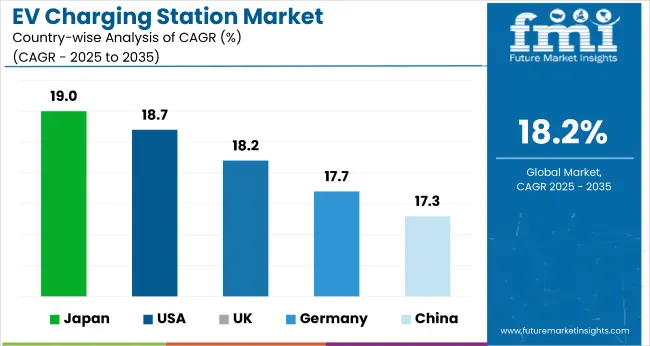
| Countries | CAGR (2025 to 2035) |
|---|---|
| USA | 18.7% |
| UK | 18.2% |
| China | 17.3% |
| Japan | 19.0% |
| Germany | 17.7% |
China is expected to continue its dominance throughout the forecast period in EV sales, driven by the country’s strong commitment to electric mobility. The growth rate of China continues to rise, although the Chinese government has phased out subsidies for EV purchases and shifted its focus to improving the quality and coverage of its already impressive charging network.
Over the assessment period from 2024 to 2034, China is projected to expand at a CAGR of 17.8% and expected to result in a market size of USD 67 billion by the end of 2035.
China leads the charging station market, with more than 85% of the world's fast chargers and around 60% of slow chargers’ installations. China also achieved a market share of more than 35% in electric car sales, thus surpassing their policy ambition for 2025. China is shifting its focus towards improving its charging infrastructure network, targeting full coverage in cities and on national highways by 2030, as well as expanding its rural coverage.
The EV charging station market sales in Germany is estimated to reach USD 15,515.6 million in 2035, expanding at a CAGR of 17.7%.
According to the German Association for Automotive Industry (VDA), 699,943 new passenger plug-in electric cars have been registered in 2024. To support this growing number of EV sales in the country, the Ministry of Digital Affairs and Transport has announced to expand wireless public and private charging infrastructure networks to promote sustainable transportation with the use of renewable energy sources.
In June 2023, the German Transport Ministry announced it will provide subsidies of around USD 1.1 billion to expand household EV charging stations. Bayern, Nordrhein-Westfalen, and Baden- Württemberg are the leading states with higher numbers of electric vehicle charging infrastructures in Germany.
Along with Germany's robust automotive industry, factors like energy management, digital and smart charging solutions, and the growing charging service industry provide multiple opportunities for the growth of the market.
Japan is expected to reach a valuation of USD 1,093.8 million by 2035 in the EV charging station market and likely witness a decent CAGR of 19.0% during the assessment period. Japan is home to nearly 30,000 EV chargers, as Enechange Ltd. being the largest provider of EV chargers, has the monopoly in this arena.
Japan's government offers foremost subsidies to promote the sales of EVs with the aim of making them carbon neutral by 2050, which led to subsidizing the charging stations in the country, driving the market's growth during the forecast period.
The local government is boosting the sales of green fuel vehicles and to power all new vehicles with electricity, both electric and hybrid electric vehicles sold by 2035. This will enhance the demand for electric vehicle charging stations during the forecast period.
With this ambitious plan, the government has increased incentives for EV purchase and also began subsidizing charging infrastructure, aiming to reach 300,000 charging stations along expressways with an output of 90 kilowatts by 2030. For instance, a Japanese startup, Terra Motors, has unveiled plans to establish 1,000 fast charging stations exclusively for EVs in Tokyo within the next 18 months.
Amid growing environmental concerns and strong market potentials with attractive government incentives, Japan’s EV charging station market is set for major growth, offering ample opportunities for market players contributing to sustainability.
The EV charging station market is moderately fragmented, with key players holding around 40%-50% share in the market, along with the presence of many medium- and small-scale manufacturers. Key manufacturers are engaged in technological advancements focusing on improved features such as performance, safety, and cost-effectiveness.
Key battery manufacturers like Tesla, ABB, and Siemens are expanding their charging networks to meet the increasing demand by rising EV sales with enhanced charging speed, smart grid integration, and superior service quality at public stations.
Industry Updates
| Report Attributes | Details |
|---|---|
| Market Size (2025) | USD 26.87 billion |
| Projected Market Size (2035) | USD 143 billion |
| CAGR (2025 to 2035) | 18.2% |
| Base Year for Estimation | 2024 |
| Historical Period | 2020 to 2024 |
| Projections Period | 2025 to 2035 |
| Quantitative Units | USD billion for value and units for volume |
| Charging Station Categories Analyzed (Segment 1) | AC Charging Station (1kW to 11kW, 11kW to 43kW), DC Charging Station (20 kW to 50 kW, 50 kW to 150 kW, 150 kW to 250 kW, >250 kW) |
| Ownership Models Analyzed (Segment 2) | Highway Charging, Destination Charging, Workplace Charging, Parking Lots, Fleet Charging Station, Residential Charging Station |
| Supplier Types Analyzed (Segment 3) | OE Charging Station, Private Charging Station |
| Installation Categories Analyzed (Segment 4) | Portable, Fixed |
| Regions Covered | North America, Latin America, East Asia, South Asia & Pacific, Western Europe, Eastern Europe, Middle East & Africa |
| Key Players Influencing the Market | Tesla Inc., BYD, ABB, Schneider Electric SE, Robert Bosch GmbH, Siemens AG, Webasto, General Electric, Delta Electronics, Wallbox, Efacec, Star Charge, Eaton, Tritium, BP, Elli, Engie, Virta, Charge+, TotalEnergies |
| Additional Attributes | Dollar sales by charger type (Level 2/DC fast), deployment trends (public/residential), key player market shares, regional demand (NA/EU/Asia), and growth drivers (government incentives/fleet electrification). |
By Charging Station category is classified into AC Charging Station and DC Charging Station. AC charging station is further classified into 1kW to 11kW and 11kW to 43kW. DC charging station is further categorized by 20 kW to 50 kW, 50 kW to 150 kW, 150 kW to 250 kW, >250 kW.
By Ownership Model is categorized as Highway Charging, Destination Charging, Workplace Charging, Parking Lots, Fleet Charging Station, Residential Charging Station.
By Supply Type category includes OE Charging Station and Private Charging Station.
By Installation category includes Portable, Fixed
Leading regions included in the study are North America, Latin America, East Asia, South Asia Pacific, Western Europe, Eastern Europe and Middle East and Africa.
The EV Charging Station used grid services, behind the meter and off grid were valued at USD 26,874.4 million in 2024.
The demand for EV Charging Station is set to reach USD 26.87 billion in 2025.
Rising EV adoption, government incentives and subsidies, technological innovations and renewable energy integration are anticipated to drive the demand during the forecast period.
The demand is projected to reach USD 143 billion by 2035.
AC Charging Station is expected to Charging Station segment during the forecast period.


Our Research Products

The "Full Research Suite" delivers actionable market intel, deep dives on markets or technologies, so clients act faster, cut risk, and unlock growth.

The Leaderboard benchmarks and ranks top vendors, classifying them as Established Leaders, Leading Challengers, or Disruptors & Challengers.

Locates where complements amplify value and substitutes erode it, forecasting net impact by horizon

We deliver granular, decision-grade intel: market sizing, 5-year forecasts, pricing, adoption, usage, revenue, and operational KPIs—plus competitor tracking, regulation, and value chains—across 60 countries broadly.

Spot the shifts before they hit your P&L. We track inflection points, adoption curves, pricing moves, and ecosystem plays to show where demand is heading, why it is changing, and what to do next across high-growth markets and disruptive tech

Real-time reads of user behavior. We track shifting priorities, perceptions of today’s and next-gen services, and provider experience, then pace how fast tech moves from trial to adoption, blending buyer, consumer, and channel inputs with social signals (#WhySwitch, #UX).

Partner with our analyst team to build a custom report designed around your business priorities. From analysing market trends to assessing competitors or crafting bespoke datasets, we tailor insights to your needs.
Supplier Intelligence
Discovery & Profiling
Capacity & Footprint
Performance & Risk
Compliance & Governance
Commercial Readiness
Who Supplies Whom
Scorecards & Shortlists
Playbooks & Docs
Category Intelligence
Definition & Scope
Demand & Use Cases
Cost Drivers
Market Structure
Supply Chain Map
Trade & Policy
Operating Norms
Deliverables
Buyer Intelligence
Account Basics
Spend & Scope
Procurement Model
Vendor Requirements
Terms & Policies
Entry Strategy
Pain Points & Triggers
Outputs
Pricing Analysis
Benchmarks
Trends
Should-Cost
Indexation
Landed Cost
Commercial Terms
Deliverables
Brand Analysis
Positioning & Value Prop
Share & Presence
Customer Evidence
Go-to-Market
Digital & Reputation
Compliance & Trust
KPIs & Gaps
Outputs
Full Research Suite comprises of:
Market outlook & trends analysis
Interviews & case studies
Strategic recommendations
Vendor profiles & capabilities analysis
5-year forecasts
8 regions and 60+ country-level data splits
Market segment data splits
12 months of continuous data updates
DELIVERED AS:
PDF EXCEL ONLINE
EV Charging Panelboard Market Forecast Outlook 2025 to 2035
EV Charging Tester Market Size and Share Forecast Outlook 2025 to 2035
EV Charging Cable Market Size and Share Forecast Outlook 2025 to 2035
EV Charging Management Software Platform Market Size and Share Forecast Outlook 2025 to 2035
eVTOL Charging Facilities Market Size and Share Forecast Outlook 2025 to 2035
Wireless Ev Charging Market Size and Share Forecast Outlook 2025 to 2035
Automotive EV Charging Adapters Market
Long Term Evolution Base Station Market Size and Share Forecast Outlook 2025 to 2035
Electric Vehicle Charging Station Market Size and Share Forecast Outlook 2025 to 2035
AC Electric Vehicle Charging Station Market Size and Share Forecast Outlook 2025 to 2035
Private Electric Vehicle Charging Station Market Size and Share Forecast Outlook 2025 to 2035
EV Charger Tester Market Size and Share Forecast Outlook 2025 to 2035
EV Transmission System Market Size and Share Forecast Outlook 2025 to 2035
EV Charger Converter Module Market Forecast Outlook 2025 to 2035
Evacuated Miniature Crystal Oscillator (EMXO) Market Forecast and Outlook 2025 to 2035
Stationery Product Market Forecast and Outlook 2025 to 2035
Stationary Battery Storage Market Size and Share Forecast Outlook 2025 to 2035
Evaporative Air Cooler Market Size and Share Forecast Outlook 2025 to 2035
EVOH Encapsulation Film Market Size and Share Forecast Outlook 2025 to 2035
Event Tourism Market Size and Share Forecast Outlook 2025 to 2035

Thank you!
You will receive an email from our Business Development Manager. Please be sure to check your SPAM/JUNK folder too.
Chat With
MaRIA