EV Charger Converter Module Market Size and Share Forecast Outlook From 2024 to 2034

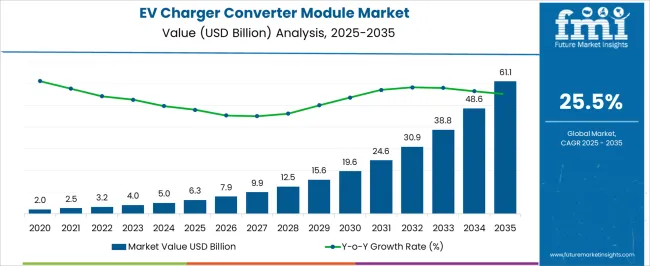
The global EV charger converter module market size reached USD 4,054.3 million in 2023 and is expected to total USD 5,019.0 million by 2024. Global sales of EV charger converter modules are anticipated to rise at a staggering 25.5% CAGR during the next ten years. By 2034, the total market valuation is expected to reach USD 48,605.2 million.

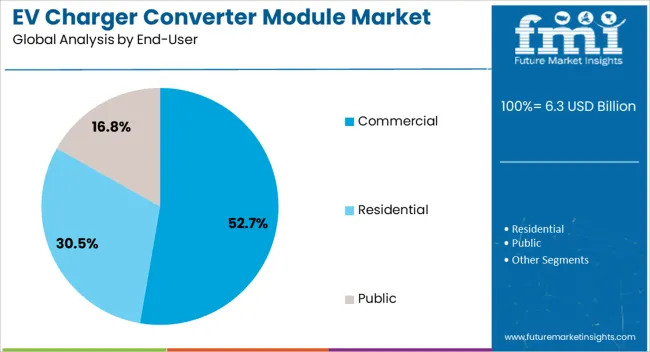
The demand for EV charger converter modules is expected to remain high in the commercial segment. The latest EV charger converter module market analysis predicts the commercial segment to thrive at 23.1% CAGR during the forecast period.

Attributes Key Insights
Base Value (2023) USD 4,054.3 million
Estimated EV Charger Converter Module Market Value (2024) USD 5,019.0 million
Projected EV Charger Converter Module Market Revenue (2034) USD 48,605.2 million
Value-based CAGR (2024 to 2034) 25.5%
Collective Value Share: Top 5 Countries (2024E) 80.4%

Top EV Charger Converter Module Market Dynamics and Industry Trends

Market to Expand Nearly 9.7X through 2034

The global EV charger converter module market is set to expand around 9.7X through 2034, amid an 8.7% rise in estimated CAGR compared to the historical one. Rapid penetration of electrification in the automotive sector is a prominent factor expected to drive demand for EV charger converter modules.

Key Factors Propelling EV Charger Converter Module Market Growth include

  • Increasing adoption of electric vehicles as a sustainable and environmentally friendly transportation option
  • Government incentives and mandates for clean transportation
  • Expansion of charging infrastructure
  • Advancements in technology leading to improved efficiency and faster charging times
  • Growing environmental awareness among consumers

Latest EV Charger Converter Module Industry Trends

  • Rising need for faster and more efficient charging solutions
  • Growing emphasis on energy efficiency and sustainability

East Asia Remains Hub for EV Charger Converter Module Manufacturers

As per the latest analysis, East Asia is expected to retain its dominance in the global industry during the forecast period. It will likely hold around 36.4% of the global EV charger converter module market share in 2024. This is attributed to the following factors:

Government Support and Policies: East Asian countries like China, Japan, and South Korea have implemented ambitious policies and incentives to promote electric vehicles (EVs) and charging infrastructure. Substantial government investments, tax incentives, and subsidies for EV adoption and charging infrastructure development are stimulating market growth. China's "New Energy Vehicle" subsidy program, Japan's 'Electric Vehicle Road Map' initiative, and South Korea's 'Green New Deal' are prime examples of government support driving market expansion.

Technological Advancements: East Asia, particularly China, Japan, and South Korea, is renowned for its technological innovation in the automotive and electronics sectors. Continuous advancements in EV technology, including improvements in battery efficiency, charging speeds, and converter module performance, have bolstered market growth.

Rapid Urbanization and Infrastructure Development: East Asia's rapid urbanization, particularly in cities like Beijing, Tokyo, and Seoul, is increasing the need for sustainable transportation solutions. Governments and local authorities in these regions are investing heavily in building charging infrastructure, including public charging stations and fast-charging networks, to support the growing population of electric vehicles. This infrastructural development, coupled with the region's dense urban environment, creates a conducive market environment for EV charger converter modules, contributing to robust market growth in East Asia.

DC/DC Converters Witnessing Significant Demand

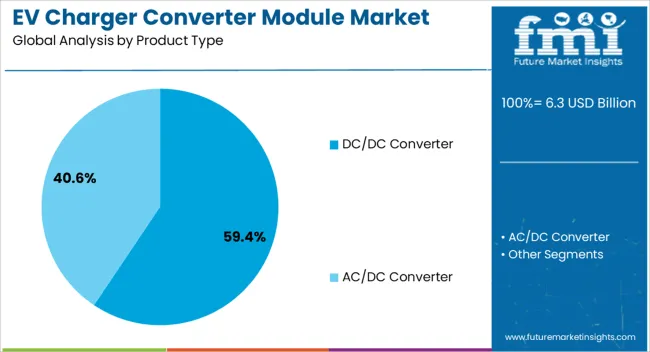
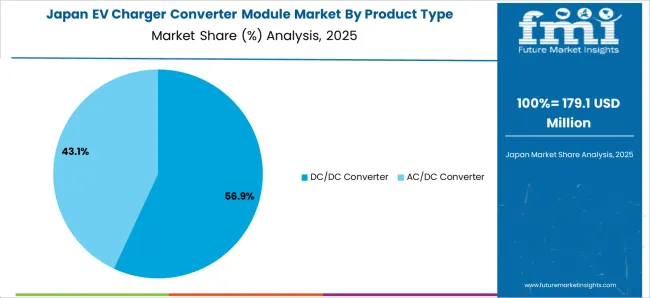
As per the report, DC/DC converter segment is expected to dominate the global EV charger converter module market with a volume share of about 61.3% in 2024. DC/DC converters are directly compatible with the DC output of electric vehicle batteries. This direct compatibility streamlines the charging process and enhances efficiency, making DC/DC converters indispensable in electric vehicle charging systems.

DC/DC converters typically exhibit higher efficiency and performance than AC/DC converters. They minimize energy losses during charging, resulting in faster charging times and reduced energy consumption, thereby attracting more users with fewer conversion stages involved.

DC/DC converters play a crucial role in fast-charging infrastructure, enabling high-power DC charging directly to the vehicle's battery. The dominance of DC/DC converters is expected to strengthen further as the demand for fast-charging solutions grows.

EV Charger Converter Module Market Overview

  • EV charger converter modules are becoming popular amid rapid transition toward electric vehicles. These converter modules are necessary components of charging systems that help efficiently convert electrical currents into energy for EV batteries.
  • There are mainly two types of EV charger converter modules: Automotive DC-DC converters and AC/DC converters. Rising demand for these products will likely foster growth of the EV charger converter module market through 2034.
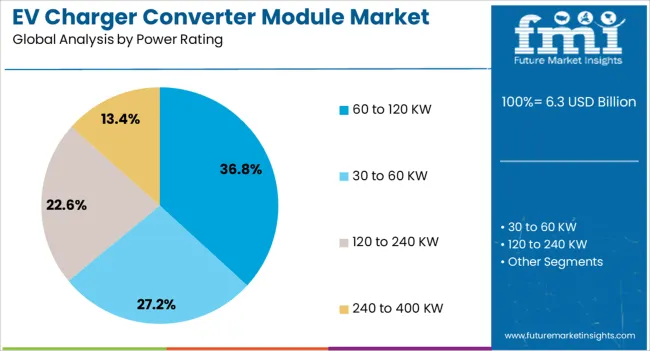
  • Availability of converter modules in different power ratings depending on their applications in residential, commercial, and public charging stations is expected to support market expansion.
  • Consumer shift toward e-mobility, government funding support as well as technological developments in charging solutions space are anticipated to fuel EV charger converter module sales.
  • There is also a rising demand for EV charger converter modules from countries interested in reducing carbon dioxide emissions and improving air quality. This will likely boost market revenue during the next ten years.
  • The projected growth in electric vehicles worldwide guarantees continued vitality for converter modules due to rising need for charging infrastructure

Comparison of Historical vs Future Outlook for EV Charger Converter Module Sales

Global sales of EV charger converter modules grew at a CAGR of 16.8% between 2019 and 2023. Total market revenue reached about USD 4,054.3 million at the end of 2023. In the forecast period, the worldwide EV charger converter module industry is set to thrive at a CAGR of 25.5%.

Historical CAGR (2019 to 2023) 16.8%
Forecast CAGR (2024 to 2034) 25.5%

The global electric vehicle charger converter module market witnessed steady growth between 2019 and 2023. This was due to gradual adoption of electric vehicles, charging infrastructure expansion, evolving regulations, and technological advancements.

Future Scope of the EV Charger Converter Module Market

Over the forecast period, the global market for EV charger converter modules is set to register stupendous growth, totaling a valuation of USD 48,605.2 million by 2034. The future scope of the EV charger converter module industry looks promising owing to increasing environmental concerns and advancements in electric vehicle technology.

As more countries and consumers embrace electric vehicles, there will be a surge in demand for charging infrastructure, including converter modules, to support the growing EV ecosystem. This is expected to foster sales growth during the assessment period.

Continued innovations in converter module technology, such as improved power electronics and advanced charging algorithms, will enhance charging efficiency and reduce charging times. The development of wireless charging technology and bidirectional charging capabilities will open up new opportunities and further propel market growth, catering to evolving consumer preferences and requirements in the electric vehicle market.

Key Factors Driving Growth in the EV Charger Converter Module Market

Innovations in Fast Charging Technology Propelling Market Growth

Innovations in fast charging technology stand out as a unique driver propelling the growth of EV charger converter module market. Fast charging technology enables rapid charging of electric vehicles, significantly reducing charging times and enhancing convenience for EV owners.

As advancements in fast charging technology continue, converter modules capable of supporting higher charging speeds and power outputs will be in high demand. This demand is driven by the increasing preference for fast charging solutions among electric vehicle users, especially for long-distance travel and urban commuting.

The development of ultrafast charging stations capable of delivering high power outputs, such as 350 kW or more, demonstrates the market's shift toward faster and more efficient charging solutions. Innovations in fast charging technology will play a crucial role in driving the growth of the EV charger converter module industry in the future.

Integration of Renewable Energy Sources to Support Market Expansion

The integration of renewable energy sources is set to support expansion of the EV charger converter module market. The synergy between electric vehicles and renewable energy becomes increasingly prominent as the world transitions toward sustainable energy solutions.

Converter modules play a vital role in managing the interface between renewable energy sources such as solar and wind power and electric vehicle charging infrastructure. They contribute to reducing carbon emissions and promoting environmental sustainability by enabling the integration of renewable energy into charging networks.

Advancements in smart grid technology facilitate dynamic energy management, optimizing the utilization of renewable energy for electric vehicle charging. This driver is expected to gain momentum as governments and organizations worldwide prioritize clean energy initiatives, resulting in a surge in demand for converter modules tailored for renewable energy integration.

Emergence of V2G (Vehicle-To-Grid) Technology Boosting Global Market

The emergence of V2G (Vehicle-to-Grid) technology presents a unique driver propelling the EV charger converter module market growth. V2G technology allows electric vehicles to not only consume energy from the grid but also to return excess energy back to the grid when needed.

Converter modules play a crucial role in enabling bidirectional power flow between electric vehicles and the grid, facilitating V2G functionality. This technology offers several benefits, including grid stabilization, peak demand management, and revenue generation for EV owners through grid services.

As V2G adoption increases, the demand for converter modules capable of supporting bidirectional power flow will grow, driving market expansion. Regulatory support and pilot projects demonstrating the feasibility and benefits of V2G technology contribute to its adoption, further fueling the growth of the EV charger converter module market.

Key Factors Restraining Growth in the EV Charger Converter Module Market

Supply Chain Disruptions

Supply chain disruptions, including material shortages, transportation challenges, and manufacturing delays, adversely affect the production and distribution of converter modules. The semiconductor shortage, in particular, impacts the availability of crucial components used in converter module manufacturing, leading to production bottlenecks and increased lead times.

The deployment of charging infrastructure, essential for electric vehicle adoption, may experience delays, hindering market growth. Automotive manufacturers have faced production cuts and delays due to semiconductor shortages, affecting the supply of electric vehicle components, including converter modules. Hence, the combination of supply chain disruptions and semiconductor shortages poses significant risks to the growth trajectory of the EV charger converter module market.

Analysis of Top Countries Producing, Formulating, Packaging, Distributing, and Using EV Charger Converter Modules

The table below shows the estimated growth rates of the top key countries. China, the United States, and Germany are set to record high CAGRs of 24.3%, 23.0%, and 21.6%, respectively, through 2034.

Countries Projected EV Charger Converter Module Market CAGR (2024 to 2034)
China 24.3%
United States 23.0%
Germany 21.6%
Japan 20.3%
India 19.2%

China to Remain the Leading Market for EV Charger Converter Module Manufacturers

As per the latest analysis, China is set to remain a lucrative market for EV charger converter module manufacturing companies. This can be attributed to booming electric vehicle sector. Sales of EV charger converter modules in China are projected to soar at a CAGR of 24.3% during the forecast period.

  • China stands at the forefront of the global electric vehicle market, with a robust infrastructure and supportive government policies driving growth. The Chinese government's subsidies, incentives, and mandates for electric vehicle adoption have spurred demand for charging infrastructure, creating abundant opportunities for manufacturers in the EV charger converter module industry.
  • Recent government initiatives, such as China's 'New Energy Vehicle' subsidy program and 'Made in China 2025' strategy, prioritize the development and adoption of electric vehicles and associated infrastructure. This will likely propel EV charger converter modules during the assessment period.
  • Factors like urbanization, rising disposable incomes, and environmental awareness fuel the demand for electric vehicles and charging infrastructure in China. This, in turn, is expected to positively impact EV charger converter module sales, offering lucrative opportunities for manufacturers to capitalize on the growing demand.

Increasing Electric Vehicle Adoption Fueling Demand in the United States

The United States EV charger converter module market is poised to exhibit steady growth, with overall demand rising at 23.0% CAGR. This is attributable to rising adoption of electric and hybrid vehicles in the nation.

  • Rising EV ownership triggered by factors like government incentives, increasing environmental concerns, and declining battery costs is expected to boost the growth of the EV charger converter industry in the United States.
  • When it comes to electric vehicle adoption, the United States leads from the forefront. The nation is witnessing high adoption of EVs, creating a need for charging infrastructure, including converter modules within charging stations.
  • As more consumers switch to electric vehicles, there is a growing need for EV charger converter modules, presenting abundant opportunities for manufacturers in the United States.
  • Government initiatives and infrastructure investments further bolster the United States’ position as a promising market for EV charger converter modules. Federal and state level incentives, tax credits for electric vehicle purchases, and funding for charging infrastructure expansion encourage electric vehicle adoption and support the development of charging technologies.
  • Strong presence of electric vehicle giants like Tesla is expected to improve the United States’ EV charger converter module market share through 2034.

India Poised to Offer Abundant Opportunities for Module Manufacturers

The EV charger converter module market in India is poised to thrive at a robust CAGR of 19.2% throughout the forecast period. It will likely hold a significant share of the South Asia Pacific industry by 2034.

  • India's EV charger converter module market is experiencing rapid growth, driven by several key factors. One such factor is the increasing government initiatives to promote electric mobility, including subsidies, incentives, and infrastructure development.
  • With high adoption of electric vehicles, the consumption of converter modules is increasing rapidly across India. The nation's focus on reducing carbon emissions and transitioning to cleaner transportation options further accelerates market growth.
  • India's growing urban population, rising disposable incomes, and improving charging infrastructure contribute to the surge in demand for electric vehicles and associated charging solutions, including charger converter modules.
  • As electric vehicle adoption continues to rise, particularly in densely populated urban areas, India is poised to become a leading consumer of EV charger converter modules in the near future.

Growing Demand for Electric Vehicles Boosting Japan’s Market

Japan’s EV charger converter module market is projected to rise at 20.3% CAGR during the forecast period. This can be attributed to rising popularity of electric mobility in the country and favorable government support.

  • In Japan, the consumption of EV charger converter modules is on the rise due to several factors. The country's strong automotive industry and technological innovation contribute to the increasing adoption of electric vehicles (EVs) and associated charging infrastructure. Japan's commitment to reducing carbon emissions and promoting sustainable transportation further drives market growth.
  • Government incentives, such as subsidies for EV purchases and investments in charging infrastructure, encourage consumer adoption of EVs. Japan is embracing electric mobility, making it a leading consumer of EV charger converter modules.
  • As the demand for EVs continues to grow, Japan's market for converter modules is expected to expand further, offering significant opportunities for manufacturers and stakeholders in the EV charger converter module sector.

EV Charger Converter Module Industry Analysis by Top Investment Segments

The section below shows the DC/DC converter segment leading the EV charger converter module industry. It is projected to thrive at 21.5% CAGR during the forecast period. Based on end-users, the commercial segment will likely exhibit a CAGR of 23.1% through 2034.

DC/DC Converter Modules Remain Highly Sought-after Products in the Market

Top Segment (Product Type) DC/DC Converter
Predicted CAGR (2024 to 2034) 21.5%

Based on product type, the global electric vehicle (EV) charger converter module market is segmented into DC/DC converter and AC/DC converter. Among these, demand is expected to remain high for DC/DC converter modules.

As per the latest analysis, the DC/DC converter segment is expected to grow at a CAGR of 21.5% during the forecast period. Hence, it will continue to remain a key revenue-generation category in the market.

  • The DC/DC converter segment holds the highest share in the EV charger converter module market due to several factors like direct compatibility with electric vehicle (EV) batteries, streamlining the charging process, and enhancing efficiency.
  • DC/DC converters typically exhibit higher efficiency and performance compared to AC/DC converters, resulting in faster charging times and reduced energy consumption.
  • In fast charging applications, DC/DC converters are preferred for their ability to deliver high power outputs directly to the EV battery, facilitating rapid charging.
  • With electric vehicles becoming more sophisticated, demand for efficient and reliable power conversion is expected to increase significantly. This will likely fuel demand for DC/DC converter modules.
  • Rising importance of DC/DC converters in other applications like voltage regulations and maintaining constant power supply will also fuel their demand.

Commercial Segment Set to Retain its Market Dominance through 2034

Top Segment (End-user) Commercial
Projected CAGR (2024 to 2034) 23.1%

As per the latest report, the commercial segment will likely maintain its leading position during the forecast period. It is anticipated to grow at a CAGR of 23.1% from 2024 to 2034. This can be attributed to several factors.
  • Commercial entities like charging station companies, fleet operators, and public transportation authorities are early adopters of EVs. This, in turn, is expected to drive demand for EV charger converter modules in the commercial segment.
  • Commercial charging stations utilize fast chargers, which require converter modules, thereby driving their demand.
  • Rising focus on grid stability and power management in commercial charging stations will likely boost segment growth through 2034.
  • Businesses are motivated by the growing demand for electric vehicle charging services, particularly as more companies transition their fleets to electric. Commercial establishments can leverage charging infrastructure to attract customers, enhance their brand image, and comply with sustainability goals.
  • Commercial charging stations are often strategically located in high-traffic areas, making them accessible to a wide range of users, including employees, customers, and the general public.

Competitive Landscape of the EV Charger Converter Module Market

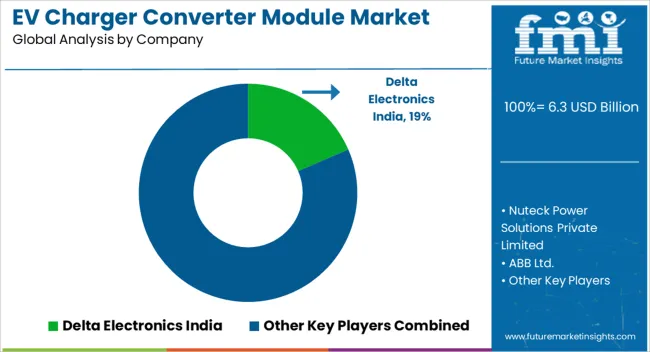
The global market for EV charger converter modules is fragmented, with leading players accounting for about 30% to 35% of the share. Nuteck Power Solutions Private Limited, Delta Electronics India, ABB Ltd., Shenzhen Mida EV Power Co., Ltd., Dana Limited, Axiom Energy Conversion, Siemens AG, Infineon Technologies AG, Robert Bosch GmbH, Toyota Industries Corporation, Denso Corporation, Shenzhen Infypower Co., Ltd., Mass-Tech, BHEL, and Phoenix Contact India Pvt. Ltd. leading manufacturers of EV charger converter modules listed in the report.

Key EV charger converter module companies are heavily investing in research and development to create innovative EV charger converter modules. They are also implementing strategies like facility expansions, acquisitions, distribution agreements, partnerships, and mergers to strengthen their footprint.

Recent Developments in EV Charger Converter Module Market

  • In 2022, Hitachi Energy introduced RoadPak, a game-changing power semiconductor module for EVs. The new high-performance power electronics are expected to take e-mobility to the next level.
  • In December 2023, BorgWarner Inc. completed acquisition of Eldor Corporation’s Electric Hybrid Systems business segment, enhancing its product portfolio and expanding into high-voltage power electronics.
  • In November 2023, EG Group secured a deal to acquire Tesla's ultra-fast charging units for its evpoint business in the United Kingdom and Europe.
  • In May 2023, Siemens AG announced the acquisition of Mass-Tech Controls' EV division, enhancing its e Mobility offerings in India. The acquisition aims to meet the surging demand for EV charging infrastructure, expanding Siemens' local market presence and potentially creating an export hub.

Key Coverage in the Global EV Charger Converter Module Market Report

  • Adjacent Study on Global EV Charging Infrastructure Module Market, Electric Vehicle Charging System Module Market, and EV Charger Converter Unit Market
  • Latest Electric Vehicle Charger Power Module Market Trends
  • List of Top EV Charging Solution Providers in India
  • Growth Prospects for Electric Vehicle Charger Module Market
  • Expected EV Charger Module Market Size
  • Top Players in the Electric Vehicle Charging Module Market
  • Drivers for EV Charging Station Converter Market
  • Power Module for EV Charger Market Opportunities
  • Global Power Module for EV Charger Market
  • EV Charger Module Manufacturers in China, Japan, and other Countries
  • Current Automotive Power Modules Market Size
  • Popular Energy-efficient Converters for Electric Vehicle Charging Stations
  • Detailed Analysis of the Shifting Currents of the Electric Vehicle Charging Market

Scope and Coverage of the EV Charger Converter Module Market

Attribute Details
Estimated Market Size (2024) USD 5,019.0 million
Projected Market Size (2034) USD 48,605.2 million
Anticipated Growth Rate (2024 to 2034) 25.5%
Historical Data 2019 to 2023
Forecast Period 2024 to 2034
Quantitative Units Value (USD million) and Volume (unit)
Report Coverage Revenue Forecast, Volume Forecast, Company Ranking, Competitive Landscape, Growth Factors, Trends, and Pricing Analysis
Market Segments Covered Product Type, Power Rating, End-user, Region
Regions Covered North America; Latin America; Western Europe; Eastern Europe; East Asia; South Asia Pacific; Middle East & Africa
Key Countries Covered United States, Canada, Mexico, Brazil, Chile, Germany, Italy, France, United Kingdom, Spain, BENELUX, NORDICS, Russia, Poland, Hungary, Balkan and Baltics, India, Association of Southeast Asian Nations, Australia and New Zealand, China, Japan, South Korea, Kingdom of Saudi Arabia, Other GCC Countries, Turkiye, South Africa, Other African Union
Key Companies Profiled Nuteck Power Solutions Private Limited; Delta Electronics India; ABB Ltd.; Shenzhen Mida EV Power Co., Ltd.;  Dana Limited; Axiom Energy Conversion; Siemens Ag; Infineon Technologies Ag; Robert Bosch GmbH; Toyota Industries Corporation; Denso Corporation; Shenzhen Infypower Co., Ltd.; Mass-Tech; BHEL; PHOENIX Contact India Pvt. Ltd.

Top Segments Studied in the EV Charger Converter Module Market

By Product Type:

  • DC/DC Converter
  • AC/DC Converter

By Power Rating:

  • 30 to 60 kW
  • 60 to 120 kW
  • 120 to 240 kW
  • 240 to 400 kW

By End-user:

  • Residential
  • Commercial
  • Public

By Region:

  • North America
  • Latin America
  • Western Europe
  • Eastern Europe
  • East Asia
  • South Asia Pacific
  • Middle East & Africa

Table of Content

  • 1. Executive Summary
  • 2. Market Overview
  • 3. Key Market Trends
  • 4. Key Success Factors
  • 5. Global Market Demand Analysis 2019 to 2023 and Forecast, 2024 to 2034
  • 6. Global Market - Pricing Analysis
  • 7. Global Market Demand (in Value or Size in USD million) Analysis 2019 to 2023 and Forecast, 2024 to 2034
  • 8. Market Background
  • 9. Global Market Analysis 2019 to 2023 and Forecast 2024 to 2034, By Product Type
    • 9.1. DC/DC Converter
    • 9.2. AC/DC Converter
  • 10. Global Market Analysis 2019 to 2023 and Forecast 2024 to 2034, By Power Rating
    • 10.1. 30 to 60 kW
    • 10.2. 60 to 120 kW
    • 10.3. 120 to 240 kW
    • 10.4. 240 to 400 kW
  • 11. Global Market Analysis 2019 to 2023 and Forecast 2024 to 2034, By End User
    • 11.1. Residential
    • 11.2. Commercial
    • 11.3. Public
  • 12. Global Market Analysis 2019 to 2023 and Forecast 2024 to 2034, By Region
    • 12.1. North America
    • 12.2. Latin America
    • 12.3. East Asia
    • 12.4. South Asia Pacific
    • 12.5. Western Europe
    • 12.6. Eastern Europe
    • 12.7. Middle East and Africa
  • 13. North America Market Analysis 2019 to 2023 and Forecast 2024 to 2034
  • 14. Latin America Market Analysis 2019 to 2023 and Forecast 2024 to 2034
  • 15. East Asia Market Analysis 2019 to 2023 and Forecast 2024 to 2034
  • 16. South Asia Pacific Market Analysis 2019 to 2023 and Forecast 2024 to 2034
  • 17. Western Europe Market Analysis 2019 to 2023 and Forecast 2024 to 2034
  • 18. Eastern Europe Market Analysis 2019 to 2023 and Forecast 2024 to 2034
  • 19. Middle East and Africa Market Analysis 2019 to 2023 and Forecast 2024 to 2034
  • 20. Country-wise Market Analysis
  • 21. Market Structure Analysis
  • 22. Competition Analysis
    • 22.1. Robert Bosch GmbH
    • 22.2. Nuteck Power Solutions Private Limited
    • 22.3. Delta Electronics India
    • 22.4. ABB Ltd.
    • 22.5. Shenzhen Mida EV Power Co., Ltd.
    • 22.6. Dana Limited
    • 22.7. Axiom Energy Conversion
    • 22.8. Siemens Ag
    • 22.9. Infineon Technologies Ag
    • 22.10. Toyota Industries Corporation
    • 22.11. Denso Corporation
    • 22.12. Shenzhen Infypower Co., Ltd.
    • 22.13. Mass-Tech
    • 22.14. BHEL
    • 22.15. PHOENIX CONTACT India Pvt. Ltd.
    • 22.16. Other Key Players
  • 23. Primary Insights
  • 24. Assumptions and Acronyms Used
  • 25. Research Methodology

List of Tables

Table 1: Global Market Value (US$ million) Forecast by Region, 2019 to 2034

Table 2: Global Market Volume (tons) Forecast by Region, 2019 to 2034

Table 3: Global Market Value (US$ million) Forecast by Product Type, 2019 to 2034

Table 4: Global Market Volume (tons) Forecast by Product Type, 2019 to 2034

Table 5: Global Market Value (US$ million) Forecast by Power Rating, 2019 to 2034

Table 6: Global Market Volume (tons) Forecast by Power Rating, 2019 to 2034

Table 7: Global Market Value (US$ million) Forecast by End User, 2019 to 2034

Table 8: Global Market Volume (tons) Forecast by End User, 2019 to 2034

Table 9: North America Market Value (US$ million) Forecast by Country, 2019 to 2034

Table 10: North America Market Volume (tons) Forecast by Country, 2019 to 2034

Table 11: North America Market Value (US$ million) Forecast by Product Type, 2019 to 2034

Table 12: North America Market Volume (tons) Forecast by Product Type, 2019 to 2034

Table 13: North America Market Value (US$ million) Forecast by Power Rating, 2019 to 2034

Table 14: North America Market Volume (tons) Forecast by Power Rating, 2019 to 2034

Table 15: North America Market Value (US$ million) Forecast by End User, 2019 to 2034

Table 16: North America Market Volume (tons) Forecast by End User, 2019 to 2034

Table 17: Latin America Market Value (US$ million) Forecast by Country, 2019 to 2034

Table 18: Latin America Market Volume (tons) Forecast by Country, 2019 to 2034

Table 19: Latin America Market Value (US$ million) Forecast by Product Type, 2019 to 2034

Table 20: Latin America Market Volume (tons) Forecast by Product Type, 2019 to 2034

Table 21: Latin America Market Value (US$ million) Forecast by Power Rating, 2019 to 2034

Table 22: Latin America Market Volume (tons) Forecast by Power Rating, 2019 to 2034

Table 23: Latin America Market Value (US$ million) Forecast by End User, 2019 to 2034

Table 24: Latin America Market Volume (tons) Forecast by End User, 2019 to 2034

Table 25: Western Europe Market Value (US$ million) Forecast by Country, 2019 to 2034

Table 26: Western Europe Market Volume (tons) Forecast by Country, 2019 to 2034

Table 27: Western Europe Market Value (US$ million) Forecast by Product Type, 2019 to 2034

Table 28: Western Europe Market Volume (tons) Forecast by Product Type, 2019 to 2034

Table 29: Western Europe Market Value (US$ million) Forecast by Power Rating, 2019 to 2034

Table 30: Western Europe Market Volume (tons) Forecast by Power Rating, 2019 to 2034

Table 31: Western Europe Market Value (US$ million) Forecast by End User, 2019 to 2034

Table 32: Western Europe Market Volume (tons) Forecast by End User, 2019 to 2034

Table 33: Eastern Europe Market Value (US$ million) Forecast by Country, 2019 to 2034

Table 34: Eastern Europe Market Volume (tons) Forecast by Country, 2019 to 2034

Table 35: Eastern Europe Market Value (US$ million) Forecast by Product Type, 2019 to 2034

Table 36: Eastern Europe Market Volume (tons) Forecast by Product Type, 2019 to 2034

Table 37: Eastern Europe Market Value (US$ million) Forecast by Power Rating, 2019 to 2034

Table 38: Eastern Europe Market Volume (tons) Forecast by Power Rating, 2019 to 2034

Table 39: Eastern Europe Market Value (US$ million) Forecast by End User, 2019 to 2034

Table 40: Eastern Europe Market Volume (tons) Forecast by End User, 2019 to 2034

Table 41: East Asia Market Value (US$ million) Forecast by Country, 2019 to 2034

Table 42: East Asia Market Volume (tons) Forecast by Country, 2019 to 2034

Table 43: East Asia Market Value (US$ million) Forecast by Product Type, 2019 to 2034

Table 44: East Asia Market Volume (tons) Forecast by Product Type, 2019 to 2034

Table 45: East Asia Market Value (US$ million) Forecast by Power Rating, 2019 to 2034

Table 46: East Asia Market Volume (tons) Forecast by Power Rating, 2019 to 2034

Table 47: East Asia Market Value (US$ million) Forecast by End User, 2019 to 2034

Table 48: East Asia Market Volume (tons) Forecast by End User, 2019 to 2034

Table 49: South Asia Pacific Market Value (US$ million) Forecast by Country, 2019 to 2034

Table 50: South Asia Pacific Market Volume (tons) Forecast by Country, 2019 to 2034

Table 51: South Asia Pacific Market Value (US$ million) Forecast by Product Type, 2019 to 2034

Table 52: South Asia Pacific Market Volume (tons) Forecast by Product Type, 2019 to 2034

Table 53: South Asia Pacific Market Value (US$ million) Forecast by Power Rating, 2019 to 2034

Table 54: South Asia Pacific Market Volume (tons) Forecast by Power Rating, 2019 to 2034

Table 55: South Asia Pacific Market Value (US$ million) Forecast by End User, 2019 to 2034

Table 56: South Asia Pacific Market Volume (tons) Forecast by End User, 2019 to 2034

Table 57: Middle East & Africa Market Value (US$ million) Forecast by Country, 2019 to 2034

Table 58: Middle East & Africa Market Volume (tons) Forecast by Country, 2019 to 2034

Table 59: Middle East & Africa Market Value (US$ million) Forecast by Product Type, 2019 to 2034

Table 60: Middle East & Africa Market Volume (tons) Forecast by Product Type, 2019 to 2034

Table 61: Middle East & Africa Market Value (US$ million) Forecast by Power Rating, 2019 to 2034

Table 62: Middle East & Africa Market Volume (tons) Forecast by Power Rating, 2019 to 2034

Table 63: Middle East & Africa Market Value (US$ million) Forecast by End User, 2019 to 2034

Table 64: Middle East & Africa Market Volume (tons) Forecast by End User, 2019 to 2034

List of Figures

Figure 1: Global Market Value (US$ million) by Product Type, 2024 to 2034

Figure 2: Global Market Value (US$ million) by Power Rating, 2024 to 2034

Figure 3: Global Market Value (US$ million) by End User, 2024 to 2034

Figure 4: Global Market Value (US$ million) by Region, 2024 to 2034

Figure 5: Global Market Value (US$ million) Analysis by Region, 2019 to 2034

Figure 6: Global Market Volume (tons) Analysis by Region, 2019 to 2034

Figure 7: Global Market Value Share (%) and BPS Analysis by Region, 2024 to 2034

Figure 8: Global Market Y-o-Y Growth (%) Projections by Region, 2024 to 2034

Figure 9: Global Market Value (US$ million) Analysis by Product Type, 2019 to 2034

Figure 10: Global Market Volume (tons) Analysis by Product Type, 2019 to 2034

Figure 11: Global Market Value Share (%) and BPS Analysis by Product Type, 2024 to 2034

Figure 12: Global Market Y-o-Y Growth (%) Projections by Product Type, 2024 to 2034

Figure 13: Global Market Value (US$ million) Analysis by Power Rating, 2019 to 2034

Figure 14: Global Market Volume (tons) Analysis by Power Rating, 2019 to 2034

Figure 15: Global Market Value Share (%) and BPS Analysis by Power Rating, 2024 to 2034

Figure 16: Global Market Y-o-Y Growth (%) Projections by Power Rating, 2024 to 2034

Figure 17: Global Market Value (US$ million) Analysis by End User, 2019 to 2034

Figure 18: Global Market Volume (tons) Analysis by End User, 2019 to 2034

Figure 19: Global Market Value Share (%) and BPS Analysis by End User, 2024 to 2034

Figure 20: Global Market Y-o-Y Growth (%) Projections by End User, 2024 to 2034

Figure 21: Global Market Attractiveness by Product Type, 2024 to 2034

Figure 22: Global Market Attractiveness by Power Rating, 2024 to 2034

Figure 23: Global Market Attractiveness by End User, 2024 to 2034

Figure 24: Global Market Attractiveness by Region, 2024 to 2034

Figure 25: North America Market Value (US$ million) by Product Type, 2024 to 2034

Figure 26: North America Market Value (US$ million) by Power Rating, 2024 to 2034

Figure 27: North America Market Value (US$ million) by End User, 2024 to 2034

Figure 28: North America Market Value (US$ million) by Country, 2024 to 2034

Figure 29: North America Market Value (US$ million) Analysis by Country, 2019 to 2034

Figure 30: North America Market Volume (tons) Analysis by Country, 2019 to 2034

Figure 31: North America Market Value Share (%) and BPS Analysis by Country, 2024 to 2034

Figure 32: North America Market Y-o-Y Growth (%) Projections by Country, 2024 to 2034

Figure 33: North America Market Value (US$ million) Analysis by Product Type, 2019 to 2034

Figure 34: North America Market Volume (tons) Analysis by Product Type, 2019 to 2034

Figure 35: North America Market Value Share (%) and BPS Analysis by Product Type, 2024 to 2034

Figure 36: North America Market Y-o-Y Growth (%) Projections by Product Type, 2024 to 2034

Figure 37: North America Market Value (US$ million) Analysis by Power Rating, 2019 to 2034

Figure 38: North America Market Volume (tons) Analysis by Power Rating, 2019 to 2034

Figure 39: North America Market Value Share (%) and BPS Analysis by Power Rating, 2024 to 2034

Figure 40: North America Market Y-o-Y Growth (%) Projections by Power Rating, 2024 to 2034

Figure 41: North America Market Value (US$ million) Analysis by End User, 2019 to 2034

Figure 42: North America Market Volume (tons) Analysis by End User, 2019 to 2034

Figure 43: North America Market Value Share (%) and BPS Analysis by End User, 2024 to 2034

Figure 44: North America Market Y-o-Y Growth (%) Projections by End User, 2024 to 2034

Figure 45: North America Market Attractiveness by Product Type, 2024 to 2034

Figure 46: North America Market Attractiveness by Power Rating, 2024 to 2034

Figure 47: North America Market Attractiveness by End User, 2024 to 2034

Figure 48: North America Market Attractiveness by Country, 2024 to 2034

Figure 49: Latin America Market Value (US$ million) by Product Type, 2024 to 2034

Figure 50: Latin America Market Value (US$ million) by Power Rating, 2024 to 2034

Figure 51: Latin America Market Value (US$ million) by End User, 2024 to 2034

Figure 52: Latin America Market Value (US$ million) by Country, 2024 to 2034

Figure 53: Latin America Market Value (US$ million) Analysis by Country, 2019 to 2034

Figure 54: Latin America Market Volume (tons) Analysis by Country, 2019 to 2034

Figure 55: Latin America Market Value Share (%) and BPS Analysis by Country, 2024 to 2034

Figure 56: Latin America Market Y-o-Y Growth (%) Projections by Country, 2024 to 2034

Figure 57: Latin America Market Value (US$ million) Analysis by Product Type, 2019 to 2034

Figure 58: Latin America Market Volume (tons) Analysis by Product Type, 2019 to 2034

Figure 59: Latin America Market Value Share (%) and BPS Analysis by Product Type, 2024 to 2034

Figure 60: Latin America Market Y-o-Y Growth (%) Projections by Product Type, 2024 to 2034

Figure 61: Latin America Market Value (US$ million) Analysis by Power Rating, 2019 to 2034

Figure 62: Latin America Market Volume (tons) Analysis by Power Rating, 2019 to 2034

Figure 63: Latin America Market Value Share (%) and BPS Analysis by Power Rating, 2024 to 2034

Figure 64: Latin America Market Y-o-Y Growth (%) Projections by Power Rating, 2024 to 2034

Figure 65: Latin America Market Value (US$ million) Analysis by End User, 2019 to 2034

Figure 66: Latin America Market Volume (tons) Analysis by End User, 2019 to 2034

Figure 67: Latin America Market Value Share (%) and BPS Analysis by End User, 2024 to 2034

Figure 68: Latin America Market Y-o-Y Growth (%) Projections by End User, 2024 to 2034

Figure 69: Latin America Market Attractiveness by Product Type, 2024 to 2034

Figure 70: Latin America Market Attractiveness by Power Rating, 2024 to 2034

Figure 71: Latin America Market Attractiveness by End User, 2024 to 2034

Figure 72: Latin America Market Attractiveness by Country, 2024 to 2034

Figure 73: Western Europe Market Value (US$ million) by Product Type, 2024 to 2034

Figure 74: Western Europe Market Value (US$ million) by Power Rating, 2024 to 2034

Figure 75: Western Europe Market Value (US$ million) by End User, 2024 to 2034

Figure 76: Western Europe Market Value (US$ million) by Country, 2024 to 2034

Figure 77: Western Europe Market Value (US$ million) Analysis by Country, 2019 to 2034

Figure 78: Western Europe Market Volume (tons) Analysis by Country, 2019 to 2034

Figure 79: Western Europe Market Value Share (%) and BPS Analysis by Country, 2024 to 2034

Figure 80: Western Europe Market Y-o-Y Growth (%) Projections by Country, 2024 to 2034

Figure 81: Western Europe Market Value (US$ million) Analysis by Product Type, 2019 to 2034

Figure 82: Western Europe Market Volume (tons) Analysis by Product Type, 2019 to 2034

Figure 83: Western Europe Market Value Share (%) and BPS Analysis by Product Type, 2024 to 2034

Figure 84: Western Europe Market Y-o-Y Growth (%) Projections by Product Type, 2024 to 2034

Figure 85: Western Europe Market Value (US$ million) Analysis by Power Rating, 2019 to 2034

Figure 86: Western Europe Market Volume (tons) Analysis by Power Rating, 2019 to 2034

Figure 87: Western Europe Market Value Share (%) and BPS Analysis by Power Rating, 2024 to 2034

Figure 88: Western Europe Market Y-o-Y Growth (%) Projections by Power Rating, 2024 to 2034

Figure 89: Western Europe Market Value (US$ million) Analysis by End User, 2019 to 2034

Figure 90: Western Europe Market Volume (tons) Analysis by End User, 2019 to 2034

Figure 91: Western Europe Market Value Share (%) and BPS Analysis by End User, 2024 to 2034

Figure 92: Western Europe Market Y-o-Y Growth (%) Projections by End User, 2024 to 2034

Figure 93: Western Europe Market Attractiveness by Product Type, 2024 to 2034

Figure 94: Western Europe Market Attractiveness by Power Rating, 2024 to 2034

Figure 95: Western Europe Market Attractiveness by End User, 2024 to 2034

Figure 96: Western Europe Market Attractiveness by Country, 2024 to 2034

Figure 97: Eastern Europe Market Value (US$ million) by Product Type, 2024 to 2034

Figure 98: Eastern Europe Market Value (US$ million) by Power Rating, 2024 to 2034

Figure 99: Eastern Europe Market Value (US$ million) by End User, 2024 to 2034

Figure 100: Eastern Europe Market Value (US$ million) by Country, 2024 to 2034

Figure 101: Eastern Europe Market Value (US$ million) Analysis by Country, 2019 to 2034

Figure 102: Eastern Europe Market Volume (tons) Analysis by Country, 2019 to 2034

Figure 103: Eastern Europe Market Value Share (%) and BPS Analysis by Country, 2024 to 2034

Figure 104: Eastern Europe Market Y-o-Y Growth (%) Projections by Country, 2024 to 2034

Figure 105: Eastern Europe Market Value (US$ million) Analysis by Product Type, 2019 to 2034

Figure 106: Eastern Europe Market Volume (tons) Analysis by Product Type, 2019 to 2034

Figure 107: Eastern Europe Market Value Share (%) and BPS Analysis by Product Type, 2024 to 2034

Figure 108: Eastern Europe Market Y-o-Y Growth (%) Projections by Product Type, 2024 to 2034

Figure 109: Eastern Europe Market Value (US$ million) Analysis by Power Rating, 2019 to 2034

Figure 110: Eastern Europe Market Volume (tons) Analysis by Power Rating, 2019 to 2034

Figure 111: Eastern Europe Market Value Share (%) and BPS Analysis by Power Rating, 2024 to 2034

Figure 112: Eastern Europe Market Y-o-Y Growth (%) Projections by Power Rating, 2024 to 2034

Figure 113: Eastern Europe Market Value (US$ million) Analysis by End User, 2019 to 2034

Figure 114: Eastern Europe Market Volume (tons) Analysis by End User, 2019 to 2034

Figure 115: Eastern Europe Market Value Share (%) and BPS Analysis by End User, 2024 to 2034

Figure 116: Eastern Europe Market Y-o-Y Growth (%) Projections by End User, 2024 to 2034

Figure 117: Eastern Europe Market Attractiveness by Product Type, 2024 to 2034

Figure 118: Eastern Europe Market Attractiveness by Power Rating, 2024 to 2034

Figure 119: Eastern Europe Market Attractiveness by End User, 2024 to 2034

Figure 120: Eastern Europe Market Attractiveness by Country, 2024 to 2034

Figure 121: East Asia Market Value (US$ million) by Product Type, 2024 to 2034

Figure 122: East Asia Market Value (US$ million) by Power Rating, 2024 to 2034

Figure 123: East Asia Market Value (US$ million) by End User, 2024 to 2034

Figure 124: East Asia Market Value (US$ million) by Country, 2024 to 2034

Figure 125: East Asia Market Value (US$ million) Analysis by Country, 2019 to 2034

Figure 126: East Asia Market Volume (tons) Analysis by Country, 2019 to 2034

Figure 127: East Asia Market Value Share (%) and BPS Analysis by Country, 2024 to 2034

Figure 128: East Asia Market Y-o-Y Growth (%) Projections by Country, 2024 to 2034

Figure 129: East Asia Market Value (US$ million) Analysis by Product Type, 2019 to 2034

Figure 130: East Asia Market Volume (tons) Analysis by Product Type, 2019 to 2034

Figure 131: East Asia Market Value Share (%) and BPS Analysis by Product Type, 2024 to 2034

Figure 132: East Asia Market Y-o-Y Growth (%) Projections by Product Type, 2024 to 2034

Figure 133: East Asia Market Value (US$ million) Analysis by Power Rating, 2019 to 2034

Figure 134: East Asia Market Volume (tons) Analysis by Power Rating, 2019 to 2034

Figure 135: East Asia Market Value Share (%) and BPS Analysis by Power Rating, 2024 to 2034

Figure 136: East Asia Market Y-o-Y Growth (%) Projections by Power Rating, 2024 to 2034

Figure 137: East Asia Market Value (US$ million) Analysis by End User, 2019 to 2034

Figure 138: East Asia Market Volume (tons) Analysis by End User, 2019 to 2034

Figure 139: East Asia Market Value Share (%) and BPS Analysis by End User, 2024 to 2034

Figure 140: East Asia Market Y-o-Y Growth (%) Projections by End User, 2024 to 2034

Figure 141: East Asia Market Attractiveness by Product Type, 2024 to 2034

Figure 142: East Asia Market Attractiveness by Power Rating, 2024 to 2034

Figure 143: East Asia Market Attractiveness by End User, 2024 to 2034

Figure 144: East Asia Market Attractiveness by Country, 2024 to 2034

Figure 145: South Asia Pacific Market Value (US$ million) by Product Type, 2024 to 2034

Figure 146: South Asia Pacific Market Value (US$ million) by Power Rating, 2024 to 2034

Figure 147: South Asia Pacific Market Value (US$ million) by End User, 2024 to 2034

Figure 148: South Asia Pacific Market Value (US$ million) by Country, 2024 to 2034

Figure 149: South Asia Pacific Market Value (US$ million) Analysis by Country, 2019 to 2034

Figure 150: South Asia Pacific Market Volume (tons) Analysis by Country, 2019 to 2034

Figure 151: South Asia Pacific Market Value Share (%) and BPS Analysis by Country, 2024 to 2034

Figure 152: South Asia Pacific Market Y-o-Y Growth (%) Projections by Country, 2024 to 2034

Figure 153: South Asia Pacific Market Value (US$ million) Analysis by Product Type, 2019 to 2034

Figure 154: South Asia Pacific Market Volume (tons) Analysis by Product Type, 2019 to 2034

Figure 155: South Asia Pacific Market Value Share (%) and BPS Analysis by Product Type, 2024 to 2034

Figure 156: South Asia Pacific Market Y-o-Y Growth (%) Projections by Product Type, 2024 to 2034

Figure 157: South Asia Pacific Market Value (US$ million) Analysis by Power Rating, 2019 to 2034

Figure 158: South Asia Pacific Market Volume (tons) Analysis by Power Rating, 2019 to 2034

Figure 159: South Asia Pacific Market Value Share (%) and BPS Analysis by Power Rating, 2024 to 2034

Figure 160: South Asia Pacific Market Y-o-Y Growth (%) Projections by Power Rating, 2024 to 2034

Figure 161: South Asia Pacific Market Value (US$ million) Analysis by End User, 2019 to 2034

Figure 162: South Asia Pacific Market Volume (tons) Analysis by End User, 2019 to 2034

Figure 163: South Asia Pacific Market Value Share (%) and BPS Analysis by End User, 2024 to 2034

Figure 164: South Asia Pacific Market Y-o-Y Growth (%) Projections by End User, 2024 to 2034

Figure 165: South Asia Pacific Market Attractiveness by Product Type, 2024 to 2034

Figure 166: South Asia Pacific Market Attractiveness by Power Rating, 2024 to 2034

Figure 167: South Asia Pacific Market Attractiveness by End User, 2024 to 2034

Figure 168: South Asia Pacific Market Attractiveness by Country, 2024 to 2034

Figure 169: Middle East & Africa Market Value (US$ million) by Product Type, 2024 to 2034

Figure 170: Middle East & Africa Market Value (US$ million) by Power Rating, 2024 to 2034

Figure 171: Middle East & Africa Market Value (US$ million) by End User, 2024 to 2034

Figure 172: Middle East & Africa Market Value (US$ million) by Country, 2024 to 2034

Figure 173: Middle East & Africa Market Value (US$ million) Analysis by Country, 2019 to 2034

Figure 174: Middle East & Africa Market Volume (tons) Analysis by Country, 2019 to 2034

Figure 175: Middle East & Africa Market Value Share (%) and BPS Analysis by Country, 2024 to 2034

Figure 176: Middle East & Africa Market Y-o-Y Growth (%) Projections by Country, 2024 to 2034

Figure 177: Middle East & Africa Market Value (US$ million) Analysis by Product Type, 2019 to 2034

Figure 178: Middle East & Africa Market Volume (tons) Analysis by Product Type, 2019 to 2034

Figure 179: Middle East & Africa Market Value Share (%) and BPS Analysis by Product Type, 2024 to 2034

Figure 180: Middle East & Africa Market Y-o-Y Growth (%) Projections by Product Type, 2024 to 2034

Figure 181: Middle East & Africa Market Value (US$ million) Analysis by Power Rating, 2019 to 2034

Figure 182: Middle East & Africa Market Volume (tons) Analysis by Power Rating, 2019 to 2034

Figure 183: Middle East & Africa Market Value Share (%) and BPS Analysis by Power Rating, 2024 to 2034

Figure 184: Middle East & Africa Market Y-o-Y Growth (%) Projections by Power Rating, 2024 to 2034

Figure 185: Middle East & Africa Market Value (US$ million) Analysis by End User, 2019 to 2034

Figure 186: Middle East & Africa Market Volume (tons) Analysis by End User, 2019 to 2034

Figure 187: Middle East & Africa Market Value Share (%) and BPS Analysis by End User, 2024 to 2034

Figure 188: Middle East & Africa Market Y-o-Y Growth (%) Projections by End User, 2024 to 2034

Figure 189: Middle East & Africa Market Attractiveness by Product Type, 2024 to 2034

Figure 190: Middle East & Africa Market Attractiveness by Power Rating, 2024 to 2034

Figure 191: Middle East & Africa Market Attractiveness by End User, 2024 to 2034

Figure 192: Middle East & Africa Market Attractiveness by Country, 2024 to 2034

Frequently Asked Questions

How big is the EV charger converter module market?

The global market value is estimated to reach USD 5,019.0 million in 2024.

At what rate will the global demand rise through 2034?

Global EV charger converter module demand is anticipated to rise at 25.5% CAGR.

What is the expected market size in 2034?

The global EV charger converter module market size is set to reach USD 48,605.2 million by 2034.

Which product type segment is expected to lead the market?

DC/DC converter segment is expected to lead the market during the forecast period.

What is the market size of EV chargers?

The electric vehicle charger market was valued at USD 6,520.9 million in 2023.

Who are the top 5 EV charger manufacturers?

Tesla, Allego, NaaS Technology, EVgo, and ChargePoint.

Who is the biggest manufacturer of EV charging stations?

Leading manufacturers of EV charging stations include Tesla, ABB, and Siemens.

Explore Similar Insights

Future Market Insights

EV Charger Converter Module Market