Vehicle-to-Grid Market Forecast and Outlook from 2025 to 2035

The vehicle-to-grid (V2G) market is undergoing rapid evolution, fueled by rising adoption of electric vehicles (EVs) and the increasing demand for grid flexibility and energy decentralization. Utility providers and grid operators are integrating V2G technology into their load balancing strategies to manage renewable energy intermittency and enhance grid resilience. Automakers and energy companies have formed strategic alliances to develop bidirectional charging infrastructure, enabling EVs to act as distributed energy resources.

Regulatory developments supporting energy storage integration and grid modernization have further accelerated deployment in key markets. Investor presentations and utility sector press briefings have emphasized the potential of V2G to deliver revenue streams through frequency regulation, demand response, and peak shaving services.

With advancements in bidirectional charging protocols, power electronics, and real-time energy communication systems, the market is expected to grow substantially. Segmental growth is led by battery electric vehicles due to their storage capacity, EVSE as the key interface component, and power management technology for controlling energy flow between vehicles and the grid.
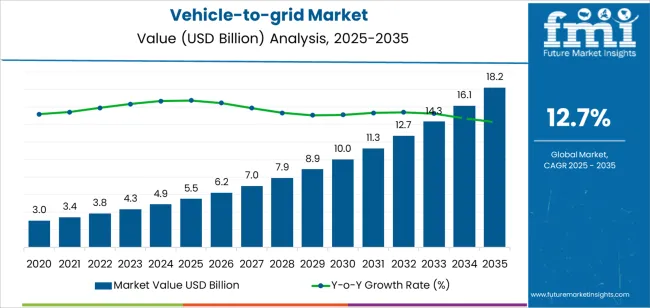
Quick Stats for Vehicle-to-grid Market

  • Vehicle-to-grid Market Industry Value (2025): USD 5.5 billion
  • Vehicle-to-grid Market Forecast Value (2035): USD 18.2 billion
  • Vehicle-to-grid Market Forecast CAGR: 12.7%
  • Leading Segment in Vehicle-to-grid Market in 2025: Battery Electric Vehicles (72.4%)
  • Key Growth Region in Vehicle-to-grid Market: North America, Asia-Pacific, Europe
  • Top Key Players in Vehicle-to-grid Market: Nuvve Corporation, EnerDel, Inc., Honda, AC Propulsion, Boulder Electric Vehicle, Fermata Energy, NRG Energy, DENSO Co, Nissan Motor Corporation, Edison International

Vehicle To Grid Market Market Value Analysis

Metric Value
Vehicle-to-grid Market Estimated Value in (2025 E) USD 5.5 billion
Vehicle-to-grid Market Forecast Value in (2035 F) USD 18.2 billion
Forecast CAGR (2025 to 2035) 12.7%

Segmental Analysis

The market is segmented by Vehicle Type, Components, Technology, and Charging Type and region. By Vehicle Type, the market is divided into Battery Electric Vehicles, Plug In Hybrid Electric Vehicles, and Fuel Cell Vehicles (FCVs). In terms of Components, the market is classified into Electric Vehicle Supply Equipment (EVSE), Smart Meters, Home Energy Management (HEM), and Others. Based on Technology, the market is segmented into Power Management and Software. By Charging Type, the market is divided into Bidirectional Charging and Unidirectional Charging. Regionally, the market is classified into North America, Latin America, Western Europe, Eastern Europe, Balkan & Baltic Countries, Russia & Belarus, Central Asia, East Asia, South Asia & Pacific, and the Middle East & Africa.
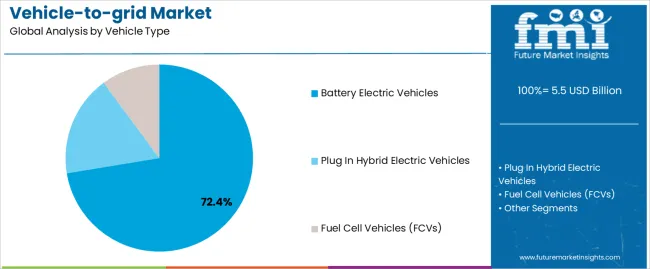
Insights into the Vehicle Type Segment: Battery Electric Vehicles

Vehicle To Grid Market Analysis By Vehicle Type

The Battery Electric Vehicles (BEVs) segment is projected to account for 72.4% of the vehicle-to-grid market revenue in 2025, emerging as the dominant vehicle type. This growth has been propelled by the increasing penetration of BEVs in global automotive markets, supported by strong policy incentives, improved charging infrastructure, and declining battery costs.

BEVs have been preferred for V2G applications due to their larger onboard battery capacities and compatibility with bidirectional charging systems. Automakers have been integrating V2G capabilities directly into BEV models, allowing them to feed energy back into the grid during peak demand periods.

Moreover, energy storage policies and utility-led pilot programs have prioritized BEVs in grid-interactive mobility solutions. The lack of internal combustion components enables BEVs to maximize energy availability and reduce mechanical complexity, further reinforcing their suitability for V2G functionality. As governments and energy providers seek to scale up decentralized energy systems, the BEV segment is expected to remain the backbone of V2G integration.
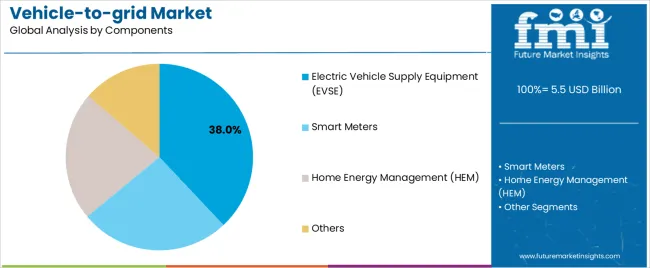
Insights into the Components Segment: Electric Vehicle Supply Equipment (EVSE)

Vehicle To Grid Market Analysis By Components

The Electric Vehicle Supply Equipment (EVSE) segment is anticipated to capture 38.0% of the vehicle-to-grid market revenue in 2025, establishing itself as the most critical component. Growth in this segment has been driven by the need for bidirectional charging infrastructure that can facilitate both energy intake and discharge between EVs and the grid.

EVSE systems have been engineered to incorporate grid communication protocols, energy metering capabilities, and safety features to manage bidirectional power flow. Equipment manufacturers have advanced the development of V2G-compatible EVSE units to meet interoperability standards and local utility regulations.

Investment announcements from energy companies and smart grid developers have consistently highlighted the deployment of next-generation EVSE to support residential, commercial, and fleet-based V2G applications. With increasing deployment of public and private charging stations across urban networks, the EVSE segment is expected to remain pivotal in scaling the vehicle-to-grid ecosystem globally.
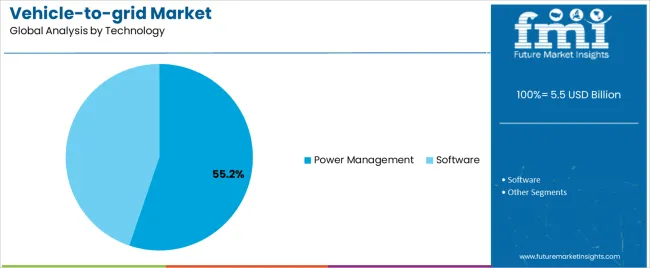
Insights into the Technology Segment: Power Management

Vehicle To Grid Market Analysis By Technology

The Power Management segment is expected to contribute 55.2% of the vehicle-to-grid market revenue in 2025, maintaining its lead among technology categories. Growth in this segment has been influenced by the central role of power management systems in optimizing energy distribution between electric vehicles and the grid.

These systems have been deployed to control voltage, monitor frequency, and coordinate real-time communication with grid operators to ensure stable energy transactions. Energy companies and software developers have focused on enhancing the intelligence of power management platforms, integrating AI-driven algorithms for predictive load balancing and peak demand forecasting.

The effectiveness of V2G systems in providing grid support services such as demand response, frequency regulation, and energy arbitrage has been largely dependent on robust power management capabilities. As more EVs are connected to the grid, dynamic power allocation and load synchronization will become essential, ensuring the continued dominance of this segment in the evolving V2G landscape.

Key Insights into the Vehicle-to-Grid Market Landscape

Integration of Vehicle-to-grid Systems with Home Energy Management Solutions

V2G systems are increasingly being integrated with smart grid infrastructure, enabling bidirectional energy flow between electric vehicles (EVs) and the grid. This trend allows EVs to serve as distributed energy resources, providing grid support services such as load balancing, peak shaving, and frequency regulation.

Adoption of Vehicle-to-grid Technology in Electric Vehicle (EV) Fleets

The growing adoption of electric vehicles worldwide is driving the expansion of V2G deployments. As EV fleets continue to grow, there is an increasing opportunity to aggregate their battery capacity for grid services, helping utilities manage energy demand and optimize grid operations.

Renewable Energy Integration to Fuel Sales

As the world transitions towards renewable energy sources, V2G systems offer an opportunity to integrate intermittent renewables like solar and wind power into the grid more effectively. EV batteries are set to store excess renewable energy during periods of low demand and discharge it when needed, helping to mitigate variability and ensure grid reliability.

Technical and Operational Challenges tom Hinder Growth

Technical and operational challenges, such as system complexity, reliability, and performance variability, are set to affect the operational effectiveness of V2G systems. Issues such as grid stability, bidirectional power flow management, and real-time control require robust technical solutions and operational protocols to ensure the safe and efficient operation of V2G deployments.

Analysis of Top Countries, Producing, Using, and Distributing Vehicle-to-grid

Growing Focus on Sustainable Transportation Options to Drive Sales in the United States

With the increasing adoption of electric vehicles (EVs) across the country, there is a growing opportunity to leverage EV batteries for grid services and energy storage. The United States government's support for clean energy initiatives, coupled with regulatory incentives and funding programs, further accelerates the development and deployment of V2G infrastructure.

Key players in the automotive, energy, and technology sectors are investing in V2G research, development, and pilot projects to demonstrate the feasibility and benefits of bidirectional power flow between EVs and the grid. Additionally, advancements in smart grid technologies, renewable energy integration, and energy management systems create favorable conditions for the expansion of the V2G market in the United States.

Challenges such as interoperability, regulatory barriers, and consumer acceptance remain significant considerations for widespread V2G adoption. V2G technology is set to revolutionize the United States energy landscape by enhancing grid resilience and accelerating the transition towards a sustainable, decentralized energy future.

China’s Robust Manufacturing Infrastructure Paves the Way for Large-scale Production

The vehicle-to-grid market in China is experiencing rapid growth and development, driven by various factors. With the country being the world's leading market for electric vehicles (EVs), there is immense potential to utilize EV batteries for grid services and energy storage.

The government's strong support for electric mobility and renewable energy initiatives, including subsidies, incentives, and policy directives, creates a conducive environment for V2G deployment. Key automotive, energy, and technology sectors are investing in V2G research and pilot projects to showcase the feasibility and benefits of bidirectional power flow between EVs and the grid.

Additionally, advancements in smart grid infrastructure, energy management systems, and renewable energy integration technologies further propel the growth of the V2G market in China. However, challenges such as grid stability, interoperability, and regulatory frameworks need to be addressed to unlock the full potential of V2G technology in China.

Government Policies are Promoting Vehicle-to-grid Adoption in the United Kingdom

The United Kingdom's is experiencing significant growth and innovation. With the country's ambitious goals to decarbonize its transportation sector and transition to renewable energy, V2G technology plays a crucial role in balancing grid demand and integrating intermittent renewable energy sources.

Leading automakers, energy companies, and technology providers are participating in pilot projects and trials to showcase the feasibility and benefits of bidirectional energy flow between electric vehicles and the grid. The United Kingdom’s energy landscape is set for transformation with V2G technology playing a vital role in achieving a sustainable and resilient future.

Vehicle-to-Grid Industry Analysis by Top Investment Segments

Consumers Looking for Economical Travel Options are Shifting to Electric Vehicles

Battery electric vehicles (EVs) are playing a pivotal role in the vehicle-to-grid market, offering a two-way energy exchange between vehicles and the grid. In V2G systems, EV batteries can store excess electricity from the grid during periods of low demand and feed it back into the grid when demand is high or during peak hours.

The bidirectional flow of electricity enables EVs to serve as distributed energy resources, providing grid support services such as demand response, frequency regulation, and energy storage. By participating in V2G programs, EV owners can earn revenue or receive incentives for allowing their vehicles to be used as grid assets.

V2G technology not only helps to balance grid demand and supply but also enhances grid stability, reliability, and resilience. Growing adoption of electric vehicles (EVs) and the expansion of V2G infrastructure are expected to significantly impact energy management and grid optimization in the future.

EVSE to be a Dominant Type of Component Globally

Electric Vehicle Supply Equipment (EVSE) plays a crucial role in promoting the adoption of electric vehicles (EVs), which are essential for reducing greenhouse gas emissions and combating climate change. Several governments offer subsidies, tax credits, and other incentives for both EV buyers and infrastructure developers, making EVSE investments more attractive.

Advances in battery technology have increased the range and efficiency of EVs, making these more appealing to consumers. Developments in EVSE, such as fast and ultra-fast chargers, reduce charging times significantly, addressing one of the main concerns of potential EV buyers. The development and installation of EVSE create jobs in manufacturing, installation, and maintenance sectors, thereby boosting demand.
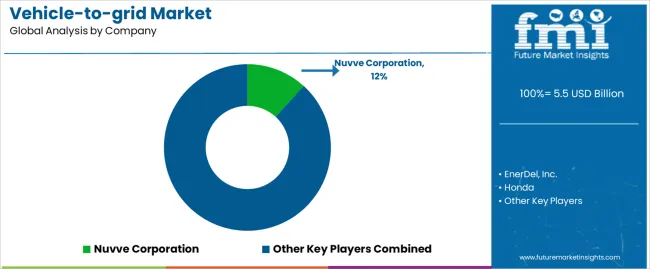
Leading Suppliers, Distributors, and Manufacturers of Vehicle Grid Market

Vehicle To Grid Market Analysis By Company

Leading companies are focusing on life cycle assessment and investing in research and development to innovate cost-effective applications for rare earth metals.

Strategic partnerships and collaborations help leading companies to capitalize on collective expertise and resources. AC Propulsion, Inc., Edison International, DENSO CORPORATION, Boulder Electric Vehicle, and Nissan are key players in the vehicle-to-grid industry.

Companies are expanding their presence in regions with high demand for vehicle-to-grid and adopting product diversification to provide europium-based items tailored to specific applications. Key companies are also focusing on environmentally friendly manufacturing and processing practices to meet regulatory requirements. Several leading manufacturers and companies are taking proactive measures to drive growth, foster innovation, and uphold sustainable practices.

Industry Updates

  • In 2025, Hager Energy, a Germany-based company, and IoTecha collaborated to offer innovative EV charging options, including bidirectional support and a "Vehicle to Home" solution, marking a critical turning point in the EV charging industry.
  • In 2025, Toyota, headquartered in Japan, and San Diego Gas & Electric Company signed a V2G research agreement, integrating renewable energy sources and reducing power costs for battery electric vehicles.

Leading Vehicle-to-grid Companies and their Strategies

  • AC Propulsion
  • IncEdison International.
  • DENSO CORPORATION.
  • Boulder Electric Vehicle
  • Nissan

Vehicle-to-grid Market Analyzed by Top Industry Segments

By Vehicle Type:

The industry is segmented into battery electric vehicles and plug-in electric vehicles (PEVs), and fuel cell vehicles (FCVs).

By Components:

Based on components, the industry is segregated into electric vehicle supply equipment (EVSE), smart meters, and home energy management (HEM).

By Technology:

The industry is segmented into power management and software.

By Charging Type:

Unidirectional charging and bidirectional charging are two key charging types.

By Region:

Industry analysis has been carried out in key countries of North America, Latin America, Western Europe, Eastern Europe, South Asia and Pacific, East Asia, and the Middle East and Africa.

Frequently Asked Questions

How big is the vehicle-to-grid market in 2025?

The global vehicle-to-grid market is estimated to be valued at USD 5.5 billion in 2025.

What will be the size of vehicle-to-grid market in 2035?

The market size for the vehicle-to-grid market is projected to reach USD 18.2 billion by 2035.

How much will be the vehicle-to-grid market growth between 2025 and 2035?

The vehicle-to-grid market is expected to grow at a 12.7% CAGR between 2025 and 2035.

What are the key product types in the vehicle-to-grid market?

The key product types in vehicle-to-grid market are battery electric vehicles, plug in hybrid electric vehicles and fuel cell vehicles (fcvs).

Which components segment to contribute significant share in the vehicle-to-grid market in 2025?

In terms of components, electric vehicle supply equipment (evse) segment to command 38.0% share in the vehicle-to-grid market in 2025.

Table of Content

  1. Executive Summary
    • Global Market Outlook
    • Demand to side Trends
    • Supply to side Trends
    • Technology Roadmap Analysis
    • Analysis and Recommendations
  2. Market Overview
    • Market Coverage / Taxonomy
    • Market Definition / Scope / Limitations
  3. Market Background
    • Market Dynamics
      • Drivers
      • Restraints
      • Opportunity
      • Trends
    • Scenario Forecast
      • Demand in Optimistic Scenario
      • Demand in Likely Scenario
      • Demand in Conservative Scenario
    • Opportunity Map Analysis
    • Product Life Cycle Analysis
    • Supply Chain Analysis
    • Investment Feasibility Matrix
    • Value Chain Analysis
    • PESTLE and Porter’s Analysis
    • Regulatory Landscape
    • Regional Parent Market Outlook
    • Production and Consumption Statistics
    • Import and Export Statistics
  4. Global Market Analysis 2020 to 2024 and Forecast, 2025 to 2035
    • Historical Market Size Value (USD Million) Analysis, 2020 to 2024
    • Current and Future Market Size Value (USD Million) Projections, 2025 to 2035
      • Y to o to Y Growth Trend Analysis
      • Absolute $ Opportunity Analysis
  5. Global Market Pricing Analysis 2020 to 2024 and Forecast 2025 to 2035
  6. Global Market Analysis 2020 to 2024 and Forecast 2025 to 2035, By Vehicle Type
    • Introduction / Key Findings
    • Historical Market Size Value (USD Million) Analysis By Vehicle Type , 2020 to 2024
    • Current and Future Market Size Value (USD Million) Analysis and Forecast By Vehicle Type , 2025 to 2035
      • Battery Electric Vehicles
      • Plug In Hybrid Electric Vehicles
      • Fuel Cell Vehicles (FCVs)
    • Y to o to Y Growth Trend Analysis By Vehicle Type , 2020 to 2024
    • Absolute $ Opportunity Analysis By Vehicle Type , 2025 to 2035
  7. Global Market Analysis 2020 to 2024 and Forecast 2025 to 2035, By Components
    • Introduction / Key Findings
    • Historical Market Size Value (USD Million) Analysis By Components, 2020 to 2024
    • Current and Future Market Size Value (USD Million) Analysis and Forecast By Components, 2025 to 2035
      • Electric Vehicle Supply Equipment (EVSE)
      • Smart Meters
      • Home Energy Management (HEM)
      • Others
    • Y to o to Y Growth Trend Analysis By Components, 2020 to 2024
    • Absolute $ Opportunity Analysis By Components, 2025 to 2035
  8. Global Market Analysis 2020 to 2024 and Forecast 2025 to 2035, By Technology
    • Introduction / Key Findings
    • Historical Market Size Value (USD Million) Analysis By Technology, 2020 to 2024
    • Current and Future Market Size Value (USD Million) Analysis and Forecast By Technology, 2025 to 2035
      • Power Management
      • Software
    • Y to o to Y Growth Trend Analysis By Technology, 2020 to 2024
    • Absolute $ Opportunity Analysis By Technology, 2025 to 2035
  9. Global Market Analysis 2020 to 2024 and Forecast 2025 to 2035, By Charging Type
    • Introduction / Key Findings
    • Historical Market Size Value (USD Million) Analysis By Charging Type, 2020 to 2024
    • Current and Future Market Size Value (USD Million) Analysis and Forecast By Charging Type, 2025 to 2035
      • Bidirectional Charging
      • Unidirectional Charging
    • Y to o to Y Growth Trend Analysis By Charging Type, 2020 to 2024
    • Absolute $ Opportunity Analysis By Charging Type, 2025 to 2035
  10. Global Market Analysis 2020 to 2024 and Forecast 2025 to 2035, By Region
    • Introduction
    • Historical Market Size Value (USD Million) Analysis By Region, 2020 to 2024
    • Current Market Size Value (USD Million) Analysis and Forecast By Region, 2025 to 2035
      • North America
      • Latin America
      • Western Europe
      • Eastern Europe
      • East Asia
      • South Asia and Pacific
      • Middle East & Africa
    • Market Attractiveness Analysis By Region
  11. North America Market Analysis 2020 to 2024 and Forecast 2025 to 2035, By Country
    • Historical Market Size Value (USD Million) Trend Analysis By Market Taxonomy, 2020 to 2024
    • Market Size Value (USD Million) Forecast By Market Taxonomy, 2025 to 2035
      • By Country
        • USA
        • Canada
        • Mexico
      • By Vehicle Type
      • By Components
      • By Technology
      • By Charging Type
    • Market Attractiveness Analysis
      • By Country
      • By Vehicle Type
      • By Components
      • By Technology
      • By Charging Type
    • Key Takeaways
  12. Latin America Market Analysis 2020 to 2024 and Forecast 2025 to 2035, By Country
    • Historical Market Size Value (USD Million) Trend Analysis By Market Taxonomy, 2020 to 2024
    • Market Size Value (USD Million) Forecast By Market Taxonomy, 2025 to 2035
      • By Country
        • Brazil
        • Chile
        • Rest of Latin America
      • By Vehicle Type
      • By Components
      • By Technology
      • By Charging Type
    • Market Attractiveness Analysis
      • By Country
      • By Vehicle Type
      • By Components
      • By Technology
      • By Charging Type
    • Key Takeaways
  13. Western Europe Market Analysis 2020 to 2024 and Forecast 2025 to 2035, By Country
    • Historical Market Size Value (USD Million) Trend Analysis By Market Taxonomy, 2020 to 2024
    • Market Size Value (USD Million) Forecast By Market Taxonomy, 2025 to 2035
      • By Country
        • Germany
        • UK
        • Italy
        • Spain
        • France
        • Nordic
        • BENELUX
        • Rest of Western Europe
      • By Vehicle Type
      • By Components
      • By Technology
      • By Charging Type
    • Market Attractiveness Analysis
      • By Country
      • By Vehicle Type
      • By Components
      • By Technology
      • By Charging Type
    • Key Takeaways
  14. Eastern Europe Market Analysis 2020 to 2024 and Forecast 2025 to 2035, By Country
    • Historical Market Size Value (USD Million) Trend Analysis By Market Taxonomy, 2020 to 2024
    • Market Size Value (USD Million) Forecast By Market Taxonomy, 2025 to 2035
      • By Country
        • Russia
        • Poland
        • Hungary
        • Balkan & Baltic
        • Rest of Eastern Europe
      • By Vehicle Type
      • By Components
      • By Technology
      • By Charging Type
    • Market Attractiveness Analysis
      • By Country
      • By Vehicle Type
      • By Components
      • By Technology
      • By Charging Type
    • Key Takeaways
  15. East Asia Market Analysis 2020 to 2024 and Forecast 2025 to 2035, By Country
    • Historical Market Size Value (USD Million) Trend Analysis By Market Taxonomy, 2020 to 2024
    • Market Size Value (USD Million) Forecast By Market Taxonomy, 2025 to 2035
      • By Country
        • China
        • Japan
        • South Korea
      • By Vehicle Type
      • By Components
      • By Technology
      • By Charging Type
    • Market Attractiveness Analysis
      • By Country
      • By Vehicle Type
      • By Components
      • By Technology
      • By Charging Type
    • Key Takeaways
  16. South Asia and Pacific Market Analysis 2020 to 2024 and Forecast 2025 to 2035, By Country
    • Historical Market Size Value (USD Million) Trend Analysis By Market Taxonomy, 2020 to 2024
    • Market Size Value (USD Million) Forecast By Market Taxonomy, 2025 to 2035
      • By Country
        • India
        • ASEAN
        • Australia & New Zealand
        • Rest of South Asia and Pacific
      • By Vehicle Type
      • By Components
      • By Technology
      • By Charging Type
    • Market Attractiveness Analysis
      • By Country
      • By Vehicle Type
      • By Components
      • By Technology
      • By Charging Type
    • Key Takeaways
  17. Middle East & Africa Market Analysis 2020 to 2024 and Forecast 2025 to 2035, By Country
    • Historical Market Size Value (USD Million) Trend Analysis By Market Taxonomy, 2020 to 2024
    • Market Size Value (USD Million) Forecast By Market Taxonomy, 2025 to 2035
      • By Country
        • Kingdom of Saudi Arabia
        • Other GCC Countries
        • Turkiye
        • South Africa
        • Other African Union
        • Rest of Middle East & Africa
      • By Vehicle Type
      • By Components
      • By Technology
      • By Charging Type
    • Market Attractiveness Analysis
      • By Country
      • By Vehicle Type
      • By Components
      • By Technology
      • By Charging Type
    • Key Takeaways
  18. Key Countries Market Analysis
    • USA
      • Pricing Analysis
      • Market Share Analysis, 2024
        • By Vehicle Type
        • By Components
        • By Technology
        • By Charging Type
    • Canada
      • Pricing Analysis
      • Market Share Analysis, 2024
        • By Vehicle Type
        • By Components
        • By Technology
        • By Charging Type
    • Mexico
      • Pricing Analysis
      • Market Share Analysis, 2024
        • By Vehicle Type
        • By Components
        • By Technology
        • By Charging Type
    • Brazil
      • Pricing Analysis
      • Market Share Analysis, 2024
        • By Vehicle Type
        • By Components
        • By Technology
        • By Charging Type
    • Chile
      • Pricing Analysis
      • Market Share Analysis, 2024
        • By Vehicle Type
        • By Components
        • By Technology
        • By Charging Type
    • Germany
      • Pricing Analysis
      • Market Share Analysis, 2024
        • By Vehicle Type
        • By Components
        • By Technology
        • By Charging Type
    • UK
      • Pricing Analysis
      • Market Share Analysis, 2024
        • By Vehicle Type
        • By Components
        • By Technology
        • By Charging Type
    • Italy
      • Pricing Analysis
      • Market Share Analysis, 2024
        • By Vehicle Type
        • By Components
        • By Technology
        • By Charging Type
    • Spain
      • Pricing Analysis
      • Market Share Analysis, 2024
        • By Vehicle Type
        • By Components
        • By Technology
        • By Charging Type
    • France
      • Pricing Analysis
      • Market Share Analysis, 2024
        • By Vehicle Type
        • By Components
        • By Technology
        • By Charging Type
    • India
      • Pricing Analysis
      • Market Share Analysis, 2024
        • By Vehicle Type
        • By Components
        • By Technology
        • By Charging Type
    • ASEAN
      • Pricing Analysis
      • Market Share Analysis, 2024
        • By Vehicle Type
        • By Components
        • By Technology
        • By Charging Type
    • Australia & New Zealand
      • Pricing Analysis
      • Market Share Analysis, 2024
        • By Vehicle Type
        • By Components
        • By Technology
        • By Charging Type
    • China
      • Pricing Analysis
      • Market Share Analysis, 2024
        • By Vehicle Type
        • By Components
        • By Technology
        • By Charging Type
    • Japan
      • Pricing Analysis
      • Market Share Analysis, 2024
        • By Vehicle Type
        • By Components
        • By Technology
        • By Charging Type
    • South Korea
      • Pricing Analysis
      • Market Share Analysis, 2024
        • By Vehicle Type
        • By Components
        • By Technology
        • By Charging Type
    • Russia
      • Pricing Analysis
      • Market Share Analysis, 2024
        • By Vehicle Type
        • By Components
        • By Technology
        • By Charging Type
    • Poland
      • Pricing Analysis
      • Market Share Analysis, 2024
        • By Vehicle Type
        • By Components
        • By Technology
        • By Charging Type
    • Hungary
      • Pricing Analysis
      • Market Share Analysis, 2024
        • By Vehicle Type
        • By Components
        • By Technology
        • By Charging Type
    • Kingdom of Saudi Arabia
      • Pricing Analysis
      • Market Share Analysis, 2024
        • By Vehicle Type
        • By Components
        • By Technology
        • By Charging Type
    • Turkiye
      • Pricing Analysis
      • Market Share Analysis, 2024
        • By Vehicle Type
        • By Components
        • By Technology
        • By Charging Type
    • South Africa
      • Pricing Analysis
      • Market Share Analysis, 2024
        • By Vehicle Type
        • By Components
        • By Technology
        • By Charging Type
  19. Market Structure Analysis
    • Competition Dashboard
    • Competition Benchmarking
    • Market Share Analysis of Top Players
      • By Regional
      • By Vehicle Type
      • By Components
      • By Technology
      • By Charging Type
  20. Competition Analysis
    • Competition Deep Dive
      • Nuvve Corporation
        • Overview
        • Product Portfolio
        • Profitability by Market Segments (Product/Age /Sales Channel/Region)
        • Sales Footprint
        • Strategy Overview
          • Marketing Strategy
          • Product Strategy
          • Channel Strategy
      • EnerDel, Inc.
      • Honda
      • AC Propulsion
      • Boulder Electric Vehicle
      • Fermata Energy
      • NRG Energy
      • DENSO Co
      • Nissan Motor Corporation
      • Edison International
  21. Assumptions & Acronyms Used
  22. Research Methodology

List of Tables

  • Table 1: Global Market Value (USD Million) Forecast by Region, 2020 to 2035
  • Table 2: Global Market Value (USD Million) Forecast by Vehicle Type , 2020 to 2035
  • Table 3: Global Market Value (USD Million) Forecast by Components, 2020 to 2035
  • Table 4: Global Market Value (USD Million) Forecast by Technology, 2020 to 2035
  • Table 5: Global Market Value (USD Million) Forecast by Charging Type, 2020 to 2035
  • Table 6: North America Market Value (USD Million) Forecast by Country, 2020 to 2035
  • Table 7: North America Market Value (USD Million) Forecast by Vehicle Type , 2020 to 2035
  • Table 8: North America Market Value (USD Million) Forecast by Components, 2020 to 2035
  • Table 9: North America Market Value (USD Million) Forecast by Technology, 2020 to 2035
  • Table 10: North America Market Value (USD Million) Forecast by Charging Type, 2020 to 2035
  • Table 11: Latin America Market Value (USD Million) Forecast by Country, 2020 to 2035
  • Table 12: Latin America Market Value (USD Million) Forecast by Vehicle Type , 2020 to 2035
  • Table 13: Latin America Market Value (USD Million) Forecast by Components, 2020 to 2035
  • Table 14: Latin America Market Value (USD Million) Forecast by Technology, 2020 to 2035
  • Table 15: Latin America Market Value (USD Million) Forecast by Charging Type, 2020 to 2035
  • Table 16: Western Europe Market Value (USD Million) Forecast by Country, 2020 to 2035
  • Table 17: Western Europe Market Value (USD Million) Forecast by Vehicle Type , 2020 to 2035
  • Table 18: Western Europe Market Value (USD Million) Forecast by Components, 2020 to 2035
  • Table 19: Western Europe Market Value (USD Million) Forecast by Technology, 2020 to 2035
  • Table 20: Western Europe Market Value (USD Million) Forecast by Charging Type, 2020 to 2035
  • Table 21: Eastern Europe Market Value (USD Million) Forecast by Country, 2020 to 2035
  • Table 22: Eastern Europe Market Value (USD Million) Forecast by Vehicle Type , 2020 to 2035
  • Table 23: Eastern Europe Market Value (USD Million) Forecast by Components, 2020 to 2035
  • Table 24: Eastern Europe Market Value (USD Million) Forecast by Technology, 2020 to 2035
  • Table 25: Eastern Europe Market Value (USD Million) Forecast by Charging Type, 2020 to 2035
  • Table 26: East Asia Market Value (USD Million) Forecast by Country, 2020 to 2035
  • Table 27: East Asia Market Value (USD Million) Forecast by Vehicle Type , 2020 to 2035
  • Table 28: East Asia Market Value (USD Million) Forecast by Components, 2020 to 2035
  • Table 29: East Asia Market Value (USD Million) Forecast by Technology, 2020 to 2035
  • Table 30: East Asia Market Value (USD Million) Forecast by Charging Type, 2020 to 2035
  • Table 31: South Asia and Pacific Market Value (USD Million) Forecast by Country, 2020 to 2035
  • Table 32: South Asia and Pacific Market Value (USD Million) Forecast by Vehicle Type , 2020 to 2035
  • Table 33: South Asia and Pacific Market Value (USD Million) Forecast by Components, 2020 to 2035
  • Table 34: South Asia and Pacific Market Value (USD Million) Forecast by Technology, 2020 to 2035
  • Table 35: South Asia and Pacific Market Value (USD Million) Forecast by Charging Type, 2020 to 2035
  • Table 36: Middle East & Africa Market Value (USD Million) Forecast by Country, 2020 to 2035
  • Table 37: Middle East & Africa Market Value (USD Million) Forecast by Vehicle Type , 2020 to 2035
  • Table 38: Middle East & Africa Market Value (USD Million) Forecast by Components, 2020 to 2035
  • Table 39: Middle East & Africa Market Value (USD Million) Forecast by Technology, 2020 to 2035
  • Table 40: Middle East & Africa Market Value (USD Million) Forecast by Charging Type, 2020 to 2035

List of Figures

  • Figure 1: Global Market Pricing Analysis
  • Figure 2: Global Market Value (USD Million) Forecast 2020-2035
  • Figure 3: Global Market Value Share and BPS Analysis by Vehicle Type , 2025 and 2035
  • Figure 4: Global Market Y to o to Y Growth Comparison by Vehicle Type , 2025-2035
  • Figure 5: Global Market Attractiveness Analysis by Vehicle Type
  • Figure 6: Global Market Value Share and BPS Analysis by Components, 2025 and 2035
  • Figure 7: Global Market Y to o to Y Growth Comparison by Components, 2025-2035
  • Figure 8: Global Market Attractiveness Analysis by Components
  • Figure 9: Global Market Value Share and BPS Analysis by Technology, 2025 and 2035
  • Figure 10: Global Market Y to o to Y Growth Comparison by Technology, 2025-2035
  • Figure 11: Global Market Attractiveness Analysis by Technology
  • Figure 12: Global Market Value Share and BPS Analysis by Charging Type, 2025 and 2035
  • Figure 13: Global Market Y to o to Y Growth Comparison by Charging Type, 2025-2035
  • Figure 14: Global Market Attractiveness Analysis by Charging Type
  • Figure 15: Global Market Value (USD Million) Share and BPS Analysis by Region, 2025 and 2035
  • Figure 16: Global Market Y to o to Y Growth Comparison by Region, 2025-2035
  • Figure 17: Global Market Attractiveness Analysis by Region
  • Figure 18: North America Market Incremental Dollar Opportunity, 2025-2035
  • Figure 19: Latin America Market Incremental Dollar Opportunity, 2025-2035
  • Figure 20: Western Europe Market Incremental Dollar Opportunity, 2025-2035
  • Figure 21: Eastern Europe Market Incremental Dollar Opportunity, 2025-2035
  • Figure 22: East Asia Market Incremental Dollar Opportunity, 2025-2035
  • Figure 23: South Asia and Pacific Market Incremental Dollar Opportunity, 2025-2035
  • Figure 24: Middle East & Africa Market Incremental Dollar Opportunity, 2025-2035
  • Figure 25: North America Market Value Share and BPS Analysis by Country, 2025 and 2035
  • Figure 26: North America Market Value Share and BPS Analysis by Vehicle Type , 2025 and 2035
  • Figure 27: North America Market Y to o to Y Growth Comparison by Vehicle Type , 2025-2035
  • Figure 28: North America Market Attractiveness Analysis by Vehicle Type
  • Figure 29: North America Market Value Share and BPS Analysis by Components, 2025 and 2035
  • Figure 30: North America Market Y to o to Y Growth Comparison by Components, 2025-2035
  • Figure 31: North America Market Attractiveness Analysis by Components
  • Figure 32: North America Market Value Share and BPS Analysis by Technology, 2025 and 2035
  • Figure 33: North America Market Y to o to Y Growth Comparison by Technology, 2025-2035
  • Figure 34: North America Market Attractiveness Analysis by Technology
  • Figure 35: North America Market Value Share and BPS Analysis by Charging Type, 2025 and 2035
  • Figure 36: North America Market Y to o to Y Growth Comparison by Charging Type, 2025-2035
  • Figure 37: North America Market Attractiveness Analysis by Charging Type
  • Figure 38: Latin America Market Value Share and BPS Analysis by Country, 2025 and 2035
  • Figure 39: Latin America Market Value Share and BPS Analysis by Vehicle Type , 2025 and 2035
  • Figure 40: Latin America Market Y to o to Y Growth Comparison by Vehicle Type , 2025-2035
  • Figure 41: Latin America Market Attractiveness Analysis by Vehicle Type
  • Figure 42: Latin America Market Value Share and BPS Analysis by Components, 2025 and 2035
  • Figure 43: Latin America Market Y to o to Y Growth Comparison by Components, 2025-2035
  • Figure 44: Latin America Market Attractiveness Analysis by Components
  • Figure 45: Latin America Market Value Share and BPS Analysis by Technology, 2025 and 2035
  • Figure 46: Latin America Market Y to o to Y Growth Comparison by Technology, 2025-2035
  • Figure 47: Latin America Market Attractiveness Analysis by Technology
  • Figure 48: Latin America Market Value Share and BPS Analysis by Charging Type, 2025 and 2035
  • Figure 49: Latin America Market Y to o to Y Growth Comparison by Charging Type, 2025-2035
  • Figure 50: Latin America Market Attractiveness Analysis by Charging Type
  • Figure 51: Western Europe Market Value Share and BPS Analysis by Country, 2025 and 2035
  • Figure 52: Western Europe Market Value Share and BPS Analysis by Vehicle Type , 2025 and 2035
  • Figure 53: Western Europe Market Y to o to Y Growth Comparison by Vehicle Type , 2025-2035
  • Figure 54: Western Europe Market Attractiveness Analysis by Vehicle Type
  • Figure 55: Western Europe Market Value Share and BPS Analysis by Components, 2025 and 2035
  • Figure 56: Western Europe Market Y to o to Y Growth Comparison by Components, 2025-2035
  • Figure 57: Western Europe Market Attractiveness Analysis by Components
  • Figure 58: Western Europe Market Value Share and BPS Analysis by Technology, 2025 and 2035
  • Figure 59: Western Europe Market Y to o to Y Growth Comparison by Technology, 2025-2035
  • Figure 60: Western Europe Market Attractiveness Analysis by Technology
  • Figure 61: Western Europe Market Value Share and BPS Analysis by Charging Type, 2025 and 2035
  • Figure 62: Western Europe Market Y to o to Y Growth Comparison by Charging Type, 2025-2035
  • Figure 63: Western Europe Market Attractiveness Analysis by Charging Type
  • Figure 64: Eastern Europe Market Value Share and BPS Analysis by Country, 2025 and 2035
  • Figure 65: Eastern Europe Market Value Share and BPS Analysis by Vehicle Type , 2025 and 2035
  • Figure 66: Eastern Europe Market Y to o to Y Growth Comparison by Vehicle Type , 2025-2035
  • Figure 67: Eastern Europe Market Attractiveness Analysis by Vehicle Type
  • Figure 68: Eastern Europe Market Value Share and BPS Analysis by Components, 2025 and 2035
  • Figure 69: Eastern Europe Market Y to o to Y Growth Comparison by Components, 2025-2035
  • Figure 70: Eastern Europe Market Attractiveness Analysis by Components
  • Figure 71: Eastern Europe Market Value Share and BPS Analysis by Technology, 2025 and 2035
  • Figure 72: Eastern Europe Market Y to o to Y Growth Comparison by Technology, 2025-2035
  • Figure 73: Eastern Europe Market Attractiveness Analysis by Technology
  • Figure 74: Eastern Europe Market Value Share and BPS Analysis by Charging Type, 2025 and 2035
  • Figure 75: Eastern Europe Market Y to o to Y Growth Comparison by Charging Type, 2025-2035
  • Figure 76: Eastern Europe Market Attractiveness Analysis by Charging Type
  • Figure 77: East Asia Market Value Share and BPS Analysis by Country, 2025 and 2035
  • Figure 78: East Asia Market Value Share and BPS Analysis by Vehicle Type , 2025 and 2035
  • Figure 79: East Asia Market Y to o to Y Growth Comparison by Vehicle Type , 2025-2035
  • Figure 80: East Asia Market Attractiveness Analysis by Vehicle Type
  • Figure 81: East Asia Market Value Share and BPS Analysis by Components, 2025 and 2035
  • Figure 82: East Asia Market Y to o to Y Growth Comparison by Components, 2025-2035
  • Figure 83: East Asia Market Attractiveness Analysis by Components
  • Figure 84: East Asia Market Value Share and BPS Analysis by Technology, 2025 and 2035
  • Figure 85: East Asia Market Y to o to Y Growth Comparison by Technology, 2025-2035
  • Figure 86: East Asia Market Attractiveness Analysis by Technology
  • Figure 87: East Asia Market Value Share and BPS Analysis by Charging Type, 2025 and 2035
  • Figure 88: East Asia Market Y to o to Y Growth Comparison by Charging Type, 2025-2035
  • Figure 89: East Asia Market Attractiveness Analysis by Charging Type
  • Figure 90: South Asia and Pacific Market Value Share and BPS Analysis by Country, 2025 and 2035
  • Figure 91: South Asia and Pacific Market Value Share and BPS Analysis by Vehicle Type , 2025 and 2035
  • Figure 92: South Asia and Pacific Market Y to o to Y Growth Comparison by Vehicle Type , 2025-2035
  • Figure 93: South Asia and Pacific Market Attractiveness Analysis by Vehicle Type
  • Figure 94: South Asia and Pacific Market Value Share and BPS Analysis by Components, 2025 and 2035
  • Figure 95: South Asia and Pacific Market Y to o to Y Growth Comparison by Components, 2025-2035
  • Figure 96: South Asia and Pacific Market Attractiveness Analysis by Components
  • Figure 97: South Asia and Pacific Market Value Share and BPS Analysis by Technology, 2025 and 2035
  • Figure 98: South Asia and Pacific Market Y to o to Y Growth Comparison by Technology, 2025-2035
  • Figure 99: South Asia and Pacific Market Attractiveness Analysis by Technology
  • Figure 100: South Asia and Pacific Market Value Share and BPS Analysis by Charging Type, 2025 and 2035
  • Figure 101: South Asia and Pacific Market Y to o to Y Growth Comparison by Charging Type, 2025-2035
  • Figure 102: South Asia and Pacific Market Attractiveness Analysis by Charging Type
  • Figure 103: Middle East & Africa Market Value Share and BPS Analysis by Country, 2025 and 2035
  • Figure 104: Middle East & Africa Market Value Share and BPS Analysis by Vehicle Type , 2025 and 2035
  • Figure 105: Middle East & Africa Market Y to o to Y Growth Comparison by Vehicle Type , 2025-2035
  • Figure 106: Middle East & Africa Market Attractiveness Analysis by Vehicle Type
  • Figure 107: Middle East & Africa Market Value Share and BPS Analysis by Components, 2025 and 2035
  • Figure 108: Middle East & Africa Market Y to o to Y Growth Comparison by Components, 2025-2035
  • Figure 109: Middle East & Africa Market Attractiveness Analysis by Components
  • Figure 110: Middle East & Africa Market Value Share and BPS Analysis by Technology, 2025 and 2035
  • Figure 111: Middle East & Africa Market Y to o to Y Growth Comparison by Technology, 2025-2035
  • Figure 112: Middle East & Africa Market Attractiveness Analysis by Technology
  • Figure 113: Middle East & Africa Market Value Share and BPS Analysis by Charging Type, 2025 and 2035
  • Figure 114: Middle East & Africa Market Y to o to Y Growth Comparison by Charging Type, 2025-2035
  • Figure 115: Middle East & Africa Market Attractiveness Analysis by Charging Type
  • Figure 116: Global Market - Tier Structure Analysis
  • Figure 117: Global Market - Company Share Analysis
Dashboard
Dashboard
Dashboard
Dashboard
Dashboard
Dashboard

Full Research Suite comprises of:

Market outlook & trends analysis

Market outlook & trends analysis

Interviews & case studies

Interviews & case studies

Strategic recommendations

Strategic recommendations

Vendor profiles & capabilities analysis

Vendor profiles & capabilities analysis

5-year forecasts

5-year forecasts

8 regions and 60+ country-level data splits

8 regions and 60+ country-level data splits

Market segment data splits

Market segment data splits

12 months of continuous data updates

12 months of continuous data updates

DELIVERED AS:

PDF EXCEL ONLINE

Full Research Suite


$5000

$7500

$10000

Buy Report Now
Future Market Insights

Vehicle-to-grid Market

Chat With MaRIA

Chat With

MaRIA

Hi There, I am MaRIA, Your Market Research Intelligence Assistant. How may I help you?