Reports

- Global Locations -

Headquarters

Future Market Insights, Inc.

Christiana Corporate, 200
Continental Drive, Suite 401,
Newark, Delaware - 19713,
United States

T: +1-845-579-5705

Americas

Future Market Insights, Inc.

616 Corporate Way, Suite 2-9018,
Valley Cottage, NY 10989, United States

T: +1-347-918-3531

MEA

Future Market Insights

1602-6 Jumeirah Bay X2 Tower, Plot No: JLT-PH2-X2A,
Jumeirah Lakes Towers, Dubai,
United Arab Emirates

Europe

Future Market Insights

3rd Floor, 207 Regent Street,
W1B 3HH London
United Kingdom

T: + 44 (0) 20 8123 9659
D: +44 (0) 20 3287 4268

Asia Pacific

Future Market Insights

IndiaLand Global Tech Park, Unit UG-1, Behind Grand HighStreet, Phase 1, Hinjawadi, MH, Pune – 411057, India

Global Automotive DC-DC Converter Market Outlook (2023 to 2033)

The global automotive DC-DC converter market size is expected to increase from US$ 21,996 million in 2023 to US$ 289,542 million by the end of 2033. Over the next ten years (2023 to 2033), global automotive DC-DC converter sales are projected to rise at 30.1% CAGR.

Based on market projections, demand is likely to remain high for isolated automotive DC-DC converters. The target segment is expected to hold an impressive market share of over 86% in 2023.

High adoption of insulated DC-DC converters is due to their inherent advantages. This includes their ability to ensure safe electrical isolation between the input and output circuits. The prevalence of these converters is expected to be particularly prominent within the battery electric vehicle segment.

With manufacturers striving to meet the rising demand for eco-friendly transportation solutions and incorporate advanced power conversion systems into electric vehicles, sales of isolated DC-DC converters will rise rapidly.

Key Factors Shaping the Market Dynamics:

  • Increasing adoption of electric & hybrid vehicles is a prominent factor that will boost automotive DC-DC converter industry.
  • Advancements in battery technology will support market expansion.
  • Rising government initiatives to promote sustainable transportation will positively impact automotive DC-DC converter sales
  • Growing adoption of advanced technologies such as advanced driver-assistance systems (ADAS) is likely to elevate automotive DC-DC converter demand
  • Integration of DC-DC converters with other components will foster market development
  • Development of miniaturized DC-DC converters with higher efficiencies is expected to bode well for the market
  • Surging popularity of battery electric vehicles, hybrid electric vehicles, & plug-in hybrid electric vehicle will create high demand for automotive DC-DC power converters.

An automotive DC-DC converter is an electronic device that converts the high voltage direct current (DC) power from the vehicle's main battery into a lower voltage DC power. The converted DC is then used to power various electrical systems and components in the vehicle, such as the infotainment system, lights, sensors, modules, air conditioning system, etc.

DC-DC converters have become important components in modern vehicles. This is because they help to ensure the reliable and efficient operation of electrical systems and components, while also conserving energy and extending the battery life.

Rapid growth of the electric vehicle market globally is expected to boost the auto DC-DC converter industry. These converters are crucial components in regulating the electrical systems of almost all electric vehicles.

The surge in the popularity of electric vehicles (EVs) is due to various reasons such as the demand for cleaner fuel options and the unstable costs of liquid fossil fuels. As communities aim for eco-friendly and sustainable transportation choices, EVs have emerged as a practical solution.

Since they produce no emissions from their tailpipes, EVs aid in decreasing harmful gas discharges and enhancing air quality. Further, the unpredictable prices of liquid fossil fuels have prompted customers to shift towards EVs that provide reduced operating expenses and more dependable fuel pricing.

According to the International Energy Association (IEA), electric vehicle sales surpassed 10 million in 2022. Further, in the first quarter of 2023, around 2.3 million electric cars were sold and this number is likely to increase to about 14 million by the end of 2023.

The automotive DC-DC converter market will experience stupendous growth in tandem with the rising demand for EVs. These converters are crucial for efficient power conversion and management in the electric distribution systems of EVs.

Surging demand for electric vehicles, fueled by the desire for eco-friendly fuel options and the unstable prices of traditional liquid fuels, is expected to create lucrative revenue-generation opportunities for automotive DC-DC converter manufacturers.

Automotive OEMs are relentlessly endeavoring to enhance the energy efficiency and fuel economy of their vehicles. DC-DC converters are pivotal in optimizing power distribution and minimizing power losses by proficiently converting and regulating electrical energy for diverse vehicle systems.

A noteworthy trend in the automotive DC-DC converter industry is the growing use of ADAS in automobiles. DC-DC converters give the reliable and effective power that ADAS systems need. DC-DC converter demand is anticipated to rise along with the demand for ADAS systems.

Manufacturers are prioritizing improving the material quality and construction of automotive DC-DC converters and are also seeking strategic acquisitions and partnerships with local players to expand their reach.

Meeting the growing demand for highly efficient automotive DC-DC converters across different types of electric vehicles is also a top priority for manufacturers.

Prominent automotive DC-DC converter manufacturers are taking a proactive stance by forging strategic partnerships and acquiring local companies to strengthen their regional presence.

The primary focus of key market players is on creating customized solutions that cater to different power ranges and voltage requirements in the electric vehicle sector. By emphasizing versatility, they can meet the diverse needs of customers and maintain their dominance in the market.

Attributes Key Insights
Estimated Global Automotive DC-DC Converter Market Value (2023) US$ 21,996 million
Projected Automotive DC-DC Converter Market Size (2033) US$ 289,542 million
Value CAGR (2023 to 2033) 30.1%

Don't pay for what you don't need

Customize your report by selecting specific countries or regions and save 30%!

2018 to 2022 Global Automotive DC-DC Converter Sales Outlook Compared to Demand Forecast from 2023 to 2033

The automotive DC-DC converter market has witnessed remarkable growth over the past few years. For the ten next years (2023 to 2033), the global market for automotive DC-DC converters is expected to exhibit a CAGR of 30.1%.

The automotive DC-DC converter industry has a promising future, and companies operating in this space are expected to benefit from the growing demand for energy-efficient and eco-friendly vehicles.

Increasing demand for electric and hybrid vehicles across the world is a prominent factor expected to boost the global automotive DC-DC converter industry.

DC-DC converters are crucial in controlling voltage levels between the high-voltage battery system and various low-voltage subsystems, such as lighting, infotainment systems, and other electronic components. The increased demand for DC-DC converters is a clear indication of their vital role in ensuring effective power distribution within electric and hybrid vehicles.

Similarly, growing adoption of advanced technologies in the automotive sector and rising need for energy-efficient and eco-friendly vehicles will fuel market expansion.

Initially, electric vehicles commonly utilized traditional lead-acid batteries, which dominated the market. Nevertheless, due to advancements in battery technology, lithium-ion batteries have become the preferred option. Therefore, there has been a rise in demand for DC-DC converters capable of managing lithium-ion batteries.

The strict government regulations that aim to decrease greenhouse gas emissions and enhance fuel efficiency are significantly contributing to the expansion of the automotive DC-DC converter industry.

Automotive manufacturers are investing extensively in research and development to create advanced technologies that comply with these regulations, with DC-DC converters being an essential part of these technologies.

What are the Key Factors Fueling Expansion of the Automotive DC-DC Converter Industry?

Expansion of Charging Infrastructure to Boost the Market:

Developing countries and regions are aware of the necessity to expand their charging infrastructure to meet the rising demand for electric vehicles. This improvement in charging infrastructure indirectly encourages customers to switch to electric vehicles, resulting in a surge in adoption and an increased demand for DC-DC converters.

Growing focus and initiatives aimed at enhancing charging infrastructure in developing regions are contributing to the growth of the DC-DC converter industry.

Rising Adoption of Electric Vehicles to Bolster Automotive DC-DC Converter Sales:

The automotive DC-DC converter industry is set to experience notable growth driven by the increasing demand for range extension in electric vehicles.

As consumers prioritize vehicles with extended driving ranges, DC-DC converters play a crucial role in optimizing power transfer and management within the vehicle system.

Automotive manufacturers are focusing on developing advanced DC-DC converters to meet the evolving customer demands for longer-range electric vehicles. This presents a significant opportunity for market players to innovate and provide efficient solutions that address range extension requirements.

Advancements in DC-DC Converter Materials to Unlock New Opportunities:

Advancements in semiconductor technologies have revolutionized the landscape of DC-DC converters, providing high-efficiency and compact solutions. These innovative converters offer a multitude of advantages. This includes lower energy consumption, reduced heat dissipation, and lower overall costs.

The utilization of cutting-edge semiconductor materials such as silicon carbide and gallium nitride has played a crucial role in the development of high-power DC-DC converters, enabling enhanced efficiency and reliability.

The integration of power electronic converters with microcontrollers has given rise to more intelligent and sophisticated DC-DC converters. These intelligent converters possess the ability to monitor and regulate the output voltage and current, while also performing advanced functions such as voltage regulation and current sharing.

This convergence of semiconductor advancements, compact design, and intelligent control has paved the way for the next generation of efficient and intelligent DC-DC converters. Development of these advanced automotive DC-DC converters will create lucrative opportunities for manufacturers.

Nikhil Kaitwade
Nikhil Kaitwade

Principal Consultant

Talk to Analyst

Find your sweet spots for generating winning opportunities in this market.

What are the Challenges Faced by Automotive DC-DC Converter Manufacturers?

Automotive DC-DC converters are subject to various regulations, including safety standards and emissions regulations. Meeting these regulations can be expensive, and the cost of compliance is a significant restraint on the growth of the market.

The automotive industry is subject to various safety standards, such as the American National Standard Institute (ANSI) and the Society of Automotive Engineers (SAE), which specify the requirements for DC-DC converters used in vehicles.

These standards require that converters must be designed and manufactured to meet specific safety requirements, including thermal protection, electrical safety, and mechanical protection. Compliance with these standards can be costly, and manufacturers must invest in research and development, testing, and certification to ensure that their converters meet these standards.

How are Partnerships and Collaborations Driving Innovation and Growth in the Automotive DC-DC Converter Industry?

The automotive DC-DC converter market is set to witness partnerships and collaborations among component suppliers and product manufacturers. To fulfill the rising demand for electric vehicles, automotive companies are collaborating with technology businesses to create novel and cutting-edge products or solutions.

For instance, the Hyundai Motor Group and SK Innovation collaborated in 2020 to create a new EV battery system that includes a DC-DC converter. In a similar vein, Panasonic and Toyota announced a collaboration in 2021 to create a new battery technology that incorporates a DC-DC converter.

These partnerships and collaborations are anticipated to spur innovation in the automotive DC-DC converter industry and generate sizable prospects for industry expansion.

Ford and Google formed a strategic agreement in 2021 to create new connected vehicle technologies and enhance Ford vehicle owners' customer experience. This partnership is anticipated to spur innovation in the automotive sector and open up new business prospects for the manufacturers of automotive DC-DC converters.

Get the data you need at a Fraction of the cost

Personalize your report by choosing insights you need
and save 40%!

Which Region is Expected to Offer Lucrative Opportunities to Automotive DC-DC Converter Manufacturers?

East Asia and Europe to Remain a Market Hub for DC-DC Converter Manufacturers

Demand for automotive DC-DC converters in East Asia and Europe has been greatly influenced by the rising awareness and acceptance of electric vehicles (EVs).

To promote sustainability and environmental preservation, governments in Europe and East Asia have been actively encouraging the use of EVs through various supportive measures. This includes subsidies, incentives, and favorable policies aimed at promoting consumer adoption.

The administrations in these regions have also been putting resources into building up charging infrastructure and establishing a favorable climate for electric vehicle proprietors.

A solid charging system being accessible further upgrades the appeal and practicality of owning EVs, ultimately boosting the requirement for DC-DC converters.

The global market for automotive DC-DC converters is expected to be mainly driven by East Asia and Europe, which together will account for more than 75% of the demand. The reason for this high demand is the fast uptake of electric vehicles in these regions.

East Asia is a leading global supplier of electronic components, which makes it a prominent player in the supply and installation of DC-DC converters in the automotive sector. These factors underscore the dominant market position and impact of East Asia and Europe in propelling the expansion of the automotive DC-DC converter industry.

Comparative View of Adjacent Markets

Electric Vehicle Battery Market:

Attributes Electric Vehicle Battery Market
CAGR (2023 to 2033) 8.5%
Market Value (2023) US$ 9417 million
Growth Factor Rise in vehicle electrification is a key factor expected to drive the global electric vehicle battery market.
Key Trend Increasing government initiatives for encouraging adoption of electric and hybrid vehicles will boost electric vehicle battery sales.

ADAS Market:

Attributes ADAS Market
CAGR (2023 to 2032) 9.6%
Market Value (2023) US$ 34830 million
Growth Factor Rising integration of ADAS in modern vehicles to assist drivers and improve safety is expected to boost the global market.
Key Trend Rapid growth of electric vehicles sector and growing popularity of autonomous vehicles will elevate ADAD demand during the assessment period.

Country-wise Insights

Why is Demand for Automotive DC-DC Converters Rising Rapidly in China?

Increasing Electric Vehicle Production and Adoption Elevating DC-DC Converter Demand in China

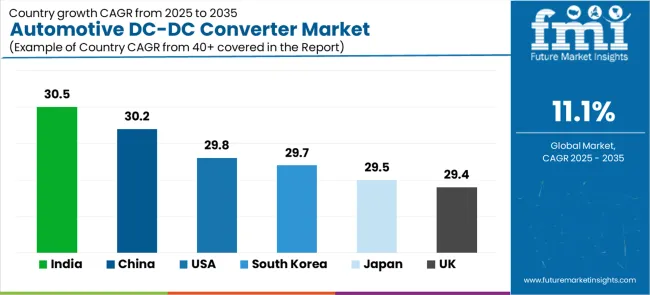
As per Future Market Insights (FMI), China will continue to remain a leading market for automotive DC-DC converters during the forecast period. This is due to booming automotive sector and rising popularity of electric and hybrid vehicles.

In recent years, there has been a sharp rise in production and sales of electric vehicles across China. This is due to rising environmental concerns and favorable government support.

According to the World Economic Forum, electric vehicle sales in China increased by 82% in 2022. Further, with 64% of global volume, it is also the world’s leading EV producer.

Rising production and sales of electric vehicles will therefore continue to make China a lucrative market for automotive DC-DC converters.

Strong presence of leading DC-DC converter manufacturers along with availability of low cost products will further boost China market.

Similarly, increasing usage of advanced technologies such as ADAS in vehicles and expansion of the aftermarket segment are expected to positively impact automotive DC-DC converter sales.

Category-wise Insights

Why is Demand for DC-DC Converters with an Output Power of Above 1000 W Rising?

Adoption of DC-DC Converters with >1000W Output Power in Electric Vehicles Fueling Demand

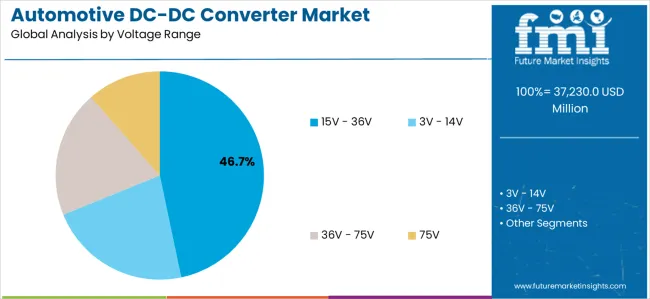
As per Future Market Insights (FMI), DC-DC converters with output power above 1000 W hold a significant market share of around 45.0%. This is due to their strong requirement for different types of electric vehicles.

Various electric vehicles require robust power management solutions to support their power-hungry components, and DC-DC converters with higher output power are capable of meeting those requirements effectively.

Thanks to their essential role in supporting the growing electric vehicle sector, demand for high-power DC-DC converters will continue to remain high during the assessment period.

Which is the Top Selling Product Type in the Market?

Isolated DC-DC Converter to Remain Top Selling Product Type Through 2033

The isolated DC-DC converter segment holds a significant market share of around 86.1% in the automotive DC-DC converter industry. One of the primary reasons for this high market share is the product type's superior efficiency and safety capabilities in electric vehicles.

Isolated DC-DC converters are designed to provide electrical isolation between the input and output circuits. They ensure that the output voltage remains stable and independent of the input voltage. This feature improves the safety of the converter, reducing the risk of electrical shocks and protecting the vehicle's sensitive electronics.

Isolated DC-DC converters are known for their high efficiency, which translates to lower energy consumption and better thermal management. As a result, they are a popular choice for electric vehicle manufacturers, and their dominance in the market is expected to continue in the coming years.

Which Vehicle Type Category will Generate High Demand for DC-DC Converters?

BEV Category to Generate High Demand for Automotive DC-DC Converters

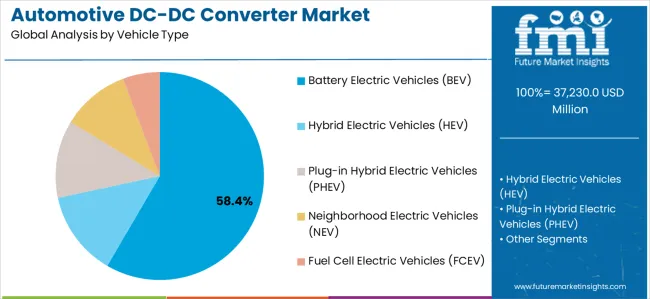
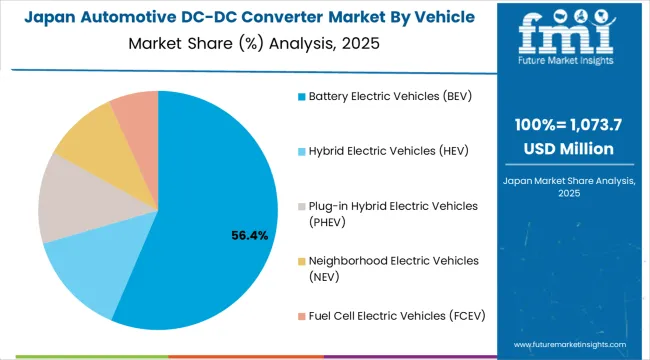
The battery electric vehicle (BEV) category is anticipated to demonstrate remarkable growth. As per FMI, BEV segment is expected to hold a predominant market share of about 64.0% during the forecast period.

Increasing sales of BEVs compared to other types of electric vehicles is resulting in a surge in the demand for DC-DC converters for this type.

The adoption of BEVs is being encouraged by governments worldwide to reduce carbon emissions and promote sustainable mobility. This will further elevate automotive DC-DC converter demand in this vehicle category, thereby boosting the target segment.

Competitive Landscape

There is a growing trend within the automotive sector towards material innovations in the development of DC-DC converters. These advancements are aimed at improving the overall performance and efficiency of these converters.

The focus is on the utilization of wide bandgap (WBG) semiconductors such as silicon carbide (SiC) and gallium nitride (GaN), which offer higher efficiency, increased power density, and improved thermal management.

There is also a strong emphasis on the development of magnetic materials such as soft magnetic composites (SMCs) and nanocrystalline alloys to enhance energy conversion efficiency and enable smaller form factors.

The development of thermal interface materials (TIMs) and packaging materials is aiding in the efficient dissipation of heat and compact design. The overall progress in material innovation for automotive DC-DC converters is advantageous for the market. This is because it offers reliable and efficient power conversion solutions, meeting the increasing need for sustainable and high-performance automotive technologies.

To sum up, the use of new materials in DC-DC converters for automobiles offers potential for business expansion. Adopting innovative materials allows companies to produce converters that are both efficient and smaller, which is consistent with the industry's focus on sustainability and electric cars.

By skillfully integrating material advances, businesses can appeal to customers, maintain a leading position in technology, and establish themselves as major players in the changing automotive sector.

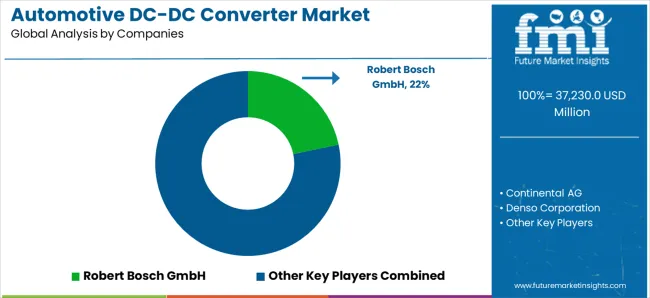
The global automotive DC-DC converter market is moderately consolidated among leading global manufacturers. The leading players account for more than 60% to 65% of the global automotive DC-DC converter market share.

Leading automotive DC-DC converter manufacturers are strategically focusing on introducing new highly durable and efficient products. They are also employing strategies such as acquisitions, mergers, collaborations, agreements, joint ventures, and partnerships to boost their revenues and expand their footprint.

According to FMI analysis, BEL FUSE INC., Texas Instruments, Infineon Technologies AG, STMicroelectronics, Murata Manufacturing Co. Ltd., etc. are few of the top manufacturers of automotive DC-DC converters.

Bel Fuse Inc.: Bel Fuse specializes in creating, producing, and promoting a wide range of products that empower, safeguard, and connect electronic circuits. Having been in the industry for more than 70 years, Bel has consistently demonstrated its proficiency in various product categories. Last year, Bel achieved an unprecedented sales figure of $654 million and a net income of $53 million.

Texas Instruments: Texas Instruments designs, manufactures, tests, and sells analog and embedded processing semiconductors across approximately 80,000 different products. The company produces several products including motor drivers, amplifiers, audio devices, data converters, isolation devices, sensors, microcontrollers (MCUs) & processors, etc.

With 15 manufacturing facilities across the globe, 12 wafer fabs, seven assembly and test factories, and various probe and bump facilities, the company has established a widespread manufacturing network. The company's focus is on creating packaging technologies that enable specialized components to function as intended throughout their designated lifespan.

Recent developments in the global automotive DC-DC converter industry:

  • In August 2019, the first 48V DC-DC converter that complies with ISO21780 Standard was introduced by Prodrive.
  • In 2021, to meet rising demand from automotive sector, a new DC-DC converter was launched by Vitesco Technologies.
  • In 2022, new DC-DC converter IC for automotive applications such as ADAS and infotainment was developed by ROHM.

Scope of the Report

Attribute Details
Estimated Market Value (2023) US$ 21,996 million
Projected Market Value (2033) US$ 289,542 million
Anticipated Growth Rate (2023 to 2033) 30.1% CAGR
Historical Data 2018 to 2022
Forecast Period 2023 to 2033
Quantitative Units Revenue in US$ Million, Volume in Units and CAGR from 2023 to 2033
Report Coverage Revenue Forecast, Volume Forecast, Company Ranking, Competitive Landscape, Growth Factors, Trends and Pricing Analysis
Segments Covered
  • Vehicle Type
  • Voltage
  • Output Power
  • Sales Channel
  • Product Type
  • Form Factor
Regions Covered
  • North America
  • Latin America
  • Europe
  • East Asia
  • South Asia and Pacific
  • Middle East and Africa
Key Countries Covered
  • United States
  • Canada
  • Brazil
  • Mexico
  • Rest of Latin America
  • Germany
  • Italy
  • France
  • United Kingdom
  • Spain
  • BENELUX
  • Russia
  • Rest of Europe
  • China
  • Japan
  • South Korea
  • India
  • ASEAN
  • Australia and New Zealand
  • Rest of South Asia & Pacific
  • GCC Countries
  • Türkiye
  • Northern Africa
  • South Africa
  • Rest of Middle East and Africa
Key Companies Profiled
  • BEL FUSE INC
  • Texas Instruments
  • Infineon Technologies AG
  • STMicroelectronics
  • Murata Manufacturing Co. Ltd.
  • BEL FUSE INC.
  • Vicor Corporation
  • FUJITSU
  • TOSHIBA
  • Semtech Corporation
  • Analog Devices Inc.
  • TDK Corp
  • Silver Atena GmbH

Global Automotive DC-DC Converter Market Segmentation

By Vehicle Type:

  • NEV (Neighborhood Electric Vehicle)
  • BEV (Battery Electric Vehicle)
  • HEV (Hybrid Electric Vehicle)
  • PHEV (Plug-in Hybrid Electric Vehicle)
  • FCEV (Fuel Cell Electric Vehicle)

By Voltage:

  • 3V-14V
  • 15V-36V
  • 36V-75V
  • >75 V

By Output Power:

  • 0.25-250 W
  • 250-500 W
  • 500 -1000 W
  • >1000W

By Sales Channel:

  • First Fit
  • Aftermarket

By Product Type:

  • Isolated
  • Non Isolated

By Form Factor:

  • Full Brick
  • Half Brick
  • Quarter Brick
  • Eight Brick
  • Sixteen Brick
  • Others

By Country:

  • United States
  • Canada
  • Brazil
  • Mexico
  • Rest of Latin America
  • Germany
  • Italy
  • France
  • United Kingdom
  • Spain
  • BENELUX
  • Russia
  • Rest of Europe
  • China
  • Japan
  • South Korea
  • India
  • ASEAN
  • Australia and New Zealand
  • Rest of South Asia & Pacific
  • GCC Countries
  • Türkiye
  • Northern Africa
  • South Africa Rest of Middle East and Africa

Frequently Asked Questions

What is the Current Valuation of the Automotive DC-DC Converter Market?

The automotive DC-DC converter market is likely to register US$ 21,996 million in 2023.

What is the Estimated Automotive DC-DC Converter Market Size envisioned by 2033?

The global automotive DC-DC converter market revenue is projected to exceed US$ 289,542 million by 2033.

What CAGR is Foreseen for the Automotive DC-DC Converter Market in the Upcoming Decade?

Sales of automotive DC-DC converters are anticipated to upsurge at an outstanding 30.1% CAGR through 2033.

Which Specific Regions Underscore Substantial Revenue Prospects for Automotive DC-DC Converter?

East Asia and Europe are poised to retain their status as prominent hubs for automotive DC-DC converters.

Which Segment Holds the Primary Position in terms of Product Type in the Automotive DC-DC Converter Market?

The isolated DC-DC converter category commands a substantial market share, accounting for about 86.1%

Table of Content

1. Executive Summary

    1.1. Global Market Outlook

    1.2. Demand Side Trends

    1.3. Supply Side Trends

    1.4. Technology Roadmap

    1.5. Analysis and Recommendations

2. Market Overview

    2.1. Market Coverage / Taxonomy

    2.2. Market Definition / Scope / Limitations

3. Key Market Trends

    3.1. Key Trends Impacting the Market

    3.2. Product Innovation / Development Trends

4. Key Success Factors

    4.1. Product Adoption / Product Type Analysis

    4.2. Product USP’s / Features

    4.3. Product Strategic Promotional Strategies

5. Global Market Demand Analysis 2018 to 2022 and Forecast, 2023 to 2033

    5.1. Historical Market Volume (Units) Analysis, 2018 to 2022

    5.2. Current and Future Market Volume (Units) Projections, 2023 to 2033

    5.3. Y-o-Y Growth Trend Analysis

6. Global Market - Pricing Analysis

    6.1. Regional Pricing Analysis By Voltage

    6.2. Global Average Pricing Analysis Benchmark

7. Global Market Demand (in Value or Size in US$ Million) Analysis 2018 to 2022 and Forecast, 2023 to 2033

    7.1. Historical Market Value (US$ Million) Analysis, 2018 to 2022

    7.2. Current and Future Market Value (US$ Million) Projections, 2023 to 2033

        7.2.1. Y-o-Y Growth Trend Analysis

        7.2.2. Absolute $ Opportunity Analysis

8. Market Background

    8.1. Macro-Economic Factors

        8.1.1. Global GDP Growth Outlook

        8.1.2. Global Industry Value-Added Overview

        8.1.3. Global Manufacturing Value Added

        8.1.4. Russia-Ukraine Conflict Impact Outlook

        8.1.5. Global Urbanization Growth Overview

        8.1.6. Global E-Mobility Automotive Industry Outlook

        8.1.7. Road Condition by Country

    8.2. Forecast Factors - Relevance & Impact

        8.2.1. Government Schemes for eco-friendly vehicles

        8.2.2. Steadily Increasing Electric Charging Infrastructure

        8.2.3. Manufacturing Industry Value Added

        8.2.4. Increasing Urbanization Growth Outlook

        8.2.5. GDP Growth Outlook

        8.2.6. Per Capita Income Growth

        8.2.7. Other Forecast Factors

    8.3. Value Chain

        8.3.1. List of Manufacturers

        8.3.2. List of Distributors and Trader

        8.3.3. List of Suppliers

    8.4. COVID-19 Crisis – Impact Assessment

        8.4.1. Current Statistics

        8.4.2. Short-Mid-Long Term Outlook

        8.4.3. Likely Rebound

    8.5. Market Dynamics

        8.5.1. Drivers

        8.5.2. Restraints

        8.5.3. Opportunity Analysis

9. Global Market Analysis 2018 to 2022 and Forecast 2023 to 2033, By Product Type

    9.1. Introduction / Key Findings

    9.2. Historical Market Size (US$ Million) and Volume Analysis By Product Type, 2018 to 2022

    9.3. Current and Future Market Size (US$ Million) and Volume Analysis and Forecast By Product Type, 2023 to 2033

        9.3.1. Isolated

        9.3.2. Non Isolated

    9.4. Market Attractiveness Analysis By Product Type

10. Global Market Analysis 2018 to 2022 and Forecast 2023 to 2033, By Voltage

    10.1. Introduction / Key Findings

    10.2. Historical Market Size (US$ Million) and Volume Analysis By Voltage, 2018 to 2022

    10.3. Current and Future Market Size (US$ Million) and Volume Analysis and Forecast By Voltage, 2023 to 2033

        10.3.1. 3V-14V

        10.3.2. 15V-36V

        10.3.3. 36V-75V

        10.3.4. >75 V

    10.4. Market Attractiveness Analysis By Voltage

11. Global Market Analysis 2018 to 2022 and Forecast 2023 to 2033, By Form Factor

    11.1. Introduction / Key Findings

    11.2. Historical Market Size (US$ Million) and Volume Analysis By Form Factor, 2018 to 2022

    11.3. Current and Future Market Size (US$ Million) and Volume Analysis and Forecast By Form Factor, 2023 to 2033

        11.3.1. Full Brick

        11.3.2. Half Brick

        11.3.3. Quarter Brick

        11.3.4. Eight Brick

        11.3.5. Sixteen Brick

        11.3.6. Others

    11.4. Market Attractiveness Analysis By Form Factor

12. Global Market Analysis 2018 to 2022 and Forecast 2023 to 2033, By Output Power

    12.1. Introduction / Key Findings

    12.2. Historical Market Size (US$ Million) and Volume Analysis By Output Power, 2018 to 2022

    12.3. Current and Future Market Size (US$ Million) and Volume Analysis and Forecast By Output Power, 2023 to 2033

        12.3.1. 0.25-250 W

        12.3.2. 250-500 W

        12.3.3. 500 -1000 W

        12.3.4. >1000W

    12.4. Market Attractiveness Analysis By Output Power

13. Global Market Analysis 2018 to 2022 and Forecast 2023 to 2033, By Vehicle Type

    13.1. Introduction / Key Findings

    13.2. Historical Market Size (US$ Million) and Volume Analysis By Vehicle Type, 2018 to 2022

    13.3. Current and Future Market Size (US$ Million) and Volume Analysis and Forecast By Vehicle Type, 2023 to 2033

        13.3.1. NEV

        13.3.2. BEV

        13.3.3. HEV

        13.3.4. PHEV

        13.3.5. FCEV

    13.4. Market Attractiveness Analysis By Vehicle Type

14. Global Market Analysis 2018 to 2022 and Forecast 2023 to 2033, By Sales Channel

    14.1. Introduction / Key Findings

    14.2. Historical Market Size (US$ Million) and Volume Analysis By Sales Channel, 2018 to 2022

    14.3. Current and Future Market Size (US$ Million) and Volume Analysis and Forecast By Sales Channel, 2023 to 2033

        14.3.1. First Fit

        14.3.2. Aftermarket

    14.4. Market Attractiveness Analysis By Sales Channel

15. Global Market Analysis 2018 to 2022 and Forecast 2023 to 2033, by Region

    15.1. Introduction

    15.2. Historical Market Size (US$ Million) and Volume Analysis By Region, 2018 to 2022

    15.3. Current Market Size (US$ Million) and Volume Analysis and Forecast By Region, 2023 to 2033

        15.3.1. North America

        15.3.2. Latin America

        15.3.3. Europe

        15.3.4. East Asia

        15.3.5. South Asia & Pacific

        15.3.6. Middle East & Africa

    15.4. Market Attractiveness Analysis By Region

16. North America Market Analysis 2018 to 2022 and Forecast 2023 to 2033

    16.1. Introduction

    16.2. Pricing Analysis

    16.3. Historical Market Size (US$ Million) and Volume Analysis By Market Taxonomy, 2018 to 2022

    16.4. Market Size (US$ Million) Forecast By Market Taxonomy, 2023 to 2033

        16.4.1. By Country

            16.4.1.1. United States

            16.4.1.2. Canada

        16.4.2. By Product Type

        16.4.3. By Voltage

        16.4.4. By Form Factor

        16.4.5. By Output Power

        16.4.6. By Vehicle Type

        16.4.7. By Sales Channel

    16.5. Market Attractiveness Analysis

        16.5.1. By Country

        16.5.2. By Product Type

        16.5.3. By Voltage

        16.5.4. By Form Factor

        16.5.5. By Output Power

        16.5.6. By Vehicle Type

        16.5.7. By Sales Channel

17. Latin America Market Analysis 2018 to 2022 and Forecast 2023 to 2033

    17.1. Introduction

    17.2. Pricing Analysis

    17.3. Historical Market Size (US$ Million) and Volume Analysis By Market Taxonomy, 2018 to 2022

    17.4. Market Size (US$ Million) Forecast By Market Taxonomy, 2023 to 2033

        17.4.1. By Country

            17.4.1.1. Brazil

            17.4.1.2. Mexico

            17.4.1.3. Rest of Latin America

        17.4.2. By Product Type

        17.4.3. By Voltage

        17.4.4. By Form Factor

        17.4.5. By Output Power

        17.4.6. By Vehicle Type

        17.4.7. By Sales Channel

    17.5. Market Attractiveness Analysis

        17.5.1. By Country

        17.5.2. By Product Type

        17.5.3. By Voltage

        17.5.4. By Form Factor

        17.5.5. By Output Power

        17.5.6. By Vehicle Type

        17.5.7. By Sales Channel

18. Europe Market Analysis 2018 to 2022 and Forecast 2023 to 2033

    18.1. Introduction

    18.2. Pricing Analysis

    18.3. Historical Market Size (US$ Million) and Volume Analysis By Market Taxonomy, 2018 to 2022

    18.4. Market Size (US$ Million) Forecast By Market Taxonomy, 2023 to 2033

        18.4.1. By Country

            18.4.1.1. Germany

            18.4.1.2. Italy

            18.4.1.3. France

            18.4.1.4. United Kingdom

            18.4.1.5. Spain

            18.4.1.6. BENELUX

            18.4.1.7. Russia

            18.4.1.8. Rest of Europe

        18.4.2. By Product Type

        18.4.3. By Voltage

        18.4.4. By Form Factor

        18.4.5. By Output Power

        18.4.6. By Vehicle Type

        18.4.7. By Sales Channel

    18.5. Market Attractiveness Analysis

        18.5.1. By Country

        18.5.2. By Product Type

        18.5.3. By Voltage

        18.5.4. By Form Factor

        18.5.5. By Output Power

        18.5.6. By Vehicle Type

        18.5.7. By Sales Channel

19. East Asia Market Analysis 2018 to 2022 and Forecast 2023 to 2033

    19.1. Introduction

    19.2. Pricing Analysis

    19.3. Historical Market Size (US$ Million) and Volume Analysis By Market Taxonomy, 2018 to 2022

    19.4. Market Size (US$ Million) Forecast By Market Taxonomy, 2023 to 2033

        19.4.1. By Country

            19.4.1.1. China

            19.4.1.2. Japan

            19.4.1.3. South Korea

        19.4.2. By Product Type

        19.4.3. By Voltage

        19.4.4. By Form Factor

        19.4.5. By Output Power

        19.4.6. By Vehicle Type

        19.4.7. By Sales Channel

    19.5. Market Attractiveness Analysis

        19.5.1. By Country

        19.5.2. By Product Type

        19.5.3. By Voltage

        19.5.4. By Form Factor

        19.5.5. By Output Power

        19.5.6. By Vehicle Type

        19.5.7. By Sales Channel

20. South Asia & Pacific Market Analysis 2018 to 2022 and Forecast 2023 to 2033

    20.1. Introduction

    20.2. Pricing Analysis

    20.3. Historical Market Size (US$ Million) and Volume Analysis By Market Taxonomy, 2018 to 2022

    20.4. Market Size (US$ Million) Forecast By Market Taxonomy, 2023 to 2033

        20.4.1. By Country

            20.4.1.1. India

            20.4.1.2. ASEAN

            20.4.1.3. Australia and New Zealand

            20.4.1.4. Rest of South Asia & Pacific

        20.4.2. By Country

        20.4.3. By Product Type

        20.4.4. By Voltage

        20.4.5. By Form Factor

        20.4.6. By Output Power

        20.4.7. By Vehicle Type

        20.4.8. By Sales Channel

    20.5. Market Attractiveness Analysis

        20.5.1. By Country

        20.5.2. By Product Type

        20.5.3. By Voltage

        20.5.4. By Form Factor

        20.5.5. By Output Power

        20.5.6. By Vehicle Type

        20.5.7. By Sales Channel

21. Middle East and Africa Market Analysis 2018 to 2022 and Forecast 2023 to 2033

    21.1. Introduction

    21.2. Pricing Analysis

    21.3. Historical Market Size (US$ Million) and Volume Analysis By Market Taxonomy, 2018 to 2022

    21.4. Market Size (US$ Million) Forecast By Market Taxonomy, 2023 to 2033

        21.4.1. By Country

            21.4.1.1. GCC Countries

            21.4.1.2. Türkiye

            21.4.1.3. Northern Africa

            21.4.1.4. South Africa

            21.4.1.5. Rest of Middle East and Africa

        21.4.2. By Product Type

        21.4.3. By Voltage

        21.4.4. By Form Factor

        21.4.5. By Output Power

        21.4.6. By Vehicle Type

        21.4.7. By Sales Channel

    21.5. Market Attractiveness Analysis

        21.5.1. By Country

        21.5.2. By Product Type

        21.5.3. By Voltage

        21.5.4. By Form Factor

        21.5.5. By Output Power

        21.5.6. By Vehicle Type

        21.5.7. By Sales Channel

22. Country-wise Market Analysis

    22.1. Introduction

        22.1.1. Market Value Proportion Analysis, By Key Countries

        22.1.2. Global Vs. Country Growth Comparison

    22.2. United States Market Analysis

        22.2.1. By Product Type

        22.2.2. By Voltage

        22.2.3. By Form Factor

        22.2.4. By Output Power

        22.2.5. By Vehicle Type

        22.2.6. By Sales Channel

    22.3. Canada Market Analysis

        22.3.1. By Product Type

        22.3.2. By Voltage

        22.3.3. By Form Factor

        22.3.4. By Output Power

        22.3.5. By Vehicle Type

        22.3.6. By Sales Channel

    22.4. Mexico Market Analysis

        22.4.1. By Product Type

        22.4.2. By Voltage

        22.4.3. By Form Factor

        22.4.4. By Output Power

        22.4.5. By Vehicle Type

        22.4.6. By Sales Channel

    22.5. Brazil Market Analysis

        22.5.1. By Product Type

        22.5.2. By Voltage

        22.5.3. By Form Factor

        22.5.4. By Output Power

        22.5.5. By Vehicle Type

        22.5.6. By Sales Channel

    22.6. Germany Market Analysis

        22.6.1. By Product Type

        22.6.2. By Voltage

        22.6.3. By Form Factor

        22.6.4. By Output Power

        22.6.5. By Vehicle Type

        22.6.6. By Sales Channel

    22.7. Italy Market Analysis

        22.7.1. By Product Type

        22.7.2. By Voltage

        22.7.3. By Form Factor

        22.7.4. By Output Power

        22.7.5. By Vehicle Type

        22.7.6. By Sales Channel

    22.8. France Market Analysis

        22.8.1. By Product Type

        22.8.2. By Voltage

        22.8.3. By Form Factor

        22.8.4. By Output Power

        22.8.5. By Vehicle Type

        22.8.6. By Sales Channel

    22.9. United Kingdom Market Analysis

        22.9.1. By Product Type

        22.9.2. By Voltage

        22.9.3. By Form Factor

        22.9.4. By Output Power

        22.9.5. By Vehicle Type

        22.9.6. By Sales Channel

    22.10. Benelux Market Analysis

        22.10.1. By Product Type

        22.10.2. By Voltage

        22.10.3. By Form Factor

        22.10.4. By Output Power

        22.10.5. By Vehicle Type

        22.10.6. By Sales Channel

    22.11. Spain Market Analysis

        22.11.1. By Product Type

        22.11.2. By Voltage

        22.11.3. By Form Factor

        22.11.4. By Output Power

        22.11.5. By Vehicle Type

        22.11.6. By Sales Channel

    22.12. Russia Market Analysis

        22.12.1. By Product Type

        22.12.2. By Voltage

        22.12.3. By Form Factor

        22.12.4. By Output Power

        22.12.5. By Vehicle Type

        22.12.6. By Sales Channel

    22.13. China Market Analysis

        22.13.1. By Product Type

        22.13.2. By Voltage

        22.13.3. By Form Factor

        22.13.4. By Output Power

        22.13.5. By Vehicle Type

        22.13.6. By Sales Channel

    22.14. Japan Market Analysis

        22.14.1. By Product Type

        22.14.2. By Voltage

        22.14.3. By Form Factor

        22.14.4. By Output Power

        22.14.5. By Vehicle Type

        22.14.6. By Sales Channel

    22.15. S. Korea Market Analysis

        22.15.1. By Product Type

        22.15.2. By Voltage

        22.15.3. By Form Factor

        22.15.4. By Output Power

        22.15.5. By Vehicle Type

        22.15.6. By Sales Channel

    22.16. India Market Analysis

        22.16.1. By Product Type

        22.16.2. By Voltage

        22.16.3. By Form Factor

        22.16.4. By Output Power

        22.16.5. By Vehicle Type

        22.16.6. By Sales Channel

    22.17. ASEAN Market Analysis

        22.17.1. By Product Type

        22.17.2. By Voltage

        22.17.3. By Form Factor

        22.17.4. By Output Power

        22.17.5. By Vehicle Type

        22.17.6. By Sales Channel

    22.18. Australia and New Zealand Market Analysis

        22.18.1. By Product Type

        22.18.2. By Voltage

        22.18.3. By Form Factor

        22.18.4. By Output Power

        22.18.5. By Vehicle Type

        22.18.6. By Sales Channel

    22.19. GCC Countries Market Analysis

        22.19.1. By Product Type

        22.19.2. By Voltage

        22.19.3. By Form Factor

        22.19.4. By Output Power

        22.19.5. By Vehicle Type

        22.19.6. By Sales Channel

    22.20. Northern Africa Market Analysis

        22.20.1. By Product Type

        22.20.2. By Voltage

        22.20.3. By Form Factor

        22.20.4. By Output Power

        22.20.5. By Vehicle Type

        22.20.6. By Sales Channel

    22.21. Türkiye Market Analysis

        22.21.1. By Product Type

        22.21.2. By Voltage

        22.21.3. By Form Factor

        22.21.4. By Output Power

        22.21.5. By Vehicle Type

        22.21.6. By Sales Channel

    22.22. South Africa Market Analysis

        22.22.1. By Product Type

        22.22.2. By Voltage

        22.22.3. By Form Factor

        22.22.4. By Output Power

        22.22.5. By Vehicle Type

        22.22.6. By Sales Channel

23. Market Structure Analysis

    23.1. Market Analysis by Tier of Companies

    23.2. Market Concentration

    23.3. Market Share Analysis of Top Players

    23.4. Market Presence Analysis

24. Competition Analysis

    24.1. Competition Dashboard

    24.2. Competition Benchmarking

    24.3. Competition Deep Dive

        24.3.1. Texas Instruments

            24.3.1.1. Overview

            24.3.1.2. Profitability by Market Segments (Product Type/Voltage/Form Factor/Output Power/Vehicle Type/Sales Channel/Region)

            24.3.1.3. Sales Footprint

            24.3.1.4. Strategy Overview

        24.3.2. Infineon Technologies AG

            24.3.2.1. Overview

            24.3.2.2. Profitability by Market Segments (Product Type/Voltage/Form Factor/Output Power/Vehicle Type/Sales Channel/Region)

            24.3.2.3. Sales Footprint

            24.3.2.4. Strategy Overview

        24.3.3. STMicroelectronics

            24.3.3.1. Overview

            24.3.3.2. Profitability by Market Segments (Product Type/Voltage/Form Factor/Output Power/Vehicle Type/Sales Channel/Region)

            24.3.3.3. Sales Footprint

            24.3.3.4. Strategy Overview

        24.3.4. Murata Manufacturing Co. Ltd.

            24.3.4.1. Overview

            24.3.4.2. Profitability by Market Segments (Product Type/Voltage/Form Factor/Output Power/Vehicle Type/Sales Channel/Region)

            24.3.4.3. Sales Footprint

            24.3.4.4. Strategy Overview

        24.3.5. BEL FUSE INC.

            24.3.5.1. Overview

            24.3.5.2. Profitability by Market Segments (Product Type/Voltage/Form Factor/Output Power/Vehicle Type/Sales Channel/Region)

            24.3.5.3. Sales Footprint

            24.3.5.4. Strategy Overview

        24.3.6. Vicor Corporation

            24.3.6.1. Overview

            24.3.6.2. Profitability by Market Segments (Product Type/Voltage/Form Factor/Output Power/Vehicle Type/Sales Channel/Region)

            24.3.6.3. Sales Footprint

            24.3.6.4. Strategy Overview

        24.3.7. FUJITSU

            24.3.7.1. Overview

            24.3.7.2. Profitability by Market Segments (Product Type/Voltage/Form Factor/Output Power/Vehicle Type/Sales Channel/Region)

            24.3.7.3. Sales Footprint

            24.3.7.4. Strategy Overview

        24.3.8. TOSHIBA

            24.3.8.1. Overview

            24.3.8.2. Profitability by Market Segments (Product Type/Voltage/Form Factor/Output Power/Vehicle Type/Sales Channel/Region)

            24.3.8.3. Sales Footprint

            24.3.8.4. Strategy Overview

        24.3.9. Semtech Corporation

            24.3.9.1. Overview

            24.3.9.2. Profitability by Market Segments (Product Type/Voltage/Form Factor/Output Power/Vehicle Type/Sales Channel/Region)

            24.3.9.3. Sales Footprint

            24.3.9.4. Strategy Overview

        24.3.10. Analog Devices Inc.

            24.3.10.1. Overview

            24.3.10.2. Profitability by Market Segments (Product Type/Voltage/Form Factor/Output Power/Vehicle Type/Sales Channel/Region)

            24.3.10.3. Sales Footprint

            24.3.10.4. Strategy Overview

        24.3.11. TDK Corp

            24.3.11.1. Overview

            24.3.11.2. Profitability by Market Segments (Product Type/Voltage/Form Factor/Output Power/Vehicle Type/Sales Channel/Region)

            24.3.11.3. Sales Footprint

            24.3.11.4. Strategy Overview

        24.3.12. Silver Atena GmbH

            24.3.12.1. Overview

            24.3.12.2. Profitability by Market Segments (Product Type/Voltage/Form Factor/Output Power/Vehicle Type/Sales Channel/Region)

            24.3.12.3. Sales Footprint

            24.3.12.4. Strategy Overview

25. Assumptions and Acronyms Used

26. Research Methodology

List of Tables

Table 01: Global Market Value (US$ Million) and Volume (‘000 units) Historical Data 2018 to 2022 and Forecast 2023 to 2033 By Product Type

Table 02: Global Market Value (US$ Million) and Volume Historical Data 2018 to 2022 and Forecast 2023 to 2033 By Voltage

Table 03: Global Market Value (US$ Million) and Volume (Units) Historical Data 2018 to 2022 and Forecast 2023 to 2033 By Form Factor

Table 04: Global Market Value (US$ Million) and Volume Historical Data 2018 to 2022 and Forecast 2023 to 2033 By Vehicle Type

Table 05: Global Market Value (US$ Million) and Volume Historical Data 2018 to 2022 and Forecast 2023 to 2033 By Power Output

Table 06: Global Market Value (US$ Million) and Volume (‘000 units) Historical Data 2018 to 2022 and Forecast 2023 to 2033 By Sales Channel

Table 07: Global Market Value (US$ Million) and Volume ('000 Units) Historical Data 2018 to 2022 and Forecast 2023 to 2033 By Region

Table 08: North America Market Value (US$ Million) and Volume ('000 Units) Historical Data 2018 to 2022 and Forecast 2023 to 2033 By Country

Table 09: North America Market Value (US$ Million) and Volume (‘000 units) Historical Data 2018 to 2022 and Forecast 2023 to 2033 By Product Type

Table 10: North America Market Value (US$ Million) and Volume Historical Data 2018 to 2022 and Forecast 2023 to 2033 By Voltage

Table 11: North America Market Value (US$ Million) and Volume (Units) Historical Data 2018 to 2022 and Forecast 2023 to 2033 By Form Factor

Table 12: North America Market Value (US$ Million) and Volume Historical Data 2018 to 2022 and Forecast 2023 to 2033 By Vehicle Type

Table 13: North America Market Value (US$ Million) and Volume Historical Data 2018 to 2022 and Forecast 2023 to 2033 By Power Output

Table 14: North America Market Value (US$ Million) and Volume (‘000 units) Historical Data 2018 to 2022 and Forecast 2023 to 2033 By Sales Channel

Table 15: Latin America Market Value (US$ Million) and Volume ('000 Units) Historical Data 2018 to 2022 and Forecast 2023 to 2033 By Country

Table 16: Latin America Market Value (US$ Million) and Volume (‘000 units) Historical Data 2018 to 2022 and Forecast 2023 to 2033 By Product Type

Table 17: Latin America Market Value (US$ Million) and Volume Historical Data 2018 to 2022 and Forecast 2023 to 2033 By Voltage

Table 18: Latin America Market Value (US$ Million) and Volume (Units) Historical Data 2018 to 2022 and Forecast 2023 to 2033 By Form Factor

Table 19: Latin America Market Value (US$ Million) and Volume Historical Data 2018 to 2022 and Forecast 2023 to 2033 By Vehicle Type

Table 20: Latin America Market Value (US$ Million) and Volume Historical Data 2018 to 2022 and Forecast 2023 to 2033 By Power Output

Table 21: Latin America Market Value (US$ Million) and Volume (‘000 units) Historical Data 2018 to 2022 and Forecast 2023 to 2033 By Sales Channel

Table 22: Europe Market Value (US$ Million) and Volume ('000 Units) Historical Data 2018 to 2022 and Forecast 2023 to 2033 By Country

Table 23: Europe Market Value (US$ Million) and Volume (‘000 units) Historical Data 2018 to 2022 and Forecast 2023 to 2033 By Product Type

Table 24: Europe Market Value (US$ Million) and Volume Historical Data 2018 to 2022 and Forecast 2023 to 2033 By Voltage

Table 25: Europe Market Value (US$ Million) and Volume (Units) Historical Data 2018 to 2022 and Forecast 2023 to 2033 By Form Factor

Table 26: Europe Market Value (US$ Million) and Volume Historical Data 2018 to 2022 and Forecast 2023 to 2033 By Vehicle Type

Table 27: Europe Market Value (US$ Million) and Volume Historical Data 2018 to 2022 and Forecast 2023 to 2033 By Power Output

Table 28: Europe Market Value (US$ Million) and Volume (‘000 units) Historical Data 2018 to 2022 and Forecast 2023 to 2033 By Sales Channel

Table 29: East Asia Market Value (US$ Million) and Volume (‘000 Units) Historical Data 2018 to 2022 and Forecast 2023 to 2033 By Country

Table 30: East Asia Market Value (US$ Million) and Volume (‘000 units) Historical Data 2018 to 2022 and Forecast 2023 to 2033 By Product Type

Table 31: East Asia Market Value (US$ Million) and Volume Historical Data 2018 to 2022 and Forecast 2023 to 2033 By Voltage

Table 32: East Asia Market Value (US$ Million) and Volume (Units) Historical Data 2018 to 2022 and Forecast 2023 to 2033 By Form Factor

Table 33: East Asia Market Value (US$ Million) and Volume Historical Data 2018 to 2022 and Forecast 2023 to 2033 By Vehicle Type

Table 34: East Asia Market Value (US$ Million) and Volume Historical Data 2018 to 2022 and Forecast 2023 to 2033 By Power Output

Table 35: East Asia Market Value (US$ Million) and Volume (‘000 units) Historical Data 2018 to 2022 and Forecast 2023 to 2033 By Sales Channel

Table 36: South Asia and Pacific Market Value (US$ Million) and Volume ('000 Units) Historical Data 2018 to 2022 and Forecast 2023 to 2033 By Country

Table 37: South Asia & Pacific Market Value (US$ Million) and Volume (‘000 units) Historical Data 2018 to 2022 and Forecast 2023 to 2033 By Product Type

Table 38: South Asia & Pacific Market Value (US$ Million) and Volume Historical Data 2018 to 2022 and Forecast 2023 to 2033 By Voltage

Table 39: South Asia & Pacific Market Value (US$ Million) and Volume (Units) Historical Data 2018 to 2022 and Forecast 2023 to 2033 By Form Factor

Table 40: South Asia & Pacific Market Value (US$ Million) and Volume Historical Data 2018 to 2022 and Forecast 2023 to 2033 By Vehicle Type

Table 41: South Asia & Pacific Market Value (US$ Million) and Volume Historical Data 2018 to 2022 and Forecast 2023 to 2033 By Power Output

Table 42: South Asia & Pacific Market Value (US$ Million) and Volume (‘000 units) Historical Data 2018 to 2022 and Forecast 2023 to 2033 By Sales Channel

Table 43: Middle East & Africa Market Value (US$ Million) and Volume ('000 Units) Historical Data 2018 to 2022 and Forecast 2023 to 2033 By Country

Table 44: Middle East & Africa Market Value (US$ Million) and Volume (‘000 units) Historical Data 2018 to 2022 and Forecast 2023 to 2033 By Product Type

Table 45: Middle East & Africa Market Value (US$ Million) and Volume Historical Data 2018 to 2022 and Forecast 2023 to 2033 By Voltage

Table 46: Middle East & Africa Market Value (US$ Million) and Volume (Units) Historical Data 2018 to 2022 and Forecast 2023 to 2033 By Form Factor

Table 47: Middle East & Africa Market Value (US$ Million) and Volume Historical Data 2018 to 2022 and Forecast 2023 to 2033 By Vehicle Type

Table 48: Middle East & Africa Market Value (US$ Million) and Volume Historical Data 2018 to 2022 and Forecast 2023 to 2033 By Power Output

Table 49: Middle East & Africa Market Value (US$ Million) and Volume (‘000 units) Historical Data 2018 to 2022 and Forecast 2023 to 2033 By Sales Channel

List of Charts

Figure 01: Global Market Historical Volume (‘000 Units), 2018 to 2022

Figure 02: Global Market Volume (‘000 Units) Forecast, 2023 to 2033

Figure 03: Global Market Historical Value (US$ Million), 2018 to 2022

Figure 04: Global Market Value (US$ Million) Forecast, 2023 to 2033

Figure 05: Global Market Absolute $ Opportunity, 2023 to 2033

Figure 06: Global Market Share and BPS Analysis By Product Type - 2023 & 2033

Figure 07: Global Market Y-o-Y Growth Projection By Product Type, 2023 to 2033

Figure 08: Global Market Attractiveness Index By Product Type, 2023 to 2033

Figure 09: Global Incremental $ Opportunity By Product Type, 2023 to 2033

Figure 10: Global Market Share and BPS Analysis By Voltage - 2023 & 2033

Figure 11: Global Market Y-o-Y Growth Projection By Voltage, 2023 to 2033

Figure 12: Global Market Attractiveness Index By Voltage, 2023 to 2033

Figure 13: Incremental $ Opportunity By Voltage, 2023 to 2033

Figure 14: Global Market Share and BPS Analysis By Form Factor - 2023 & 2033

Figure 15: Global Market Y-o-Y Growth Projection By Form Factor, 2023 to 2033

Figure 16: Global Market Attractiveness Index By Form Factor, 2023 to 2033

Figure 17: Global Incremental $ Opportunity By Form Factor, 2023 to 2033

Figure 18: Global Market Share and BPS Analysis By Vehicle Type- 2023 & 2033

Figure 19: Global Market Y-o-Y Growth Projection By Vehicle Type, 2023 to 2033

Figure 20: Global Market Attractiveness Index By Vehicle Type, 2023 to 2033

Figure 21: Incremental $ Opportunity By Vehicle Type, 2023 to 2033

Figure 22: Global Market Share and BPS Analysis By Power Output - 2023 & 2033

Figure 23: Global Market Y-o-Y Growth Projection By Power Output, 2023 to 2033

Figure 24: Global Market Attractiveness Index By Power Output, 2023 to 2033

Figure 25: Incremental $ Opportunity By Power Output, 2023 to 2033

Figure 26: Global Market Share and BPS Analysis By Sales Channel- 2023 & 2033

Figure 27: Global Market Y-o-Y Growth Projection By Sales Channel, 2023 to 2033

Figure 28: Global Market Attractiveness Index By Sales Channel, 2023 to 2033

Figure 29: Global Incremental $ Opportunity By Sales Channel, 2023 to 2033

Figure 30: Global Market Share and BPS Analysis By Region- 2023 & 2033

Figure 31: Global Market Y-o-Y Growth Projection By Region, 2023 to 2033

Figure 32: Global Market Attractiveness Index By Region, 2023 to 2033

Figure 33: North America Market Share and BPS Analysis By Country- 2023 & 2033

Figure 34: North America Market Y-o-Y Growth Projection By Country, 2023 to 2033

Figure 35: North America Market Attractiveness Index By Country, 2023 to 2033

Figure 36: North America Absolute $ Opportunity By Country, 2023 to 2033

Figure 37: North America Market Share and BPS Analysis By Product Type- 2023 & 2033

Figure 38: North America Market Y-o-Y Growth Projection By Product Type, 2023 to 2033

Figure 39: North America Market Attractiveness Index By Product Type, 2023 to 2033

Figure 40: North America Market Share and BPS Analysis By Voltage- 2023 & 2033

Figure 41: North America Market Y-o-Y Growth Projection By Voltage, 2023 to 2033

Figure 42: North America Market Attractiveness Index By Voltage, 2023 to 2033

Figure 43: North America Market Share and BPS Analysis By Form Factor- 2023 & 2033

Figure 44: North America Market Y-o-Y Growth Projection By Form Factor, 2023 to 2033

Figure 45: North America Market Attractiveness Index By Form Factor, 2023 to 2033

Figure 46: North America Market Share and BPS Analysis By Vehicle Type- 2023 & 2033

Figure 47: North America Market Y-o-Y Growth Projection By Vehicle Type, 2023 to 2033

Figure 48: North America Market Attractiveness Index By Vehicle Type, 2023 to 2033

Figure 49: North America Market Share and BPS Analysis By Power Output- 2023 & 2033

Figure 50: North America Market Y-o-Y Growth Projection By Power Output, 2023 to 2033

Figure 51: North America Market Attractiveness Index By Power Output, 2023 to 2033

Figure 52: North America Market Share and BPS Analysis By Sales Channel- 2023 & 2033

Figure 53: North America Market Y-o-Y Growth Projection By Sales Channel, 2023 to 2033

Figure 54: North America Market Attractiveness Index By Sales Channel, 2023 to 2033

Figure 55: Latin America Market Share and BPS Analysis By Country- 2023 & 2033

Figure 56: Latin America Market Y-o-Y Growth Projection By Country, 2023 to 2033

Figure 57: Latin America Market Attractiveness Index By Country, 2023 to 2033

Figure 58: Latin America Absolute $ Opportunity By Country, 2023 to 2033

Figure 59: Latin America Market Share and BPS Analysis By Product Type- 2023 & 2033

Figure 60: Latin America Market Y-o-Y Growth Projection By Product Type, 2023 to 2033

Figure 61: Latin America Market Attractiveness Index By Product Type, 2023 to 2033

Figure 62: Latin America Market Share and BPS Analysis By Voltage- 2023 & 2033

Figure 63: Latin America Market Y-o-Y Growth Projection By Voltage, 2023 to 2033

Figure 64: Latin America Market Attractiveness Index By Voltage, 2023 to 2033

Figure 65: Latin America Market Share and BPS Analysis By Form Factor- 2023 & 2033

Figure 66: Latin America Market Y-o-Y Growth Projection By Form Factor, 2023 to 2033

Figure 67: Latin America Market Attractiveness Index By Form Factor, 2023 to 2033

Figure 68: Latin America Market Share and BPS Analysis By Vehicle Type- 2023 & 2033

Figure 69: Latin America Market Y-o-Y Growth Projection By Vehicle Type, 2023 to 2033

Figure 70: Latin America Market Attractiveness Index By Vehicle Type, 2023 to 2033

Figure 71: Latin America Market Share and BPS Analysis By Power Output- 2023 & 2033

Figure 72: Latin America Market Y-o-Y Growth Projection By Power Output, 2023 to 2033

Figure 73: Latin America Market Attractiveness Index By Power Output, 2023 to 2033

Figure 74: Latin America Market Share and BPS Analysis By Sales Channel- 2023 & 2033

Figure 75: Latin America Market Y-o-Y Growth Projection By Sales Channel, 2023 to 2033

Figure 76: Latin America Market Attractiveness Index By Sales Channel, 2023 to 2033

Figure 77: Europe Market Share and BPS Analysis By Country- 2023 & 2033

Figure 78: Europe Market Y-o-Y Growth Projection By Country, 2023 to 2033

Figure 79: Europe Market Attractiveness Index By Country, 2023 to 2033

Figure 80: Europe Absolute $ Opportunity By Country, 2023 to 2033

Figure 81: Europe Market Share and BPS Analysis By Product Type- 2023 & 2033

Figure 82: Europe Market Y-o-Y Growth Projection By Product Type, 2023 to 2033

Figure 83: Europe Market Attractiveness Index By Product Type, 2023 to 2033

Figure 84: Europe Market Share and BPS Analysis By Voltage- 2023 & 2033

Figure 85: Europe Market Y-o-Y Growth Projection By Voltage, 2023 to 2033

Figure 86: Europe Market Attractiveness Index By Voltage, 2023 to 2033

Figure 87: Europe Market Share and BPS Analysis By Form Factor- 2023 & 2033

Figure 88: Europe Market Y-o-Y Growth Projection By Form Factor, 2023 to 2033

Figure 89: Europe Market Attractiveness Index By Form Factor, 2023 to 2033

Figure 90: Europe Market Share and BPS Analysis By Vehicle Type- 2023 & 2033

Figure 91: Europe Market Y-o-Y Growth Projection By Vehicle Type, 2023 to 2033

Figure 92: Europe Market Attractiveness Index By Vehicle Type, 2023 to 2033

Figure 93: Europe Market Share and BPS Analysis By Power Output- 2023 & 2033

Figure 94: Europe Market Y-o-Y Growth Projection By Power Output, 2023 to 2033

Figure 95: Europe Market Attractiveness Index By Power Output, 2023 to 2033

Figure 96: Europe Market Share and BPS Analysis By Sales Channel- 2023 & 2033

Figure 97: Europe Market Y-o-Y Growth Projection By Sales Channel, 2023 to 2033

Figure 98: Europe Market Attractiveness Index By Sales Channel, 2023 to 2033

Figure 99: East Asia Market Share and BPS Analysis By Country- 2023 & 2033

Figure 100: East Asia Market Y-o-Y Growth Projection By Country, 2023 to 2033

Figure 101: East Asia Market Attractiveness Index By Country, 2023 to 2033

Figure 102: East Asia Absolute $ Opportunity By Country, 2023 to 2033

Figure 103: East Asia Market Share and BPS Analysis By Product Type- 2023 & 2033

Figure 104: East Asia Market Y-o-Y Growth Projection By Product Type, 2023 to 2033

Figure 105: East Asia Market Attractiveness Index By Product Type, 2023 to 2033

Figure 106: East Asia Market Share and BPS Analysis By Voltage- 2023 & 2033

Figure 107: East Asia Market Y-o-Y Growth Projection By Voltage, 2023 to 2033

Figure 108: East Asia Market Attractiveness Index By Voltage, 2023 to 2033

Figure 109: East Asia Market Share and BPS Analysis By Form Factor- 2023 & 2033

Figure 110: East Asia Market Y-o-Y Growth Projection By Form Factor, 2023 to 2033

Figure 111: East Asia Market Attractiveness Index By Form Factor, 2023 to 2033

Figure 112: East Asia Market Share and BPS Analysis By Vehicle Type- 2023 & 2033

Figure 113: East Asia Market Y-o-Y Growth Projection By Vehicle Type, 2023 to 2033

Figure 114: East Asia Market Attractiveness Index By Vehicle Type, 2023 to 2033

Figure 115: East Asia Market Share and BPS Analysis By Power Output- 2023 & 2033

Figure 116: East Asia Market Y-o-Y Growth Projection By Power Output, 2023 to 2033

Figure 117: East Asia Market Attractiveness Index By Power Output, 2023 to 2033

Figure 118: East Asia Market Share and BPS Analysis By Sales Channel- 2023 & 2033

Figure 119: East Asia Market Y-o-Y Growth Projection By Sales Channel, 2023 to 2033

Figure 120: East Asia Market Attractiveness Index By Sales Channel, 2023 to 2033

Figure 121: South Asia and Pacific Market Share and BPS Analysis By Country- 2023 & 2033

Figure 122: South Asia and Pacific Market Y-o-Y Growth Projection By Country, 2023 to 2033

Figure 123: South Asia and Pacific Market Attractiveness Index By Country, 2023 to 2033

Figure 124: South Asia and Pacific Absolute $ Opportunity By Country, 2023 to 2033

Figure 125: South Asia & Pacific Market Share and BPS Analysis By Product Type- 2023 & 2033

Figure 126: South Asia & Pacific Market Y-o-Y Growth Projection By Product Type, 2023 to 2033

Figure 127: South Asia & Pacific Market Attractiveness Index By Product Type, 2023 to 2033

Figure 128: South Asia & Pacific Market Share and BPS Analysis By Voltage- 2023 & 2033

Figure 129: South Asia & Pacific Market Y-o-Y Growth Projection By Voltage, 2023 to 2033

Figure 130: South Asia & Pacific Market Attractiveness Index By Voltage, 2023 to 2033

Figure 131: South Asia & Pacific Market Share and BPS Analysis By Form Factor- 2023 & 2033

Figure 132: South Asia & Pacific Market Y-o-Y Growth Projection By Form Factor, 2023 to 2033

Figure 133: South Asia & Pacific Market Attractiveness Index By Form Factor, 2023 to 2033

Figure 134: South Asia & Pacific Market Share and BPS Analysis By Vehicle Type- 2023 & 2033

Figure 135: South Asia & Pacific Market Y-o-Y Growth Projection By Vehicle Type, 2023 to 2033

Figure 136: South Asia & Pacific Market Attractiveness Index By Vehicle Type, 2023 to 2033

Figure 137: South Asia & Pacific Market Share and BPS Analysis By Power Output- 2023 & 2033

Figure 138: South Asia & Pacific Market Y-o-Y Growth Projection By Power Output, 2023 to 2033

Figure 139: South Asia & Pacific Market Attractiveness Index By Power Output, 2023 to 2033

Figure 140: South Asia & Pacific Market Share and BPS Analysis By Sales Channel- 2023 & 2033

Figure 141: South Asia & Pacific Market Y-o-Y Growth Projection By Sales Channel, 2023 to 2033

Figure 142: South Asia & Pacific Market Attractiveness Index By Sales Channel, 2023 to 2033

Figure 143: Middle East & Africa Market Share and BPS Analysis By Country- 2023 & 2033

Figure 144: Middle East & Africa Market Y-o-Y Growth Projection By Country, 2023 to 2033

Figure 145: Middle East & Africa Market Attractiveness Index By Country, 2023 to 2033

Figure 146: Middle East & Africa Absolute $ Opportunity By Country, 2023 to 2033

Figure 147: Middle East & Africa Market Share and BPS Analysis By Product Type- 2023 & 2033

Figure 148: Middle East & Africa Market Y-o-Y Growth Projection By Product Type, 2023 to 2033

Figure 149: Middle East & Africa Market Attractiveness Index By Product Type, 2023 to 2033

Figure 150: Middle East & Africa Market Share and BPS Analysis By Voltage- 2023 & 2033

Figure 151: Middle East & Africa Market Y-o-Y Growth Projection By Voltage, 2023 to 2033

Figure 152: Middle East & Africa Market Attractiveness Index By Voltage, 2023 to 2033

Figure 153: Middle East & Africa Market Share and BPS Analysis By Form Factor- 2023 & 2033

Figure 154: Middle East & Africa Market Y-o-Y Growth Projection By Form Factor, 2023 to 2033

Figure 155: Middle East & Africa Market Attractiveness Index By Form Factor, 2023 to 2033

Figure 156: Middle East & Africa Market Share and BPS Analysis By Vehicle Type- 2023 & 2033

Figure 157: Middle East & Africa Market Y-o-Y Growth Projection By Vehicle Type, 2023 to 2033

Figure 158: Middle East & Africa Market Attractiveness Index By Vehicle Type, 2023 to 2033

Figure 159: Middle East & Africa Market Share and BPS Analysis By Power Output- 2023 & 2033

Figure 160: Middle East & Africa Market Y-o-Y Growth Projection By Power Output, 2023 to 2033

Figure 161: Middle East & Africa Market Attractiveness Index By Power Output, 2023 to 2033

Figure 162: Middle East & Africa Market Share and BPS Analysis By Sales Channel- 2023 & 2033

Figure 163: Middle East & Africa Market Y-o-Y Growth Projection By Sales Channel, 2023 to 2033

Figure 164: Middle East & Africa Market Attractiveness Index By Sales Channel, 2023 to 2033

Recommendations

Automotive

Electric Vehicle Battery Market

Published : July 2023

Automotive

Automotive Electronics Market

Published : June 2023

Automotive

APAC Automotive Telematics Market

Published : June 2023

Explore Automotive Insights

View Reports

Automotive DC-DC Converter Market