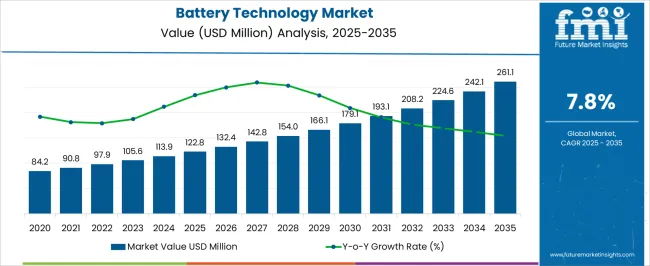
The Battery Technology Market is estimated to be valued at USD 122.8 million in 2025 and is projected to reach USD 261.1 million by 2035, registering a compound annual growth rate (CAGR) of 7.8% over the forecast period.

| Metric | Value |
|---|---|
| Battery Technology Market Estimated Value in (2025 E) | USD 122.8 million |
| Battery Technology Market Forecast Value in (2035 F) | USD 261.1 million |
| Forecast CAGR (2025 to 2035) | 7.8% |
The battery technology market is experiencing robust growth driven by the global shift towards electrification, renewable energy integration, and increasing demand for energy storage solutions. Current market dynamics are shaped by advancements in battery chemistry, efficiency improvements, and declining production costs, while regulatory support for sustainable technologies and incentives for electric vehicle adoption are accelerating uptake.
Rising energy storage requirements across residential, commercial, and industrial sectors, coupled with innovations in battery management systems, are enhancing performance, safety, and lifecycle. The future outlook is characterized by growing investment in next-generation batteries, expansion of production capacities, and increasing penetration of electric mobility solutions in emerging and mature markets.
Growth rationale is anchored on the rising need for high-performance, durable, and scalable energy storage solutions, technological progress in lithium-based and alternative chemistries, and strategic deployment across diverse applications, ensuring the market remains poised for significant expansion and long-term adoption across global energy and transportation sectors.

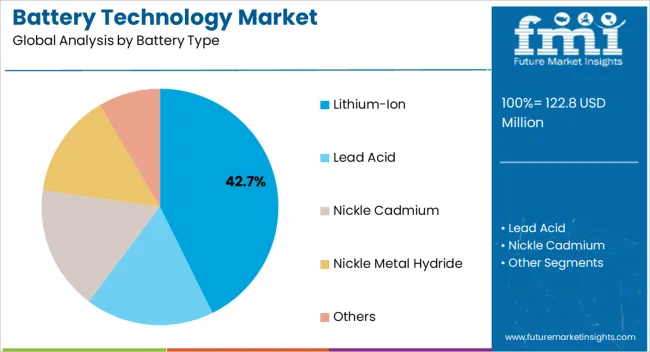
The lithium-ion segment, representing 42.70% of the battery type category, has maintained its leading position due to high energy density, long cycle life, and compatibility with a wide range of applications. Adoption has been supported by ongoing technological enhancements in electrode materials, electrolyte formulations, and thermal management systems.
The segment’s dominance is reinforced by widespread use in electric vehicles, portable electronics, and energy storage systems. Reliability, performance consistency, and scalability have strengthened end-user confidence, while production cost reductions and supply chain optimization have improved accessibility.
Strategic partnerships between battery manufacturers and automotive and industrial players have facilitated broader market penetration Continued innovation and investments in lithium-ion technologies are expected to sustain the segment’s market share and support incremental growth across both established and emerging markets.

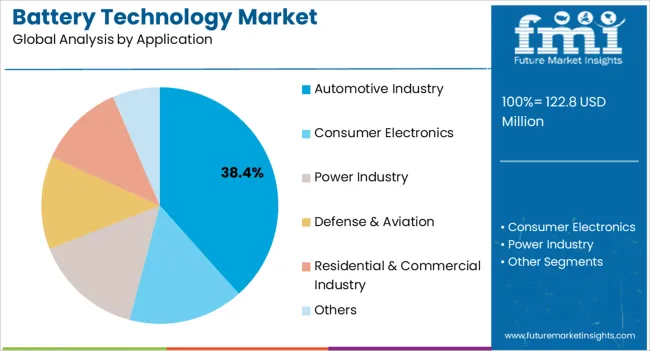
The automotive industry application segment, accounting for 38.40% of the application category, has emerged as the leading driver of market demand due to the global transition towards electric mobility and hybrid vehicles. Adoption is being fueled by increasing consumer preference for sustainable transportation, regulatory mandates on emissions reduction, and growing availability of charging infrastructure.
Battery performance, safety, and range considerations are critical factors influencing purchasing decisions, and manufacturers are prioritizing high-capacity, fast-charging, and long-life solutions. Integration with advanced vehicle management systems has further reinforced segment adoption.
The segment’s growth is supported by strategic collaborations between automakers and battery producers, scale-up of production capacities, and investments in research to enhance performance and reduce costs Over the forecast period, the automotive sector is expected to continue driving substantial growth and maintain its dominance within the battery technology market.
Manufacturers are seizing opportunities through sodium-ion batteries, integration of technologies in vehicles, and other next-generation alternatives. The popularity of clean energy, green solutions, and sustainability is increasing the adoption of battery technology. Manufacturers design cost-effective devices by investing in research and development activities to expand the market reach.
Growing consumer demand for enhanced energy density levels and futuristic storage technology is increasing the adoption of battery technology in the aviation industry. Manufacturers offer portable and high-standardized batteries to improve sustainability and mitigate side reactions. For instance, China-based Tsinghua University is researching to create a battery system by replacing graphite with lithium metal anode for higher energy density.
The global battery technology market secured a valuation of USD 122.8 billion with a CAGR of 10.3% in 2025. The market captured a valuation of USD 84.2.0 billion in 2020. Rising consumer demand for electricity, high-power, smooth chargeable options, and versatile functionality. Automotive manufacturers integrated battery technology for smart devices, motors, and vehicles is gaining vast popularity among consumers.
| Data Points | Battery Technology Market Size, 2025 |
|---|---|
| Market Insights | USD 122.8 billion |
Consumers looking for practical, automated, and smart devices are significantly boosting the global market growth. With rising transportation activities, smart robotic devices such as drones significantly increase manufacturers' demand for battery technology. Innovations bringing better options to develop excellent equipment integrated with advanced technologies such as data analytics are expanding the market growth.
| Countries | CAGR from 2025 to 2035 |
|---|---|
| United States | 8.3% |
| United Kingdom | 8.7% |
| China | 8.5% |
| Japan | 3.1% |
| South Korea | 8.4% |
During the forecast period, China is estimated to secure a CAGR of 8.5% in the global market. Increasing demand for premium, advanced, autonomous, and electric cars is rapidly accelerating the adoption of battery technology in China. The development speed for gadgets and machinery significantly captures a vast revenue in China. The battery and plug-in hybrid electric vehicle sales have sped up in China since 2024 and sold around five times more electric cars than in Germany.
Manufacturers are heavily investing in research and development for innovative batteries to increase the efficiency of vehicles, gadgets, and other devices.
During the forecast period, Japan is estimated to secure a CAGR of 3.1% in the global market. Key companies in Japan are increasing the installation of renewable energy to boost market growth. These players integrate smart battery technology to improve electronic and electric devices. Significant demand for lead-acid batteries from various end users, such as grid storage and transportation, is boosting the market.
Diverse medical, automotive, consumer goods, electric, and electronics industries drive Japan's battery technology market. The government is taking initiatives to promote eco-friendliness with recyclable and reused batteries in Japan. Moreover, due to stringent lead emission standards, the demand for lithium-ion batteries in consumer electronics and cordless electric power tools is further driving the market.
The United Kingdom is estimated to capture a CAGR of 8.7% in the global market during the forecast period. Growing industries, urbanization, changing consumer preferences, and adopting intelligent gadgets expand the United Kingdom battery technology market. Rising population, strict regulations, promoting green products, and affordability are surging the demand for battery technology.
Rising consumer awareness of environmental impact is following sustainable practices to limit carbon emissions and promote recyclable options in the country. The United Kingdom government promotes electric vehicles to reduce toxicity and harmful gases, significantly raising the adoption of battery technology.
The United States is anticipated to secure a CAGR of 8.3% in the global market during the forecast period. Increasing consumer demand for renewable energy is raising the adoption of battery technology in the country. Manufacturers are offering toys, electronic gadgets, smartwatches, and other remote-controlled accessories, which are widely increasing the adoption of battery technology.
Manufacturers are trying to develop high-end and environmentally friendly solution devices for their customers to enhance their experiences. The growing popularity of lithium-ion batteries to reduce carbon and improve energy storage is increasing the adoption of battery technology.
South Korea is projected to capture a compound annual growth rate (CAGR) of 8.4% in the global market. The consumer desire for electric vehicles and automated cars is driving the increasing adoption of battery technology. The growing consumer demand for portable electronics and wearable devices is capturing a significant market share in South Korea.
The rapidly expanding automotive and electronics sectors are gaining immense popularity in South Korea. The key companies in South Korea include Hyundai, Kia, Genesis, and SsangYong. For instance, in 2025, Hyundai launched its seventh-generation Grandeur, which received pre-orders of 110,000 within a month.
Battery-type lead acid is likely to dominate the global market by securing a share of 8% during the forecast period. Increasing consumer demand for high-quality, low-carbon, and fast-efficient energy storage is raising the adoption of lead-acid batteries.
| Battery Type | Lead Acid |
|---|---|
| CAGR 2025 to 2035 | 8% |
Increasing sales of hybrid and electric vehicles are surging the demand for lead-acid batteries among key manufacturers. Moreover, adopting lead-acid batteries is a cost-effective solution to enhance power and performance in the oil & gas, mining, telecom, and chemical industries.
Based on application, the automotive sector is likely to lead the global market by securing a share of 7.8% during the forecast period. Increasing consumer demand for premium cars and standardized automated vehicles fuel the automotive sector. Numerous players focus on sustainable automotive devices to reduce carbon footprints and develop electric cars to promote sustainability.
| Application | Automotive |
|---|---|
| CAGR 2025 to 2035 | 7.8% |
Consumers prefer smart devices, advanced technologies, and real-time monitoring gadgets, which significantly fuel the automotive sector. Key manufacturers widely adopt battery technology for safe, reliable, cost-effective solutions.
The global market is highly competitive because crucial players invest primarily in research to expand the market reach. These players significantly fuel the global market through innovations, technologies, and improved devices to gain consumers' attention. They are focused on versatile, durable, and sustainable practices to drive market growth.
For instance, the government of India is planning to achieve 500 GW of installed power capacity from green energy by 2035. Key players adopt diverse marketing methodologies to capture maximum share, including collaborations and partnerships.

Recent Developments
| Attribute | Details |
|---|---|
| Forecast Period | 2025 to 2035 |
| Historical Data Available for | 2020 to 2025 |
| Market Analysis | USD billion for Value |
| Key Regions Covered | North America; Latin America; Europe; South Asia; East Asia; Oceania; and Middle East & Africa |
| Key Countries Covered | United States, Canada, Brazil, Mexico, Argentina, United Kingdom, Germany, Italy, Russia, Spain, France, BENELUX, India, Thailand, Indonesia, Malaysia, Japan, China, South Korea, Australia, New Zealand, Turkey, South Africa and North Africa |
| Key Market Segments Covered | End Use and Region |
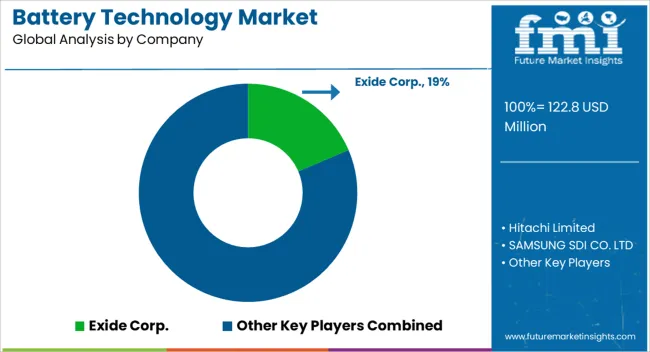
| Key Companies Profiled | Exide Corp.; Hitachi Limited; SAMSUNG SDI CO. LTD; Sony Corp; Google Inc; General Electric Co.; Honda Inc.; Honeywell Batteries; China Bak Battery, Inc; Fujitsu Ltd; American Battery Charging Inc |
| Pricing | Available upon Request |
The global battery technology market is estimated to be valued at USD 122.8 million in 2025.
The market size for the battery technology market is projected to reach USD 261.1 million by 2035.
The battery technology market is expected to grow at a 7.8% CAGR between 2025 and 2035.
The key product types in battery technology market are lithium-ion, lead acid, nickle cadmium, nickle metal hydride and others.
In terms of application, automotive industry segment to command 38.4% share in the battery technology market in 2025.


Our Research Products

The "Full Research Suite" delivers actionable market intel, deep dives on markets or technologies, so clients act faster, cut risk, and unlock growth.

The Leaderboard benchmarks and ranks top vendors, classifying them as Established Leaders, Leading Challengers, or Disruptors & Challengers.

Locates where complements amplify value and substitutes erode it, forecasting net impact by horizon

We deliver granular, decision-grade intel: market sizing, 5-year forecasts, pricing, adoption, usage, revenue, and operational KPIs—plus competitor tracking, regulation, and value chains—across 60 countries broadly.

Spot the shifts before they hit your P&L. We track inflection points, adoption curves, pricing moves, and ecosystem plays to show where demand is heading, why it is changing, and what to do next across high-growth markets and disruptive tech

Real-time reads of user behavior. We track shifting priorities, perceptions of today’s and next-gen services, and provider experience, then pace how fast tech moves from trial to adoption, blending buyer, consumer, and channel inputs with social signals (#WhySwitch, #UX).

Partner with our analyst team to build a custom report designed around your business priorities. From analysing market trends to assessing competitors or crafting bespoke datasets, we tailor insights to your needs.
Supplier Intelligence
Discovery & Profiling
Capacity & Footprint
Performance & Risk
Compliance & Governance
Commercial Readiness
Who Supplies Whom
Scorecards & Shortlists
Playbooks & Docs
Category Intelligence
Definition & Scope
Demand & Use Cases
Cost Drivers
Market Structure
Supply Chain Map
Trade & Policy
Operating Norms
Deliverables
Buyer Intelligence
Account Basics
Spend & Scope
Procurement Model
Vendor Requirements
Terms & Policies
Entry Strategy
Pain Points & Triggers
Outputs
Pricing Analysis
Benchmarks
Trends
Should-Cost
Indexation
Landed Cost
Commercial Terms
Deliverables
Brand Analysis
Positioning & Value Prop
Share & Presence
Customer Evidence
Go-to-Market
Digital & Reputation
Compliance & Trust
KPIs & Gaps
Outputs
Full Research Suite comprises of:
Market outlook & trends analysis
Interviews & case studies
Strategic recommendations
Vendor profiles & capabilities analysis
5-year forecasts
8 regions and 60+ country-level data splits
Market segment data splits
12 months of continuous data updates
DELIVERED AS:
PDF EXCEL ONLINE
Battery Operated Light Market Forecast and Outlook 2025 to 2035
Battery Voltage Recorder Market Size and Share Forecast Outlook 2025 to 2035
Battery Resistance Tester Market Size and Share Forecast Outlook 2025 to 2035
Battery Electric Vehicle (BEV) Market Size and Share Forecast Outlook 2025 to 2035
Battery Separator Paper Market Size and Share Forecast Outlook 2025 to 2035
Battery Cyclers Market Size and Share Forecast Outlook 2025 to 2035
Battery Voltage Supervisor Market Size and Share Forecast Outlook 2025 to 2035
Battery Platforms Market Analysis Size and Share Forecast Outlook 2025 to 2035
Battery Management System Market Report – Growth & Forecast 2025-2035
Battery Binders Market Size and Share Forecast Outlook 2025 to 2035
Battery Materials Recycling Market Size and Share Forecast Outlook 2025 to 2035
Battery Packaging Material Market Size and Share Forecast Outlook 2025 to 2035
Battery Energy Storage System Industry Analysis by Battery Type, Connection Type, Ownership, Energy Capacity, Storage System, Application, and Region through 2025 to 2035
Battery Materials Market: Growth, Trends, and Future Opportunities
Battery Electrolytes Market Analysis & Forecast by Type, End-Use, and Region through 2035
Battery Testing Equipment Market Growth – Trends & Forecast 2025 to 2035
Battery Swapping Charging Infrastructure Market Trends and Forecast 2025 to 2035
Battery Leasing Service Market Analysis & Forecast by Business Model, Battery Type, Vehicle Type, and Region Through 2025 to 2035
Battery-Free Sensors Market Insights - Trends & Forecast 2025 to 2035
Competitive Breakdown of Battery Management System Providers

Thank you!
You will receive an email from our Business Development Manager. Please be sure to check your SPAM/JUNK folder too.
Chat With
MaRIA