Battery Separator Paper Market Size and Share Forecast Outlook (2024 to 2034)

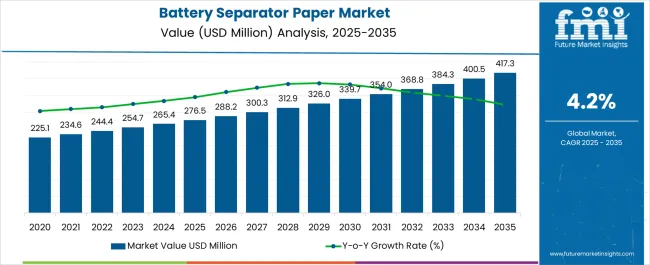
The global battery separator paper market size is expected to expand from USD 265.4 million in 2024 to USD 401.3 million in 2034. From 2024 to 2034, battery separator paper sales are expected to advance at a CAGR of 4.2%.

Owing to the rising need for batteries across numerous industries, the battery separator paper market is expected to continue expanding. Electric vehicles, portable electronics, and energy storage systems are becoming popular, stimulating growth. To improve these batteries' functionality and safety, battery separator paper is essential.

Separator material innovation is driven by advances in battery technology and a focus on sustainability. To satisfy the changing needs of the battery industry, battery separator paper manufacturers should make research and development investments. There is anticipated to be consistent growth in the electrode separator materials market.

Attributes Details
Battery Separator Paper Market Value for 2024 USD 265.4 million
Battery Separator Paper Market Value for 2034 USD 401.3 million
Market CAGR from 2024 to 2034 4.2%

Growth Enablers Pushing the Battery Separator Paper Market Forward

  • An important factor boosting the lithium-ion separator paper industry is the electric vehicle market's rapid expansion. Since EVs need large, effective battery systems, there is a greater need for premium separators.
  • Continuous advancements in the materials, production techniques, and designs of battery separator paper are vital in influencing the market.
  • Stabilizing renewable energy sources increasingly depends on energy storage systems, including home and grid-scale energy storage options. Due to the need for sturdy battery separators for the systems, the battery membrane materials market is expanding.
  • A key driver promoting the electrode separator materials market is the growing need for batteries in various applications, including consumer electronics, renewable energy systems, and electric vehicles. The demand for battery separator paper develops with the growth of these industries.

Impediments Restricting Battery Separator Paper Market Expansion

  • Limited innovation in the battery separator paper industry has the potential to impede the development of sustainable and efficient materials. The lack of innovation might make it difficult for the electrode separator materials market to adapt to the changing needs of the energy storage industry.
  • Alternative materials and technologies compete with battery separator paper. These substitutes might provide better longevity and performance, hindering battery separator paper market expansion.
  • The cost and availability of raw materials, such as synthetic fibers, can fluctuate, which has an impact on battery separator paper pricing and production costs. It may present difficulties for battery separator paper producers.
  • Inconsistent quality in battery separator paper could raise safety issues and erode customer confidence. The need for battery separator membrane manufacturers to invest in quality assurance and control procedures may impede battery separator paper market growth.

Battery Separator Paper Market Demand Analysis (2019 to 2023) Vs Outlook (2024 to 2034)

Steady Growth in the Battery Separator Paper Market from 2019 to 2023

  • The demand for battery separator paper grew steadily, propelled by the growing popularity of portable electronics and electric cars.
  • Separator material technology improvements in terms of performance and safety encouraged electrode separator paper market growth.
  • Due to its thriving battery manufacturing sector, Asia Pacific dominated the battery membrane materials market.
  • The growing interest in recyclable and sustainable lithium-ion battery separator membranes is attributed to environmental concerns.
Attributes Details
Market Value for 2019 USD 227.9 million
Market Value for 2023 USD 255.2 million
Market CAGR from 2019 to 2023 2.9%

Competitive Landscape Evolution in Battery Separator Paper from 2024 to 2034

  • A surge in renewable energy storage solutions is expected to propel significant growth in the lithium-ion separator paper market.
  • The competitive landscape is set to shift due to regional expansion and electrode separator paper market globalization.
  • Environmental regulations may compel the battery separators market to adopt separator materials that are sustainable and eco-friendly.

Category-wise Analysis of the Battery Separator Paper Industry

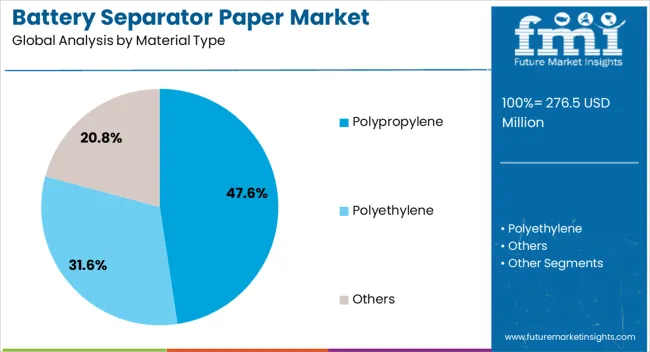
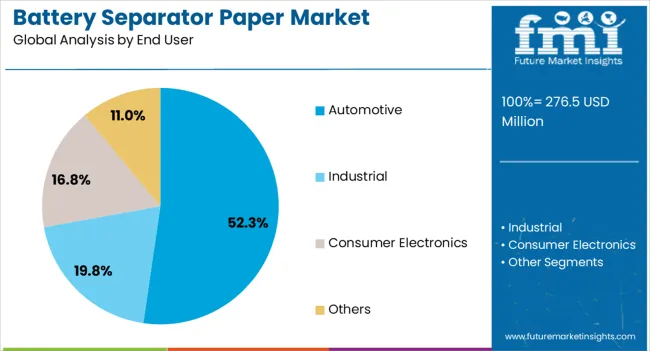
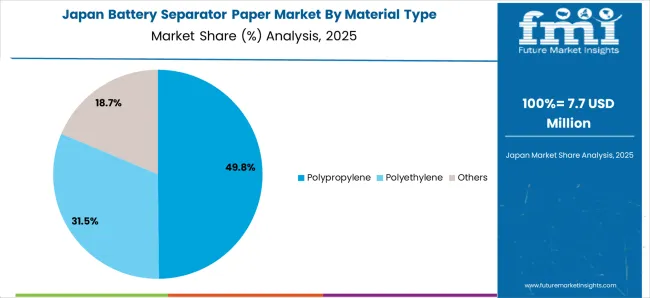
The segmented battery separator paper market analysis is included in the following subsection. Based on comprehensive studies, the polypropylene (PP) battery separator paper sector is leading the material type category, and the automotive segment is commanding the end-use category.

Polypropylene Reigns Supreme in Lithium-ion Battery Separator Membranes Market

  • Owing to its advantages, polypropylene has a dominant battery separator paper industry share, surpassing that of other materials.
  • Polypropylene is the material of choice for manufacturers because of its high performance and low cost, which make it essential in the production of battery separator paper.
Leading Segment Polypropylene (PP) Battery Separator Paper
Segment Share 54.70%
  • In the global battery separator paper industry, polypropylene continues to be a significant player despite the influence of market dynamics on material preference.

Battery Separator Paper Market Prospers with Automotive Sector Leading

  • The growing demand for hybrid and electric vehicles has rocketed the automotive industry to the leading edge of the lithium-ion battery separator membranes market.
  • To improve the performance of the batteries in their electric and hybrid vehicle models, automakers rely on battery separator paper.
Leading Segment Automotive
Segment Share 49.20%
  • The battery separator paper industry share is expanding, partly due to the growth of the automotive industry.

Country-wise Insights into the Battery Separator Paper Industry

The battery separator paper market can be observed in the subsequent tables, which focus on the leading economies in North America, Europe, and Asia Pacific. A comprehensive evaluation demonstrates that Asia Pacific has enormous opportunities due to its resilient manufacturers.

Papering the Path to Power of Battery Separator Market in Asia Pacific

India Market Outlook

  • As interest in EVs and renewable energy evolves, India's demand for battery separator paper has significant growth potential.
  • The domestic battery separator paper manufacturer sector is encouraged to prosper by government policies and incentives.
  • For producers of battery separator paper, India is a desirable place to invest due to its cheap labor costs and growing consumer market.
  • High-quality battery separator paper is in high demand in India due to the country's off-grid energy storage requirements.
  • India’s production of battery separator paper is produced with higher quality because of collaboration with foreign competitors that support technology transfer.

China Market Outlook

  • Due to its expansive manufacturing capabilities and sizable consumer base, China leads the Asia Pacific battery separator paper market.
  • Demand for battery separator paper is fueled in China by the government's push to use electric vehicles.
  • China has a market advantage due to its cheap production costs and plentiful raw materials.
  • The growth of the lead acid battery in China is fueled by rapid industrialization and urbanization.
  • Utilizing sustainable battery separator paper materials is becoming popular nationwide as environmental concerns become prominent.
Attributes Details
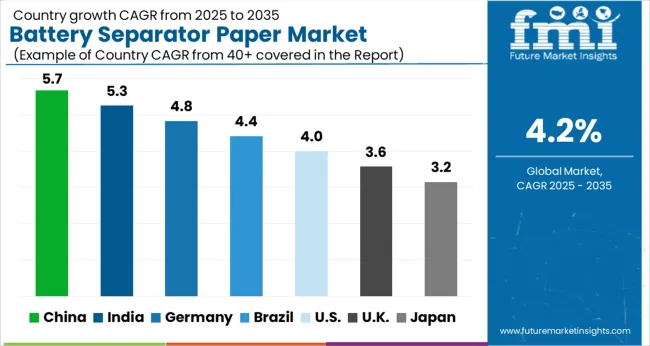
India Market CAGR 6.9%
China Market CAGR 5.3%
Japan Market CAGR 5.0%
Australia Market CAGR 2.0%

Japan Market Outlook

  • The market in Japan benefits from a strong emphasis on innovation and technology, which raises the demand for cutting-edge materials.
  • The adoption of environmentally friendly battery separator paper solutions is encouraged by Japan's strict environmental regulations.
  • Japan's position in the Asia Pacific market is strengthened through collaboration between domestic and international manufacturers.
  • The Japan market is expanding due to the growing demand for electric vehicles (EVs).

Trends in Electrode Separator Materials Powering the Future of North America

The United States Market Outlook

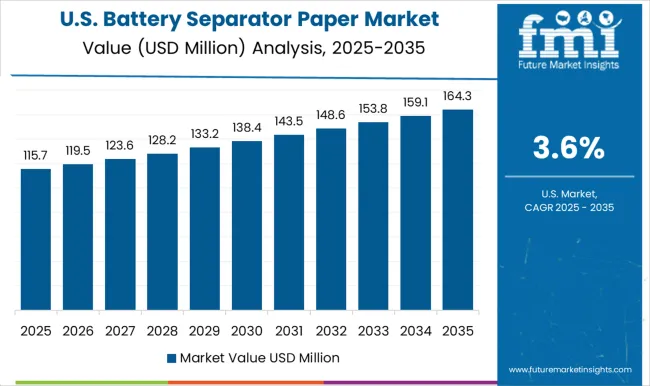
  • The battery separator paper market in the United States is steadily expanding due to the rising popularity of electric cars and renewable energy storage technologies.
  • The demand for battery separator paper is increasing in the United States due to strict environmental laws and a strong emphasis on renewable energy sources.
  • The nation's prominence in the battery separator paper industry can be attributed to the presence of significant battery manufacturers and an increasing focus on research and development initiatives.
Attributes Details
North America Market Share 16.0%
United States Market CAGR 4.00%

Canada Market Outlook

  • The increasing use of electric vehicles and the expansion of renewable energy projects contribute to growth in Canada's battery separator paper market.
  • The demand for battery separator materials in Canada is stimulated by government policies and incentives that support the development of clean energy technologies.
  • To support Canada's green energy objectives, Canadian businesses are increasingly focusing on sustainable and eco-friendly battery separator solutions.

Eco-friendly Sparks of Sustainability Market Trends in Battery Separator Materials in Europe

Germany Market Outlook

  • With a strong emphasis on sustainability and renewable energy, Germany is a significant player in the European battery separator paper market.
  • The nation's well-established automotive industry pushes battery separator demand as it shifts to electric vehicles.
  • Eco-friendly battery separator solutions are becoming increasingly prevalent due to Germany's strict environmental laws and dedication to cutting carbon emissions.
  • Germany's research and development initiatives promote creativity and progress in battery separator material science.
  • The Germany government's encouragement of green technologies and electric vehicles helps the nation's battery separator paper market.
Attributes Details
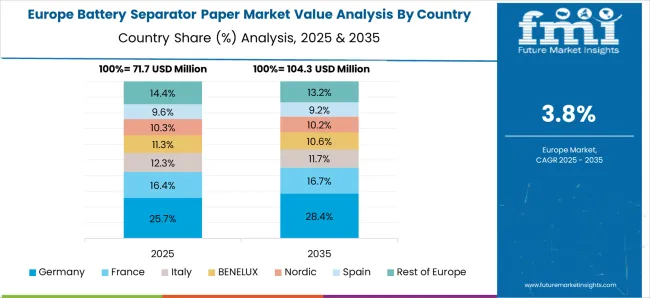
Europe Market Share 14.5%
Germany Market CAGR 3.3%
United Kingdom Market CAGR 3.2%

The United Kingdom Market Outlook

  • Due to the increasing popularity of electric vehicles, battery separator paper is in high demand in the United Kingdom.
  • Investments in clean energy technologies are driven by the United Kingdom's pledge to achieve net-zero carbon emissions by 2050, which is good news for the battery separator paper market.
  • Battery separator paper suppliers benefit from the nation's robust energy storage projects and expanding renewable energy sector.
  • The United Kingdom is encouraging sustainable and recyclable battery separator materials as part of its focus on circular economy principles.

Competitive Landscape of the Battery Separator Paper Market

There is fierce competition among many significant market players in battery separator paper, including both well-established businesses and recently emerged ones. The battery separator paper manufacturers always emphasize innovation, efficient production, and international expansion. The battery separator paper market is growing because of technological developments and sustainability concerns, which create a dynamic environment where businesses work to improve product performance and environmental credentials.

Raw material availability, consumer preferences, and regulatory standards influence the competitive landscape. While niche players look for chances in specialized segments to establish their presence, battery separator paper vendors use partnerships, mergers, acquisitions, and research and development investments to hold onto their market share.

Notable Innovations

Company Details
United States Department of Energy's Battery Materials Processing and Battery Manufacturing In November 2022, the United States Department of Energy's Battery Materials Processing and Battery Manufacturing division declared that it would work with General Motors and Microvast to invest US$ 0.2 billion toward developing customized battery separators for electric vehicles.
ENTEK To satisfy the growing demand for lithium-ion battery separators, ENTEK announced in April 2022 that it would expand in the United States. It is anticipated that ENTEK may finish its first phase of expansion by 2025 and continue to grow until 2027, producing 1.4 billion square meters in total, enough material for the separator to power about 1.4 billion electric vehicles.
ENTEK Adaptive Engineering and Fabrication, a producer of material handling equipment, was purchased by Entek Manufacturing, a reputable manufacturer of separators for lead and lithium-ion batteries, in January 2022. Entek Adaptive, the rebranded company, has become the most recent product line for all material handling businesses owing to this acquisition.
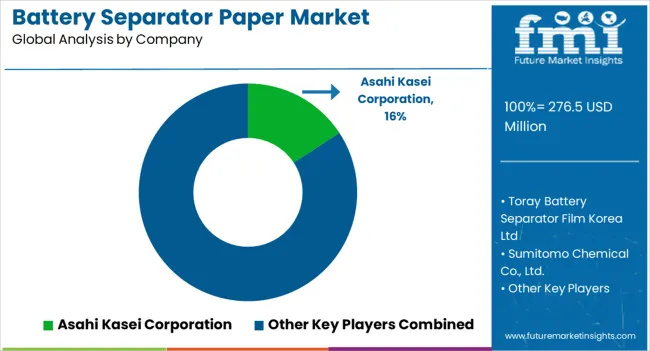
Asahi Kasei Leading manufacturer of LIB separators worldwide, Asahi Kasei, plans to boost Hipore Li-ion battery separator output at its Miyazaki, Japan, facility in March 2021. With production facilities for both wet and dry processes located in the United States and Japan, the company has been actively concentrating on growing its LIB separator business.

Key Manufacturers Leading the Battery Separator Paper Market

  • Toray Battery Separator Film Korea Limited
  • Sumitomo Chemical Co., Ltd.
  • Asahi Kasei Corporation
  • SK Innovation Co., Ltd.
  • Freudenberg Performance Materials
  • ENTEK International, LLC
  • W-Scope Corporation
  • UBE Corporation
  • Bernard Dumas
  • Dow, Inc.
  • Mitsubishi Paper Mills, Ltd.
  • Teijin Limited
  • Eaton Corporation plc
  • Ahlstrom
  • Sinoma Lithium Film Co., Ltd.

Top Segments Covered in the Battery Separator Paper Market Report

By Material Type:

  • Polypropylene
  • Polyethylene
  • Others

By End User:

  • Automotive
  • Industrial
  • Consumer Electronics
  • Others

By Region:

  • North America
  • Latin America
  • Western Europe
  • Eastern Europe
  • South Asia and Pacific
  • East Asia
  • The Middle East and Africa

Table of Content

  • 1. Executive Summary
  • 2. Market Overview
  • 3. Market Background
  • 4. Global Market Analysis 2019 to 2023 and Forecast 2024 to 2034
  • 5. Global Market Analysis 2019 to 2023 and Forecast 2024 to 2034, By Type
    • 5.1. Dry Separator Paper
    • 5.2. Wet Separator Paper
  • 6. Global Market Analysis 2019 to 2023 and Forecast 2024 to 2034, By Application
    • 6.1. Consumer Electronics
    • 6.2. Power Automobile
  • 7. Global Market Analysis 2019 to 2023 and Forecast 2024 to 2034, By Region
    • 7.1. North America
    • 7.2. Latin America
    • 7.3. Western Europe
    • 7.4. Eastern Europe
    • 7.5. South Asia and Pacific
    • 7.6. East Asia
    • 7.7. Middle East and Africa
  • 8. North America Market Analysis 2019 to 2023 and Forecast 2024 to 2034, By Country
  • 9. Latin America Market Analysis 2019 to 2023 and Forecast 2024 to 2034, By Country
  • 10. Western Europe Market Analysis 2019 to 2023 and Forecast 2024 to 2034, By Country
  • 11. Eastern Europe Market Analysis 2019 to 2023 and Forecast 2024 to 2034, By Country
  • 12. South Asia and Pacific Market Analysis 2019 to 2023 and Forecast 2024 to 2034, By Country
  • 13. East Asia Market Analysis 2019 to 2023 and Forecast 2024 to 2034, By Country
  • 14. Middle East and Africa Market Analysis 2019 to 2023 and Forecast 2024 to 2034, By Country
  • 15. Key Countries Market Analysis
  • 16. Market Structure Analysis
  • 17. Competition Analysis
    • 17.1. Asahi Kasei
    • 17.2. SK Innovation
    • 17.3. Toray
    • 17.4. Celgard
    • 17.5. UBE
    • 17.6. Sumitomo Chem
    • 17.7. Entek International
    • 17.8. Evonik
    • 17.9. Mitsubishi Plastics
    • 17.10. W-SCOPE
    • 17.11. Senior Tech
  • 18. Assumptions & Acronyms Used
  • 19. Research Methodology

List of Tables

Table 1: Global Market Value (US$ Million) Forecast by Region, 2019 to 2034

Table 2: Global Market Volume (Units) Forecast by Region, 2019 to 2034

Table 3: Global Market Value (US$ Million) Forecast by Type, 2019 to 2034

Table 4: Global Market Volume (Units) Forecast by Type, 2019 to 2034

Table 5: Global Market Value (US$ Million) Forecast by Application, 2019 to 2034

Table 6: Global Market Volume (Units) Forecast by Application, 2019 to 2034

Table 7: North America Market Value (US$ Million) Forecast by Country, 2019 to 2034

Table 8: North America Market Volume (Units) Forecast by Country, 2019 to 2034

Table 9: North America Market Value (US$ Million) Forecast by Type, 2019 to 2034

Table 10: North America Market Volume (Units) Forecast by Type, 2019 to 2034

Table 11: North America Market Value (US$ Million) Forecast by Application, 2019 to 2034

Table 12: North America Market Volume (Units) Forecast by Application, 2019 to 2034

Table 13: Latin America Market Value (US$ Million) Forecast by Country, 2019 to 2034

Table 14: Latin America Market Volume (Units) Forecast by Country, 2019 to 2034

Table 15: Latin America Market Value (US$ Million) Forecast by Type, 2019 to 2034

Table 16: Latin America Market Volume (Units) Forecast by Type, 2019 to 2034

Table 17: Latin America Market Value (US$ Million) Forecast by Application, 2019 to 2034

Table 18: Latin America Market Volume (Units) Forecast by Application, 2019 to 2034

Table 19: Western Europe Market Value (US$ Million) Forecast by Country, 2019 to 2034

Table 20: Western Europe Market Volume (Units) Forecast by Country, 2019 to 2034

Table 21: Western Europe Market Value (US$ Million) Forecast by Type, 2019 to 2034

Table 22: Western Europe Market Volume (Units) Forecast by Type, 2019 to 2034

Table 23: Western Europe Market Value (US$ Million) Forecast by Application, 2019 to 2034

Table 24: Western Europe Market Volume (Units) Forecast by Application, 2019 to 2034

Table 25: Eastern Europe Market Value (US$ Million) Forecast by Country, 2019 to 2034

Table 26: Eastern Europe Market Volume (Units) Forecast by Country, 2019 to 2034

Table 27: Eastern Europe Market Value (US$ Million) Forecast by Type, 2019 to 2034

Table 28: Eastern Europe Market Volume (Units) Forecast by Type, 2019 to 2034

Table 29: Eastern Europe Market Value (US$ Million) Forecast by Application, 2019 to 2034

Table 30: Eastern Europe Market Volume (Units) Forecast by Application, 2019 to 2034

Table 31: South Asia and Pacific Market Value (US$ Million) Forecast by Country, 2019 to 2034

Table 32: South Asia and Pacific Market Volume (Units) Forecast by Country, 2019 to 2034

Table 33: South Asia and Pacific Market Value (US$ Million) Forecast by Type, 2019 to 2034

Table 34: South Asia and Pacific Market Volume (Units) Forecast by Type, 2019 to 2034

Table 35: South Asia and Pacific Market Value (US$ Million) Forecast by Application, 2019 to 2034

Table 36: South Asia and Pacific Market Volume (Units) Forecast by Application, 2019 to 2034

Table 37: East Asia Market Value (US$ Million) Forecast by Country, 2019 to 2034

Table 38: East Asia Market Volume (Units) Forecast by Country, 2019 to 2034

Table 39: East Asia Market Value (US$ Million) Forecast by Type, 2019 to 2034

Table 40: East Asia Market Volume (Units) Forecast by Type, 2019 to 2034

Table 41: East Asia Market Value (US$ Million) Forecast by Application, 2019 to 2034

Table 42: East Asia Market Volume (Units) Forecast by Application, 2019 to 2034

Table 43: Middle East and Africa Market Value (US$ Million) Forecast by Country, 2019 to 2034

Table 44: Middle East and Africa Market Volume (Units) Forecast by Country, 2019 to 2034

Table 45: Middle East and Africa Market Value (US$ Million) Forecast by Type, 2019 to 2034

Table 46: Middle East and Africa Market Volume (Units) Forecast by Type, 2019 to 2034

Table 47: Middle East and Africa Market Value (US$ Million) Forecast by Application, 2019 to 2034

Table 48: Middle East and Africa Market Volume (Units) Forecast by Application, 2019 to 2034

List of Figures

Figure 1: Global Market Value (US$ Million) by Type, 2024 to 2034

Figure 2: Global Market Value (US$ Million) by Application, 2024 to 2034

Figure 3: Global Market Value (US$ Million) by Region, 2024 to 2034

Figure 4: Global Market Value (US$ Million) Analysis by Region, 2019 to 2034

Figure 5: Global Market Volume (Units) Analysis by Region, 2019 to 2034

Figure 6: Global Market Value Share (%) and BPS Analysis by Region, 2024 to 2034

Figure 7: Global Market Y-o-Y Growth (%) Projections by Region, 2024 to 2034

Figure 8: Global Market Value (US$ Million) Analysis by Type, 2019 to 2034

Figure 9: Global Market Volume (Units) Analysis by Type, 2019 to 2034

Figure 10: Global Market Value Share (%) and BPS Analysis by Type, 2024 to 2034

Figure 11: Global Market Y-o-Y Growth (%) Projections by Type, 2024 to 2034

Figure 12: Global Market Value (US$ Million) Analysis by Application, 2019 to 2034

Figure 13: Global Market Volume (Units) Analysis by Application, 2019 to 2034

Figure 14: Global Market Value Share (%) and BPS Analysis by Application, 2024 to 2034

Figure 15: Global Market Y-o-Y Growth (%) Projections by Application, 2024 to 2034

Figure 16: Global Market Attractiveness by Type, 2024 to 2034

Figure 17: Global Market Attractiveness by Application, 2024 to 2034

Figure 18: Global Market Attractiveness by Region, 2024 to 2034

Figure 19: North America Market Value (US$ Million) by Type, 2024 to 2034

Figure 20: North America Market Value (US$ Million) by Application, 2024 to 2034

Figure 21: North America Market Value (US$ Million) by Country, 2024 to 2034

Figure 22: North America Market Value (US$ Million) Analysis by Country, 2019 to 2034

Figure 23: North America Market Volume (Units) Analysis by Country, 2019 to 2034

Figure 24: North America Market Value Share (%) and BPS Analysis by Country, 2024 to 2034

Figure 25: North America Market Y-o-Y Growth (%) Projections by Country, 2024 to 2034

Figure 26: North America Market Value (US$ Million) Analysis by Type, 2019 to 2034

Figure 27: North America Market Volume (Units) Analysis by Type, 2019 to 2034

Figure 28: North America Market Value Share (%) and BPS Analysis by Type, 2024 to 2034

Figure 29: North America Market Y-o-Y Growth (%) Projections by Type, 2024 to 2034

Figure 30: North America Market Value (US$ Million) Analysis by Application, 2019 to 2034

Figure 31: North America Market Volume (Units) Analysis by Application, 2019 to 2034

Figure 32: North America Market Value Share (%) and BPS Analysis by Application, 2024 to 2034

Figure 33: North America Market Y-o-Y Growth (%) Projections by Application, 2024 to 2034

Figure 34: North America Market Attractiveness by Type, 2024 to 2034

Figure 35: North America Market Attractiveness by Application, 2024 to 2034

Figure 36: North America Market Attractiveness by Country, 2024 to 2034

Figure 37: Latin America Market Value (US$ Million) by Type, 2024 to 2034

Figure 38: Latin America Market Value (US$ Million) by Application, 2024 to 2034

Figure 39: Latin America Market Value (US$ Million) by Country, 2024 to 2034

Figure 40: Latin America Market Value (US$ Million) Analysis by Country, 2019 to 2034

Figure 41: Latin America Market Volume (Units) Analysis by Country, 2019 to 2034

Figure 42: Latin America Market Value Share (%) and BPS Analysis by Country, 2024 to 2034

Figure 43: Latin America Market Y-o-Y Growth (%) Projections by Country, 2024 to 2034

Figure 44: Latin America Market Value (US$ Million) Analysis by Type, 2019 to 2034

Figure 45: Latin America Market Volume (Units) Analysis by Type, 2019 to 2034

Figure 46: Latin America Market Value Share (%) and BPS Analysis by Type, 2024 to 2034

Figure 47: Latin America Market Y-o-Y Growth (%) Projections by Type, 2024 to 2034

Figure 48: Latin America Market Value (US$ Million) Analysis by Application, 2019 to 2034

Figure 49: Latin America Market Volume (Units) Analysis by Application, 2019 to 2034

Figure 50: Latin America Market Value Share (%) and BPS Analysis by Application, 2024 to 2034

Figure 51: Latin America Market Y-o-Y Growth (%) Projections by Application, 2024 to 2034

Figure 52: Latin America Market Attractiveness by Type, 2024 to 2034

Figure 53: Latin America Market Attractiveness by Application, 2024 to 2034

Figure 54: Latin America Market Attractiveness by Country, 2024 to 2034

Figure 55: Western Europe Market Value (US$ Million) by Type, 2024 to 2034

Figure 56: Western Europe Market Value (US$ Million) by Application, 2024 to 2034

Figure 57: Western Europe Market Value (US$ Million) by Country, 2024 to 2034

Figure 58: Western Europe Market Value (US$ Million) Analysis by Country, 2019 to 2034

Figure 59: Western Europe Market Volume (Units) Analysis by Country, 2019 to 2034

Figure 60: Western Europe Market Value Share (%) and BPS Analysis by Country, 2024 to 2034

Figure 61: Western Europe Market Y-o-Y Growth (%) Projections by Country, 2024 to 2034

Figure 62: Western Europe Market Value (US$ Million) Analysis by Type, 2019 to 2034

Figure 63: Western Europe Market Volume (Units) Analysis by Type, 2019 to 2034

Figure 64: Western Europe Market Value Share (%) and BPS Analysis by Type, 2024 to 2034

Figure 65: Western Europe Market Y-o-Y Growth (%) Projections by Type, 2024 to 2034

Figure 66: Western Europe Market Value (US$ Million) Analysis by Application, 2019 to 2034

Figure 67: Western Europe Market Volume (Units) Analysis by Application, 2019 to 2034

Figure 68: Western Europe Market Value Share (%) and BPS Analysis by Application, 2024 to 2034

Figure 69: Western Europe Market Y-o-Y Growth (%) Projections by Application, 2024 to 2034

Figure 70: Western Europe Market Attractiveness by Type, 2024 to 2034

Figure 71: Western Europe Market Attractiveness by Application, 2024 to 2034

Figure 72: Western Europe Market Attractiveness by Country, 2024 to 2034

Figure 73: Eastern Europe Market Value (US$ Million) by Type, 2024 to 2034

Figure 74: Eastern Europe Market Value (US$ Million) by Application, 2024 to 2034

Figure 75: Eastern Europe Market Value (US$ Million) by Country, 2024 to 2034

Figure 76: Eastern Europe Market Value (US$ Million) Analysis by Country, 2019 to 2034

Figure 77: Eastern Europe Market Volume (Units) Analysis by Country, 2019 to 2034

Figure 78: Eastern Europe Market Value Share (%) and BPS Analysis by Country, 2024 to 2034

Figure 79: Eastern Europe Market Y-o-Y Growth (%) Projections by Country, 2024 to 2034

Figure 80: Eastern Europe Market Value (US$ Million) Analysis by Type, 2019 to 2034

Figure 81: Eastern Europe Market Volume (Units) Analysis by Type, 2019 to 2034

Figure 82: Eastern Europe Market Value Share (%) and BPS Analysis by Type, 2024 to 2034

Figure 83: Eastern Europe Market Y-o-Y Growth (%) Projections by Type, 2024 to 2034

Figure 84: Eastern Europe Market Value (US$ Million) Analysis by Application, 2019 to 2034

Figure 85: Eastern Europe Market Volume (Units) Analysis by Application, 2019 to 2034

Figure 86: Eastern Europe Market Value Share (%) and BPS Analysis by Application, 2024 to 2034

Figure 87: Eastern Europe Market Y-o-Y Growth (%) Projections by Application, 2024 to 2034

Figure 88: Eastern Europe Market Attractiveness by Type, 2024 to 2034

Figure 89: Eastern Europe Market Attractiveness by Application, 2024 to 2034

Figure 90: Eastern Europe Market Attractiveness by Country, 2024 to 2034

Figure 91: South Asia and Pacific Market Value (US$ Million) by Type, 2024 to 2034

Figure 92: South Asia and Pacific Market Value (US$ Million) by Application, 2024 to 2034

Figure 93: South Asia and Pacific Market Value (US$ Million) by Country, 2024 to 2034

Figure 94: South Asia and Pacific Market Value (US$ Million) Analysis by Country, 2019 to 2034

Figure 95: South Asia and Pacific Market Volume (Units) Analysis by Country, 2019 to 2034

Figure 96: South Asia and Pacific Market Value Share (%) and BPS Analysis by Country, 2024 to 2034

Figure 97: South Asia and Pacific Market Y-o-Y Growth (%) Projections by Country, 2024 to 2034

Figure 98: South Asia and Pacific Market Value (US$ Million) Analysis by Type, 2019 to 2034

Figure 99: South Asia and Pacific Market Volume (Units) Analysis by Type, 2019 to 2034

Figure 100: South Asia and Pacific Market Value Share (%) and BPS Analysis by Type, 2024 to 2034

Figure 101: South Asia and Pacific Market Y-o-Y Growth (%) Projections by Type, 2024 to 2034

Figure 102: South Asia and Pacific Market Value (US$ Million) Analysis by Application, 2019 to 2034

Figure 103: South Asia and Pacific Market Volume (Units) Analysis by Application, 2019 to 2034

Figure 104: South Asia and Pacific Market Value Share (%) and BPS Analysis by Application, 2024 to 2034

Figure 105: South Asia and Pacific Market Y-o-Y Growth (%) Projections by Application, 2024 to 2034

Figure 106: South Asia and Pacific Market Attractiveness by Type, 2024 to 2034

Figure 107: South Asia and Pacific Market Attractiveness by Application, 2024 to 2034

Figure 108: South Asia and Pacific Market Attractiveness by Country, 2024 to 2034

Figure 109: East Asia Market Value (US$ Million) by Type, 2024 to 2034

Figure 110: East Asia Market Value (US$ Million) by Application, 2024 to 2034

Figure 111: East Asia Market Value (US$ Million) by Country, 2024 to 2034

Figure 112: East Asia Market Value (US$ Million) Analysis by Country, 2019 to 2034

Figure 113: East Asia Market Volume (Units) Analysis by Country, 2019 to 2034

Figure 114: East Asia Market Value Share (%) and BPS Analysis by Country, 2024 to 2034

Figure 115: East Asia Market Y-o-Y Growth (%) Projections by Country, 2024 to 2034

Figure 116: East Asia Market Value (US$ Million) Analysis by Type, 2019 to 2034

Figure 117: East Asia Market Volume (Units) Analysis by Type, 2019 to 2034

Figure 118: East Asia Market Value Share (%) and BPS Analysis by Type, 2024 to 2034

Figure 119: East Asia Market Y-o-Y Growth (%) Projections by Type, 2024 to 2034

Figure 120: East Asia Market Value (US$ Million) Analysis by Application, 2019 to 2034

Figure 121: East Asia Market Volume (Units) Analysis by Application, 2019 to 2034

Figure 122: East Asia Market Value Share (%) and BPS Analysis by Application, 2024 to 2034

Figure 123: East Asia Market Y-o-Y Growth (%) Projections by Application, 2024 to 2034

Figure 124: East Asia Market Attractiveness by Type, 2024 to 2034

Figure 125: East Asia Market Attractiveness by Application, 2024 to 2034

Figure 126: East Asia Market Attractiveness by Country, 2024 to 2034

Figure 127: Middle East and Africa Market Value (US$ Million) by Type, 2024 to 2034

Figure 128: Middle East and Africa Market Value (US$ Million) by Application, 2024 to 2034

Figure 129: Middle East and Africa Market Value (US$ Million) by Country, 2024 to 2034

Figure 130: Middle East and Africa Market Value (US$ Million) Analysis by Country, 2019 to 2034

Figure 131: Middle East and Africa Market Volume (Units) Analysis by Country, 2019 to 2034

Figure 132: Middle East and Africa Market Value Share (%) and BPS Analysis by Country, 2024 to 2034

Figure 133: Middle East and Africa Market Y-o-Y Growth (%) Projections by Country, 2024 to 2034

Figure 134: Middle East and Africa Market Value (US$ Million) Analysis by Type, 2019 to 2034

Figure 135: Middle East and Africa Market Volume (Units) Analysis by Type, 2019 to 2034

Figure 136: Middle East and Africa Market Value Share (%) and BPS Analysis by Type, 2024 to 2034

Figure 137: Middle East and Africa Market Y-o-Y Growth (%) Projections by Type, 2024 to 2034

Figure 138: Middle East and Africa Market Value (US$ Million) Analysis by Application, 2019 to 2034

Figure 139: Middle East and Africa Market Volume (Units) Analysis by Application, 2019 to 2034

Figure 140: Middle East and Africa Market Value Share (%) and BPS Analysis by Application, 2024 to 2034

Figure 141: Middle East and Africa Market Y-o-Y Growth (%) Projections by Application, 2024 to 2034

Figure 142: Middle East and Africa Market Attractiveness by Type, 2024 to 2034

Figure 143: Middle East and Africa Market Attractiveness by Application, 2024 to 2034

Figure 144: Middle East and Africa Market Attractiveness by Country, 2024 to 2034

Frequently Asked Questions

How Big is the Battery Separator Market in 2024?

The battery membrane materials market to secure a valuation of USD 265.4 million in 2024.

How Big Is the Lithium Battery Separator Market by 2034?

The lithium-ion battery separator market is estimated to reach USD 401.3 million by 2034.

What is the Growth Potential of the Electrode Separator Materials Market?

Through 2034, the sales of battery separator films are anticipated to exhibit a 4.2% CAGR.

What Was the Historical Outlook of The Battery Separator Membranes Market?

From 2019 to 2023, the lithium-ion battery separator membranes market recorded a 2.90% HCAGR.

Which Material Type Segment to Dominate in the Lithium-Ion Separator Paper Market?

From 2024 to 2034, the polypropylene (PP) battery separator paper segment captured a 54.7% battery separator paper industry share.

Which End-use Segment to Lead the Electrode Separator Paper Market?

Between 2024 and 2034, the automotive sector is poised to attain a 49.2% battery separator paper industry share.

Explore Paper Packaging Insights

Future Market Insights

Battery Separator Paper Market