Battery Energy Storage System Market Forecast and Outlook from 2025 to 2035

The global battery energy storage system market is anticipated to report a valuation of USD 74.8 billion in 2025 and is projected to reach USD 178.7 billion by 2035, expanding at a compound annual growth rate (CAGR) of 9.1% during the forecast period. Growth in this market is being positively influenced by rising decarbonization goals, increased investments in resilient grid infrastructure, and the need for effective integration of intermittent renewable energy sources.
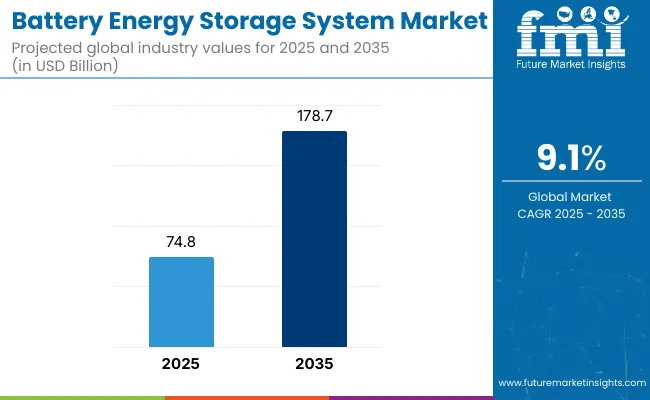
Quick Stats - Battery Energy Storage System Market

  • Industry Value (2025): USD 74.8 billion
  • Forecast Value (2035): USD 178.7 billion
  • Forecast CAGR: 9.1%
  • Leading Segment (2025): Lithium-Ion Batteries (66% share)
  • Key Growth Application: Renewable Energy Integration (39% share)
  • Top Key Players: ABB Ltd., Fluence Energy, Inc., Tesla, Inc., LG Energy Solution, Hitachi Ltd.

Battery Energy Storage System Market

Attributes Key Insights
Estimated Market Value, 2025 USD 74.8 billion
Projected Market Value, 2035 USD 178.7 billion
Market Value CAGR (2025 to 2035) 9.1%

The shift toward cleaner energy portfolios by governments and utilities is driving widespread deployment of battery storage systems to balance supply-demand fluctuations and ensure grid stability. Battery storage is increasingly being used to smooth load curves, provide frequency regulation, and offer backup power during outages, particularly as solar and wind generation expands globally.

Spending on grid modernization, especially in advanced economies across North America, Europe, and East Asia, has created demand for scalable and modular storage systems that enhance grid flexibility. In emerging economies, distributed energy storage is enabling rural electrification and reducing dependency on diesel generators, supporting sustainability and energy access goals.

The declining cost of lithium-ion batteries, advancements in alternative chemistries like sodium-ion and solid-state batteries, and supportive policy frameworks are further accelerating commercial adoption. Incentive programs, capacity payment models, and energy arbitrage opportunities are helping utilities, commercial entities, and industrial users to deploy battery energy storage as a cost-saving and reliability-enhancing solution.

Battery energy storage systems are becoming a strategic asset in energy transition strategies, offering value not only in grid-connected applications but also in microgrids, electric vehicle charging infrastructure, and behind-the-meter storage for commercial and residential users. Continued innovation in battery management systems (BMS), thermal control, and digital energy platforms is expected to enhance performance, safety, and return on investment for storage assets over the next decade.
Analyzing Battery Energy Storage System Market by Top Investment Segments

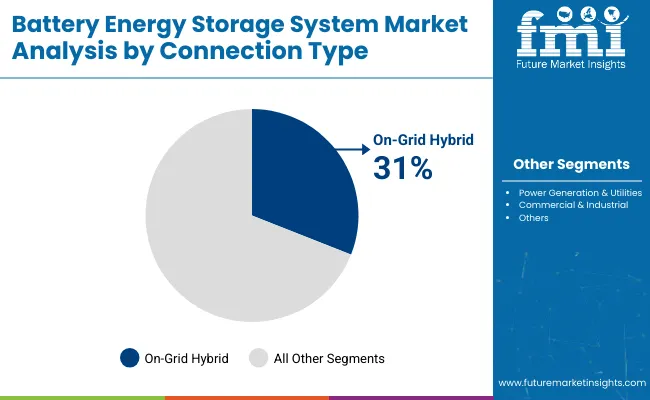
On-Grid Hybrid Renewable Systems Dominate Front-of-Meter Installations

Battery Energy Storage System Market Analysis By Connection Type

Hybrid renewable systems under the on-grid (front-of-the-meter) category are projected to hold a 31% share of the connection type segment in 2025, expanding at a CAGR of 9.8% through 2035. This segment involves battery energy storage systems coupled with solar PV or wind farms to ensure firm power delivery to the grid.

These integrated deployments are being prioritized in power purchase agreements, supported by renewable portfolio standards and utility procurement programs. Asia-Pacific and the USA are leading deployment in this category with rapidly growing utility-scale hybrid storage capacity.
Renewable Energy Integration Emerges as Dominant Application Area

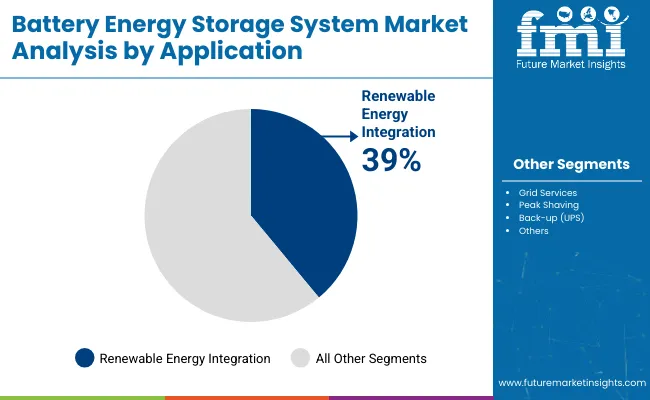
Battery Energy Storage System Market Analysis By Application

Renewable energy integration is projected to represent 39% share of the application segment in 2025 and is expected to grow at a CAGR of 9.7% through 2035. Energy storage systems are being increasingly co-located with solar and wind installations to mitigate intermittency and support dispatchable clean power.

Regulatory mandates to increase renewable share in the energy mix and reduce curtailment are further accelerating adoption. Integration use cases range from short-duration firming to long-duration storage for time-shifting and grid balancing.
Lithium-Ion Batteries Continue to Lead with High Cycle Efficiency and Scalability

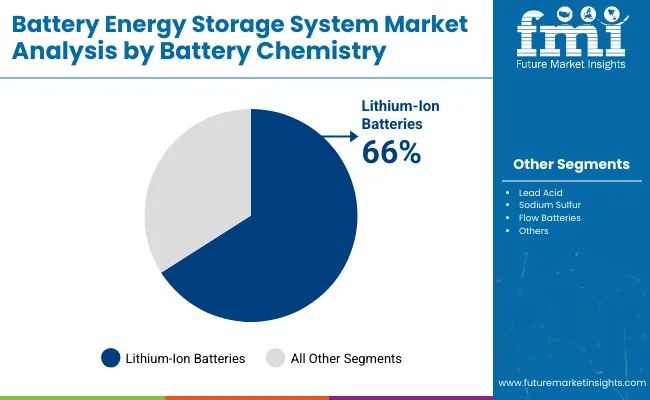
Battery Energy Storage System Market Analysis By Battery Chemistry

Lithium-ion batteries are expected to hold a 66% share of the battery chemistry segment in 2025 and are projected to grow at a CAGR of 9.4% during the forecast period. Their dominance is underpinned by continued price declines, mature supply chains, and proven use across both stationary and mobile energy storage applications.

Enhanced energy density, long cycle life, and adaptability across all capacity ranges support the segment’s broad deployment across residential, commercial, and utility-scale storage projects. Advances in LFP and NMC chemistries are further consolidating lithium-ion’s market position.
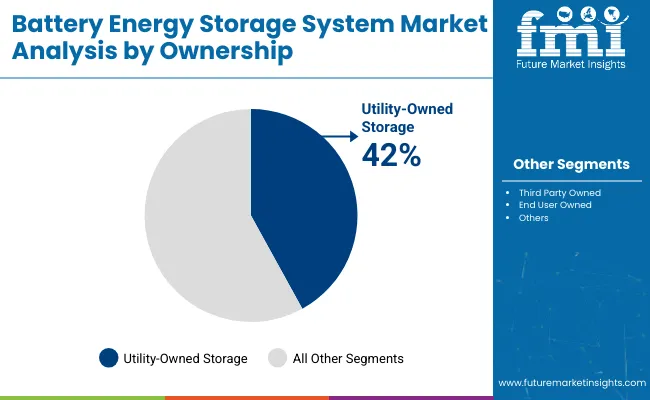
Utility-Owned Storage Projects Continue to Expand in Grid-Centric Models

Battery Energy Storage System Market Analysis By Ownership

Utility-owned projects are estimated to capture 42% share of the ownership segment in 2025 and are forecast to grow at a CAGR of 9.0% through 2035. This trend reflects the increasing involvement of regulated and municipal utilities in long-duration storage deployment to enhance reliability, defer infrastructure upgrades, and support decarbonization mandates.

Direct access to capital and regulatory incentives allow utilities to scale grid-connected energy storage faster, particularly in North America and Europe.

1,000.1 to 10,000 kWh Capacity Segment Drives Mid-Scale Deployment

The 1,000.1 to 10,000 kWh segment is projected to account for 34% share of the total battery energy storage market in 2025, expanding at a CAGR of 9.6% through 2035. This range supports the majority of commercial and industrial deployments requiring multi-hour storage durations.

Demand is being driven by utility-scale front-of-meter projects and microgrid systems, where mid-scale storage balances cost and operational flexibility. This category has become critical in locations with intermittent renewable penetration, enabling grid stabilization and peak demand response.

Key Insights from FMI on Battery Energy Storage System Industry

FMI Survey Findings: Battery Energy Storage System (BESS) industry trends According to Stakeholder Views

(Surveyed Q4 2024, n=500 stakeholders-manufacturers, utilities, project developers, and policymakers - distributed evenly across North America, Europe, Asia-Pacific, and the Middle East & Africa)

Stakeholders' Top Priorities

Global Consensus:

  • Grid Stability & Renewable Integration (85%) - The main reason for BESS uptake.
  • Cost Efficiency (78%) - Falling lithium-ion battery prices continue to be key to ROI.
  • Regulatory Compliance (72%) - Policies that require storage integration (e.g., IRA in the USA, EU's Clean Energy Package).

Regional Variance:

  • North America (USA & Canada): 68% considered large-scale utility storage for grid resilience.
  • Europe: 82% focused on sustainability (low-carbon battery production, recycling requirements).
  • Asia-Pacific (China, India, Japan, South Korea): 65% valued rapid deployment for industrial/commercial applications.
  • Middle East & Africa: 58% centered on off-grid and hybrid solar-storage systems for access to energy.

Adoption of Advanced Technologies

High Variance in Tech Adoption:

  • North America: 62% of utilities installed AI-based battery management systems (BMS) for predictive maintenance.
  • Europe: 55% utilized second-life EV batteries for stationary storage (EU circular economy policies).
  • China: 70% of new projects incorporated sodium-ion batteries (cost-benefit over lithium-ion).
  • Japan/South Korea: 48% used solid-state batteries for high-safety applications.

ROI Outlooks:

  • 73% of North American developers viewed 4-hour storage systems as the most feasible.
  • Only 32% of African stakeholders thought long-duration storage (>8 hours) was economically viable.

Battery Chemistry Preferences

Consensus:

  • Lithium-Ion (68% overall) - Most popular due to decreasing prices and high energy density.

Regional Variance:

  • Europe: 45% favored LFP (Lithium Iron Phosphate) for safety reasons and sustainability.
  • China: 60% adopted sodium-ion in cost-sensitive applications.
  • Middle East: 38% utilized flow batteries in long-duration desert solar storage.

Price Sensitivity & Financing Models

Shared Challenges:

  • 80% mentioned increased lithium/rare material prices as a significant barrier.
  • 65% were troubled by supply chain delays (particularly in Europe).

Regional Variations:

  • North America: 70% accepted 15 to 20% price premiums for USA-manufactured batteries (IRA incentives).
  • Europe: 55% used PPAs (Power Purchase Agreements) for storage projects.
  • Asia-Pacific: 60% preferred leasing models to minimize upfront expenses.

Value Chain Pain Points

Manufacturers:

  • North America: 50% experienced skilled labor shortages for battery gigafactories.
  • Europe: 45% grappled with sophisticated ESG compliance (e.g., EU Battery Regulation).
  • China: 55% grappled with oversupply and price wars.

Utilities/Developers:

  • North America: 60% mentioned interconnection delays as the greatest bottleneck.
  • Europe: 48% experienced land-use conflicts for large storage farms.
  • Africa: 65% reported insufficient financing options for storage projects.

Future Investment Priorities

Alignment:

  • 76% of producers intend R&D in next-generation batteries (solid-state, sodium-ion).

Divergence:

  • North America: 65% investing in grid-forming inverters for blackout resilience.
  • Europe: 58% emphasizing recycling infrastructure for end-of-life batteries.
  • Asia-Pacific: 70% emphasizing modular, containerized storage for rapid deployment.

Regulatory Impact

  • North America: 75% reported IRA tax credits spurred storage adoption.
  • Europe: 68% considered the EU's Net-Zero Industry Act a main growth driver.
  • Asia-Pacific: Just 40% believed local policies were favorable, citing sluggish permitting.

Conclusion: Key Trends & Strategic Insights

Global Consensus:

  • Storage is essential for renewables integration.
  • Cost and supply chain concerns remain top challenges.

Key Variances:

  • North America: Utility-scale growth and federal incentives drive it.
  • Europe: Dominance of sustainability and recycling.
  • Asia-Pacific: Rapid take-up of alternative chemistries (sodium-ion, LFP).
  • Africa/Middle East: Hybrid and off-grid systems lead.

Strategic Insight:

  • There is no single solution to the problem-there needs to be regional adaptation (e.g., LFP in Europe, sodium-ion in China, off-grid in Africa).
  • Policy support continues to be the largest driver in mature industries.

Government Regulations on the Battery Energy Storage System Industry

Country/Region Key Policies, Regulations & Mandatory Certifications
United States
  • Inflation Reduction Act (IRA): Offers tax credits (up to 30-50%) for USA-manufactured BESS.
  • FERC Order 841: Mandates grid operators to integrate storage into wholesale industries.
  • UL 9540 Certification: Required for fire safety and grid interconnection.
  • California’s SGIP (Self-Generation Incentive Program): Subsidizes behind-the-meter storage.
Canada
  • Clean Energy Regulations: Push for storage in renewable projects.
  • CSA C22.2 No. 107.1: Safety standard for battery systems.
  • Provincial Incentives (e.g., Alberta’s Energy Storage Program): Grants for grid-scale storage.
European Union
  • EU Battery Regulation (2027): Mandates carbon footprint disclosure, recycled content, and battery passports.
  • Clean Energy Package: Requires member states to remove barriers for storage deployment.
  • CE Marking: Mandatory for battery safety and electromagnetic compatibility.
  • Germany’s KfW Subsidies: Low-interest loans for residential/commercial storage.
China
  • 14th Five-Year Plan for Energy Storage: Targets 30 GW of new storage by 2025.
  • GB/T 36276: Safety standard for lithium-ion batteries.
  • Mandatory CCC Certification: Required for grid-connected storage systems.
  • Subsidies for Sodium-Ion Batteries: Push to reduce reliance on lithium.
India
  • National Energy Storage Mission (NESM): Aim for 50 GWh of storage by 2030.
  • BIS Certification (IS 16046): Mandatory for lithium-ion battery imports.
  • PLI Scheme (Production-Linked Incentive): USD 2.5B for domestic battery manufacturing.
  • Solar + Storage Tenders: SECI/NTPC mandates storage in renewable projects.
Japan
  • METI’s Green Growth Strategy: Subsidies for residential and industrial storage.
  • JIS C 8715-2: Safety standard for stationary storage.
  • Fit for Storage: Feed-in-Tariff for grid-supporting batteries.
South Korea
  • Renewable Energy 3020 Plan: Requires 10% storage in renewable projects.
  • KC Certification: Mandatory for battery safety and performance.
  • K-RE100 Subsidies: Incentives for corporate renewable + storage adoption.

Top 3 Strategic Imperatives for Stakeholders

Secure Supply Chains & Diversify Battery Chemistries

Action: Invest in local raw material sourcing (lithium, cobalt substitutes) and dual-supply techniques to counter geopolitical threats. Give top priority to R&D in sodium-ion, solid-state, and LFP batteries to lower cost and reliance on key minerals.

Position Ourselves with Policy-Driven Demand Hotspots

Action: Target industries with robust regulatory tailwinds (USA IRA tax incentives, EU Battery Passport, China's storage requirements). Create policy-savvy product strategies, like recyclable batteries for Europe or low-cost storage for new Asia.

Construct Hybrid Solutions & Energy-as-a-Service Models

Action: Partner with renewable developers, utilities, and tech companies to provide solar storage microgrids, virtual power plants (VPPs), and leasing models. Make software/AI startup acquisitions to advance grid optimization and battery life cycle management.

Top 3 Risks Stakeholders Should Monitor

Risk Probability/Impact
Geopolitical Supply Chain Disruptions (e.g., lithium/cobalt shortages, trade restrictions) High/Severe - Could delay projects, inflate costs, and force abrupt chemistry shifts.
Regulatory Uncertainty (e.g., shifting subsidies, slow permitting, safety standards) Medium-High/High - May stall deployments in key players (EU, USA) or invalidate existing designs.
Technology Displacement (e.g., rapid rise of sodium-ion/solid-state outcompeting lithium-ion) Medium/High - Could strand assets or erode margins for lagging players.

Executive Watchlist

Priority Immediate Action
Secure Alternative Battery Material Supply Finalize contracts with 2+ sodium-ion or LFP battery suppliers to diversify away from lithium dependence.
Align with IRA/EU Subsidy Deadlines Launch a dedicated task force to fast-track 3 USA or EU storage projects eligible for 2024 tax credits.
Pilot Energy-as-a-Service Model Partner with 1 regional utility to test leased storage/VPP solutions (launch within 6 months).

For the Boardroom

To stay ahead, companies must leverage the USD 65B battery storage boom, we suggest an immediate shift to policy-driven industries (USA/EU subsidies) hedging supply chain bets through dual sourcing (sodium-ion + LFP). Within 12 months, begin at least one Energy-as-a-Service pilot (e.g., storage leasing with a renewable developer) securing sticky revenue before commoditization. This insight requires restyling your 2025 roadmap to focus on:

Localized production (to access IRA/EU incentives),

R&D collaborations on non-lithium chemistries, and

M&A of grid-edge software companies to support VPPs.

Differentiator: While others pursue lithium-ion scale, this strategy makes you the nimble, policy-aware leader in command of both margins and industries. Act quickly-regulatory windows and first-maker benefits are shutting rapidly.
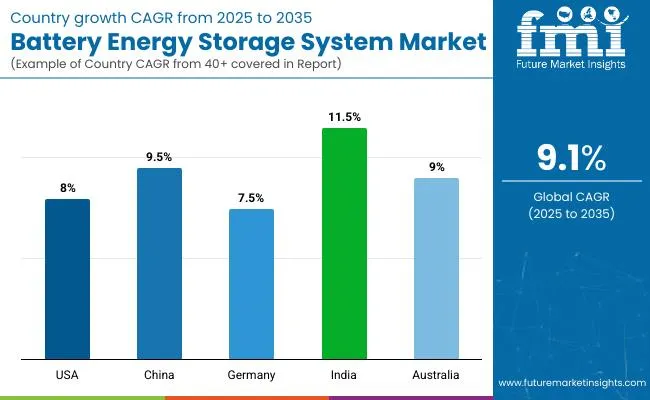
Country-wise Analysis

Battery Energy Storage System Market Country Wise Analysis

Country CAGR (2025 to 2035)
USA 8.0%
China 9.5%
Germany 7.5%
India 11.5%
Australia 9.0%

USA

CAGR (2025 to 2035): ~8.0%

The USA has the largest and most developed BESS industry, fueled by the Inflation Reduction Act (IRA) that includes 30-50% tax credits for storage systems produced in the country. Leaders in deployments are states such as California, Texas, and New York, with utility-scale plants reigning supreme (80% of installed capacity).

The market is turning towards 4-hour storage systems to enable solar integration, while behind-the-meter (BTM) commercial storage expands through demand charge management.

Germany

CAGR (2025 to 2035): ~7.5% (EU leader in distributed storage)

Germany leads Europe in residential/commercial BESS, with 800,000+ home batteries installed (2024). The KfW subsidies and solar-storage requirements fuel adoption. Utility-scale storage lags but expands through grid-balancing tenders.

China

CAGR (2025 to 2035): ~9.5% (Global leader in volume, but low margins)

China leads BESS manufacturing (70% world capacity) and is converting to sodium-ion batteries to reduce lithium dependency. State Grid Corporation is rolling out 200+ GW of storage by 2030.

Competition Outlook

Companies are strengthening their market positions through acquisitions and innovative service models. Acquiring energy storage projects is helping expand regional presence and enhance grid resilience. Meanwhile, international expansion into new markets with large-scale projects is intensifying competition. The industry is increasingly focused on scalable, sustainable solutions that facilitate the transition to cleaner energy while maintaining grid stability.

  • In June 2024, Generac Power Systems completed the acquisition of PowerPlay Battery Energy Storage Systems from SunGrid Solutions. PowerPlay, known for turnkey BESS solutions for commercial and industrial (C&I) applications up to 7 MWh, will continue operations in Cambridge, Canada, as Generac’s dedicated R&D hub for C&I energy storage.
  • In February 2025, GridStor expanded its USA footprint by acquiring a battery energy storage project in Texas from Balanced Rock Power. The project supports GridStor’s strategy to deliver large-scale energy storage solutions within the ERCOT market and enhance grid resilience.
  • In May 2025, ABB launched its Battery Energy Storage Systems-as-a-Service (BESSaaS), offering a zero-CapEx model to help businesses accelerate their transition to clean energy. The service includes all hardware, software, and lifecycle support, enabling users to adopt battery storage through a quarterly fee. Targeted at commercial and industrial sectors, the model allows immediate financial returns without upfront investments.
  • In June 2025, EKU Energy entered the New Zealand market by securing a 300 MW battery storage project. The project is expected to contribute to New Zealand’s renewable integration efforts and represents EKU Energy’s continued international expansion in energy storage infrastructure.

Companies

  • ABB Ltd.
  • Delta Electronics Inc.
  • EnerSys
  • Fluence Energy, Inc.
  • GE Vernova
  • Hitachi Ltd.
  • LG Energy Solution / Vertech
  • Panasonic Corporation
  • Samsung SDI
  • Toshiba Corporation
  • BYD Company Ltd.
  • East Penn Manufacturing
  • Honeywell International
  • Kawasaki Heavy Industries
  • Tesla, Inc.

Battery Energy Storage System Industry Analysis by Top Investment Segments

By Storage Capacity:

  • Upto 50 kWh
  • 50.1 to 500 kWh
  • 500.1 to 1,000 kWh
  • 1,000.1 to 10,000 kWh
  • Above 10,000 kWh

By Battery Chemistry:

  • Lead Acid
  • Lithium Ion
  • Sodium Sulfur
  • Flow Batteries

By Application:

  • Grid Services
  • Renewable Energy Integration
  • Peak Shaving
  • Back-up (UPS)

By Ownership:

  • Utility Owned
  • Third Party Owned
  • End User Owned

By Connection Type:

  • On Grid (Front-of-the-meter)
    • Power Generation & Utilities
    • Commercial & Industrial
    • Hybrid Systems (Renewable)
  • Off Grid (Behind-the-meter)
    • Commercial & Industrial
    • Hybrid Systems (Renewable)
    • Residential
    • Telecom Power
    • Critical Infrastructure
    • Others

By Region:

  • North America
  • Latin America
  • Eastern Europe
  • Western Europe
  • South Asia & Pacific
  • East Asia
  • Middle East & Africa

Table of Content

  1. Executive Summary
  2. Market Overview
  3. Market Background
  4. Global Market Analysis 2020 to 2024 and Forecast, 2025 to 2035
  5. Global Market Analysis 2020 to 2024 and Forecast 2025 to 2035, By Battery Type
    • Lithium-Ion Batteries
    • Advanced Lead-Acid Batteries
    • Flow Batteries
    • Others
  6. Global Market Analysis 2020 to 2024 and Forecast 2025 to 2035, By Connection Type
    • On-grid
    • Off-grid
  7. Global Market Analysis 2020 to 2024 and Forecast 2025 to 2035, By Ownership
    • Customer-Owned
    • Third-Party Owned
    • Utility-Owned
  8. Global Market Analysis 2020 to 2024 and Forecast 2025 to 2035, By Energy Capacity
    • Below 100 MWh
    • Between 100 to 500 MWh
    • Above 500 MWh
  9. Global Market Analysis 2020 to 2024 and Forecast 2025 to 2035, By Storage System
    • Front-of-the-meter
    • Behind-the-meter
  10. Global Market Analysis 2020 to 2024 and Forecast 2025 to 2035, By Application
    • Residential
    • Commercial
    • Utility
  11. Global Market Analysis 2020 to 2024 and Forecast 2025 to 2035, By Region
    • North America
    • Latin America
    • Europe
    • Asia Pacific
    • Middle East and Africa
  12. North America Market Analysis 2020 to 2024 and Forecast 2025 to 2035, By Country
  13. Latin America Market Analysis 2020 to 2024 and Forecast 2025 to 2035, By Country
  14. Europe Market Analysis 2020 to 2024 and Forecast 2025 to 2035, By Country
  15. Asia Pacific Market Analysis 2020 to 2024 and Forecast 2025 to 2035, By Country
  16. Middle East and Africa Market Analysis 2020 to 2024 and Forecast 2025 to 2035, By Country
  17. Key Countries Market Analysis
  18. Market Structure Analysis
  19. Competition Analysis
    • Tesla (Megapack, Powerwall, Powerpack)
    • LG Energy Solution
    • Samsung SDI
    • Panasonic
    • BYD
    • Fluence (Siemens & AES JV)
    • Contemporary Amperex Technology Co. Ltd. (CATL)
    • ABB
    • Enphase Energy
    • Eaton Corporation
  20. Assumptions & Acronyms Used
  21. Research Methodology

List of Tables

  • Table 1: Global Market Value (USD Million) Forecast by Region, 2020 to 2035
  • Table 2: Global Market Value (USD Million) Forecast by Battery Type, 2020 to 2035
  • Table 3: Global Market Value (USD Million) Forecast by Connection Type, 2020 to 2035
  • Table 4: Global Market Value (USD Million) Forecast by Ownership , 2020 to 2035
  • Table 5: Global Market Value (USD Million) Forecast by Energy Capacity, 2020 to 2035
  • Table 6: Global Market Value (USD Million) Forecast by Storage System, 2020 to 2035
  • Table 7: Global Market Value (USD Million) Forecast by Application, 2020 to 2035
  • Table 8: North America Market Value (USD Million) Forecast by Country, 2020 to 2035
  • Table 9: North America Market Value (USD Million) Forecast by Battery Type, 2020 to 2035
  • Table 10: North America Market Value (USD Million) Forecast by Connection Type, 2020 to 2035
  • Table 11: North America Market Value (USD Million) Forecast by Ownership , 2020 to 2035
  • Table 12: North America Market Value (USD Million) Forecast by Energy Capacity, 2020 to 2035
  • Table 13: North America Market Value (USD Million) Forecast by Storage System, 2020 to 2035
  • Table 14: North America Market Value (USD Million) Forecast by Application, 2020 to 2035
  • Table 15: Latin America Market Value (USD Million) Forecast by Country, 2020 to 2035
  • Table 16: Latin America Market Value (USD Million) Forecast by Battery Type, 2020 to 2035
  • Table 17: Latin America Market Value (USD Million) Forecast by Connection Type, 2020 to 2035
  • Table 18: Latin America Market Value (USD Million) Forecast by Ownership, 2020 to 2035
  • Table 19: Latin America Market Value (USD Million) Forecast by Energy Capacity, 2020 to 2035
  • Table 20: Latin America Market Value (USD Million) Forecast by Storage System, 2020 to 2035
  • Table 21: Latin America Market Value (USD Million) Forecast by Application, 2020 to 2035
  • Table 22: Europe Market Value (USD Million) Forecast by Country, 2020 to 2035
  • Table 23: Europe Market Value (USD Million) Forecast by Battery Type, 2020 to 2035
  • Table 24: Europe Market Value (USD Million) Forecast by Connection Type, 2020 to 2035
  • Table 25: Europe Market Value (USD Million) Forecast by Ownership, 2020 to 2035
  • Table 26: Europe Market Value (USD Million) Forecast by Energy Capacity, 2020 to 2035
  • Table 27: Europe Market Value (USD Million) Forecast by Storage System, 2020 to 2035
  • Table 28: Europe Market Value (USD Million) Forecast by Application, 2020 to 2035
  • Table 29: Asia Pacific Market Value (USD Million) Forecast by Country, 2020 to 2035
  • Table 30: Asia Pacific Market Value (USD Million) Forecast by Battery Type, 2020 to 2035
  • Table 31: Asia Pacific Market Value (USD Million) Forecast by Connection Type, 2020 to 2035
  • Table 32: Asia Pacific Market Value (USD Million) Forecast by Ownership, 2020 to 2035
  • Table 33: Asia Pacific Market Value (USD Million) Forecast by Energy Capacity, 2020 to 2035
  • Table 34: Asia Pacific Market Value (USD Million) Forecast by Storage System, 2020 to 2035
  • Table 35: Asia Pacific Market Value (USD Million) Forecast by Application, 2020 to 2035
  • Table 36: Middle East and Africa Market Value (USD Million) Forecast by Country, 2020 to 2035
  • Table 37: Middle East and Africa Market Value (USD Million) Forecast by Battery Type, 2020 to 2035
  • Table 38: Middle East and Africa Market Value (USD Million) Forecast by Connection Type, 2020 to 2035
  • Table 39: Middle East and Africa Market Value (USD Million) Forecast by Ownership, 2020 to 2035
  • Table 40: Middle East and Africa Market Value (USD Million) Forecast by Energy Capacity, 2020 to 2035
  • Table 41: Middle East and Africa Market Value (USD Million) Forecast by Storage System, 2020 to 2035
  • Table 42: Middle East and Africa Market Value (USD Million) Forecast by Application, 2020 to 2035

List of Figures

  • Figure 1: Global Market Value (USD Million) by Battery Type, 2025 to 2035
  • Figure 2: Global Market Value (USD Million) by Connection Type, 2025 to 2035
  • Figure 3: Global Market Value (USD Million) by Ownership, 2025 to 2035
  • Figure 4: Global Market Value (USD Million) by Energy Capacity, 2025 to 2035
  • Figure 5: Global Market Value (USD Million) by Storage System, 2025 to 2035
  • Figure 6: Global Market Value (USD Million) by Application, 2025 to 2035
  • Figure 7: Global Market Value (USD Million) by Region, 2025 to 2035
  • Figure 8: Global Market Value (USD Million) Analysis by Region, 2020 to 2035
  • Figure 9: Global Market Value Share (%) and BPS Analysis by Region, 2025 to 2035
  • Figure 10: Global Market Y-o-Y Growth (%) Projections by Region, 2025 to 2035
  • Figure 11: Global Market Value (USD Million) Analysis by Battery Type, 2020 to 2035
  • Figure 12: Global Market Value Share (%) and BPS Analysis by Battery Type, 2025 to 2035
  • Figure 13: Global Market Y-o-Y Growth (%) Projections by Battery Type, 2025 to 2035
  • Figure 14: Global Market Value (USD Million) Analysis by Connection Type, 2020 to 2035
  • Figure 15: Global Market Value Share (%) and BPS Analysis by Connection Type, 2025 to 2035
  • Figure 16: Global Market Y-o-Y Growth (%) Projections by Connection Type, 2025 to 2035
  • Figure 17: Global Market Value (USD Million) Analysis by Ownership, 2020 to 2035
  • Figure 18: Global Market Value Share (%) and BPS Analysis by Ownership, 2025 to 2035
  • Figure 19: Global Market Y-o-Y Growth (%) Projections by Ownership, 2025 to 2035
  • Figure 20: Global Market Value (USD Million) Analysis by Energy Capacity, 2020 to 2035
  • Figure 21: Global Market Value Share (%) and BPS Analysis by Energy Capacity, 2025 to 2035
  • Figure 22: Global Market Y-o-Y Growth (%) Projections by Energy Capacity, 2025 to 2035
  • Figure 23: Global Market Value (USD Million) Analysis by Storage System, 2020 to 2035
  • Figure 24: Global Market Value Share (%) and BPS Analysis by Storage System, 2025 to 2035
  • Figure 25: Global Market Y-o-Y Growth (%) Projections by Storage System, 2025 to 2035
  • Figure 26: Global Market Value (USD Million) Analysis by Application, 2020 to 2035
  • Figure 27: Global Market Value Share (%) and BPS Analysis by Application, 2025 to 2035
  • Figure 28: Global Market Y-o-Y Growth (%) Projections by Application, 2025 to 2035
  • Figure 29: Global Market Attractiveness by Battery Type, 2025 to 2035
  • Figure 30: Global Market Attractiveness by Connection Type, 2025 to 2035
  • Figure 31: Global Market Attractiveness by Ownership, 2025 to 2035
  • Figure 32: Global Market Attractiveness by Energy Capacity, 2025 to 2035
  • Figure 33: Global Market Attractiveness by Storage System, 2025 to 2035
  • Figure 34: Global Market Attractiveness by Application, 2025 to 2035
  • Figure 35: Global Market Attractiveness by Region, 2025 to 2035
  • Figure 36: North America Market Value (USD Million) by Battery Type, 2025 to 2035
  • Figure 37: North America Market Value (USD Million) by Connection Type, 2025 to 2035
  • Figure 38: North America Market Value (USD Million) by Ownership, 2025 to 2035
  • Figure 39: North America Market Value (USD Million) by Energy Capacity, 2025 to 2035
  • Figure 40: North America Market Value (USD Million) by Storage System, 2025 to 2035
  • Figure 41: North America Market Value (USD Million) by Application, 2025 to 2035
  • Figure 42: North America Market Value (USD Million) by Country, 2025 to 2035
  • Figure 43: North America Market Value (USD Million) Analysis by Country, 2020 to 2035
  • Figure 44: North America Market Value Share (%) and BPS Analysis by Country, 2025 to 2035
  • Figure 45: North America Market Y-o-Y Growth (%) Projections by Country, 2025 to 2035
  • Figure 46: North America Market Value (USD Million) Analysis by Battery Type, 2020 to 2035
  • Figure 47: North America Market Value Share (%) and BPS Analysis by Battery Type, 2025 to 2035
  • Figure 48: North America Market Y-o-Y Growth (%) Projections by Battery Type, 2025 to 2035
  • Figure 49: North America Market Value (USD Million) Analysis by Connection Type, 2020 to 2035
  • Figure 50: North America Market Value Share (%) and BPS Analysis by Connection Type, 2025 to 2035
  • Figure 51: North America Market Y-o-Y Growth (%) Projections by Connection Type, 2025 to 2035
  • Figure 52: North America Market Value (USD Million) Analysis by Ownership, 2020 to 2035
  • Figure 53: North America Market Value Share (%) and BPS Analysis by Ownership, 2025 to 2035
  • Figure 54: North America Market Y-o-Y Growth (%) Projections by Ownership, 2025 to 2035
  • Figure 55: North America Market Value (USD Million) Analysis by Energy Capacity, 2020 to 2035
  • Figure 56: North America Market Value Share (%) and BPS Analysis by Energy Capacity, 2025 to 2035
  • Figure 57: North America Market Y-o-Y Growth (%) Projections by Energy Capacity, 2025 to 2035
  • Figure 58: North America Market Value (USD Million) Analysis by Storage System, 2020 to 2035
  • Figure 59: North America Market Value Share (%) and BPS Analysis by Storage System, 2025 to 2035
  • Figure 60: North America Market Y-o-Y Growth (%) Projections by Storage System, 2025 to 2035
  • Figure 61: North America Market Value (USD Million) Analysis by Application, 2020 to 2035
  • Figure 62: North America Market Value Share (%) and BPS Analysis by Application, 2025 to 2035
  • Figure 63: North America Market Y-o-Y Growth (%) Projections by Application, 2025 to 2035
  • Figure 64: North America Market Attractiveness by Battery Type, 2025 to 2035
  • Figure 65: North America Market Attractiveness by Connection Type, 2025 to 2035
  • Figure 66: North America Market Attractiveness by Ownership, 2025 to 2035
  • Figure 67: North America Market Attractiveness by Energy Capacity, 2025 to 2035
  • Figure 68: North America Market Attractiveness by Storage System, 2025 to 2035
  • Figure 69: North America Market Attractiveness by Application, 2025 to 2035
  • Figure 70: North America Market Attractiveness by Country, 2025 to 2035
  • Figure 71: Latin America Market Value (USD Million) by Battery Type, 2025 to 2035
  • Figure 72: Latin America Market Value (USD Million) by Connection Type, 2025 to 2035
  • Figure 73: Latin America Market Value (USD Million) by Ownership, 2025 to 2035
  • Figure 74: Latin America Market Value (USD Million) by Energy Capacity, 2025 to 2035
  • Figure 75: Latin America Market Value (USD Million) by Storage System, 2025 to 2035
  • Figure 76: Latin America Market Value (USD Million) by Application, 2025 to 2035
  • Figure 77: Latin America Market Value (USD Million) by Country, 2025 to 2035
  • Figure 78: Latin America Market Value (USD Million) Analysis by Country, 2020 to 2035
  • Figure 79: Latin America Market Value Share (%) and BPS Analysis by Country, 2025 to 2035
  • Figure 80: Latin America Market Y-o-Y Growth (%) Projections by Country, 2025 to 2035
  • Figure 81: Latin America Market Value (USD Million) Analysis by Battery Type, 2020 to 2035
  • Figure 82: Latin America Market Value Share (%) and BPS Analysis by Battery Type, 2025 to 2035
  • Figure 83: Latin America Market Y-o-Y Growth (%) Projections by Battery Type, 2025 to 2035
  • Figure 84: Latin America Market Value (USD Million) Analysis by Connection Type, 2020 to 2035
  • Figure 85: Latin America Market Value Share (%) and BPS Analysis by Connection Type, 2025 to 2035
  • Figure 86: Latin America Market Y-o-Y Growth (%) Projections by Connection Type, 2025 to 2035
  • Figure 87: Latin America Market Value (USD Million) Analysis by Ownership, 2020 to 2035
  • Figure 88: Latin America Market Value Share (%) and BPS Analysis by Ownership, 2025 to 2035
  • Figure 89: Latin America Market Y-o-Y Growth (%) Projections by Ownership, 2025 to 2035
  • Figure 90: Latin America Market Value (USD Million) Analysis by Energy Capacity, 2020 to 2035
  • Figure 91: Latin America Market Value Share (%) and BPS Analysis by Energy Capacity, 2025 to 2035
  • Figure 92: Latin America Market Y-o-Y Growth (%) Projections by Energy Capacity, 2025 to 2035
  • Figure 93: Latin America Market Value (USD Million) Analysis by Storage System, 2020 to 2035
  • Figure 94: Latin America Market Value Share (%) and BPS Analysis by Storage System, 2025 to 2035
  • Figure 95: Latin America Market Y-o-Y Growth (%) Projections by Storage System, 2025 to 2035
  • Figure 96: Latin America Market Value (USD Million) Analysis by Application, 2020 to 2035
  • Figure 97: Latin America Market Value Share (%) and BPS Analysis by Application, 2025 to 2035
  • Figure 98: Latin America Market Y-o-Y Growth (%) Projections by Application, 2025 to 2035
  • Figure 99: Latin America Market Attractiveness by Battery Type, 2025 to 2035
  • Figure 100: Latin America Market Attractiveness by Connection Type, 2025 to 2035
  • Figure 101: Latin America Market Attractiveness by Ownership, 2025 to 2035
  • Figure 102: Latin America Market Attractiveness by Energy Capacity, 2025 to 2035
  • Figure 103: Latin America Market Attractiveness by Storage System, 2025 to 2035
  • Figure 104: Latin America Market Attractiveness by Application, 2025 to 2035
  • Figure 105: Latin America Market Attractiveness by Country, 2025 to 2035
  • Figure 106: Europe Market Value (USD Million) by Battery Type, 2025 to 2035
  • Figure 107: Europe Market Value (USD Million) by Connection Type, 2025 to 2035
  • Figure 108: Europe Market Value (USD Million) by Ownership, 2025 to 2035
  • Figure 109: Europe Market Value (USD Million) by Energy Capacity, 2025 to 2035
  • Figure 110: Europe Market Value (USD Million) by Storage System, 2025 to 2035
  • Figure 111: Europe Market Value (USD Million) by Application, 2025 to 2035
  • Figure 112: Europe Market Value (USD Million) by Country, 2025 to 2035
  • Figure 113: Europe Market Value (USD Million) Analysis by Country, 2020 to 2035
  • Figure 114: Europe Market Value Share (%) and BPS Analysis by Country, 2025 to 2035
  • Figure 115: Europe Market Y-o-Y Growth (%) Projections by Country, 2025 to 2035
  • Figure 116: Europe Market Value (USD Million) Analysis by Battery Type, 2020 to 2035
  • Figure 117: Europe Market Value Share (%) and BPS Analysis by Battery Type, 2025 to 2035
  • Figure 118: Europe Market Y-o-Y Growth (%) Projections by Battery Type, 2025 to 2035
  • Figure 119: Europe Market Value (USD Million) Analysis by Connection Type, 2020 to 2035
  • Figure 120: Europe Market Value Share (%) and BPS Analysis by Connection Type, 2025 to 2035
  • Figure 121: Europe Market Y-o-Y Growth (%) Projections by Connection Type, 2025 to 2035
  • Figure 122: Europe Market Value (USD Million) Analysis by Ownership, 2020 to 2035
  • Figure 123: Europe Market Value Share (%) and BPS Analysis by Ownership, 2025 to 2035
  • Figure 124: Europe Market Y-o-Y Growth (%) Projections by Ownership, 2025 to 2035
  • Figure 125: Europe Market Value (USD Million) Analysis by Energy Capacity, 2020 to 2035
  • Figure 126: Europe Market Value Share (%) and BPS Analysis by Energy Capacity, 2025 to 2035
  • Figure 127: Europe Market Y-o-Y Growth (%) Projections by Energy Capacity, 2025 to 2035
  • Figure 128: Europe Market Value (USD Million) Analysis by Storage System, 2020 to 2035
  • Figure 129: Europe Market Value Share (%) and BPS Analysis by Storage System, 2025 to 2035
  • Figure 130: Europe Market Y-o-Y Growth (%) Projections by Storage System, 2025 to 2035
  • Figure 131: Europe Market Value (USD Million) Analysis by Application, 2020 to 2035
  • Figure 132: Europe Market Value Share (%) and BPS Analysis by Application, 2025 to 2035
  • Figure 133: Europe Market Y-o-Y Growth (%) Projections by Application, 2025 to 2035
  • Figure 134: Europe Market Attractiveness by Battery Type, 2025 to 2035
  • Figure 135: Europe Market Attractiveness by Connection Type, 2025 to 2035
  • Figure 136: Europe Market Attractiveness by Ownership, 2025 to 2035
  • Figure 137: Europe Market Attractiveness by Energy Capacity, 2025 to 2035
  • Figure 138: Europe Market Attractiveness by Storage System, 2025 to 2035
  • Figure 139: Europe Market Attractiveness by Application, 2025 to 2035
  • Figure 140: Europe Market Attractiveness by Country, 2025 to 2035
  • Figure 141: Asia Pacific Market Value (USD Million) by Battery Type, 2025 to 2035
  • Figure 142: Asia Pacific Market Value (USD Million) by Connection Type, 2025 to 2035
  • Figure 143: Asia Pacific Market Value (USD Million) by Ownership, 2025 to 2035
  • Figure 144: Asia Pacific Market Value (USD Million) by Energy Capacity, 2025 to 2035
  • Figure 145: Asia Pacific Market Value (USD Million) by Storage System, 2025 to 2035
  • Figure 146: Asia Pacific Market Value (USD Million) by Application, 2025 to 2035
  • Figure 147: Asia Pacific Market Value (USD Million) by Country, 2025 to 2035
  • Figure 148: Asia Pacific Market Value (USD Million) Analysis by Country, 2020 to 2035
  • Figure 149: Asia Pacific Market Value Share (%) and BPS Analysis by Country, 2025 to 2035
  • Figure 150: Asia Pacific Market Y-o-Y Growth (%) Projections by Country, 2025 to 2035
  • Figure 151: Asia Pacific Market Value (USD Million) Analysis by Battery Type, 2020 to 2035
  • Figure 152: Asia Pacific Market Value Share (%) and BPS Analysis by Battery Type, 2025 to 2035
  • Figure 153: Asia Pacific Market Y-o-Y Growth (%) Projections by Battery Type, 2025 to 2035
  • Figure 154: Asia Pacific Market Value (USD Million) Analysis by Connection Type, 2020 to 2035
  • Figure 155: Asia Pacific Market Value Share (%) and BPS Analysis by Connection Type, 2025 to 2035
  • Figure 156: Asia Pacific Market Y-o-Y Growth (%) Projections by Connection Type, 2025 to 2035
  • Figure 157: Asia Pacific Market Value (USD Million) Analysis by Ownership, 2020 to 2035
  • Figure 158: Asia Pacific Market Value Share (%) and BPS Analysis by Ownership, 2025 to 2035
  • Figure 159: Asia Pacific Market Y-o-Y Growth (%) Projections by Ownership, 2025 to 2035
  • Figure 160: Asia Pacific Market Value (USD Million) Analysis by Energy Capacity, 2020 to 2035
  • Figure 161: Asia Pacific Market Value Share (%) and BPS Analysis by Energy Capacity, 2025 to 2035
  • Figure 162: Asia Pacific Market Y-o-Y Growth (%) Projections by Energy Capacity, 2025 to 2035
  • Figure 163: Asia Pacific Market Value (USD Million) Analysis by Storage System, 2020 to 2035
  • Figure 164: Asia Pacific Market Value Share (%) and BPS Analysis by Storage System, 2025 to 2035
  • Figure 165: Asia Pacific Market Y-o-Y Growth (%) Projections by Storage System, 2025 to 2035
  • Figure 166: Asia Pacific Market Value (USD Million) Analysis by Application, 2020 to 2035
  • Figure 167: Asia Pacific Market Value Share (%) and BPS Analysis by Application, 2025 to 2035
  • Figure 168: Asia Pacific Market Y-o-Y Growth (%) Projections by Application, 2025 to 2035
  • Figure 169: Asia Pacific Market Attractiveness by Battery Type, 2025 to 2035
  • Figure 170: Asia Pacific Market Attractiveness by Connection Type, 2025 to 2035
  • Figure 171: Asia Pacific Market Attractiveness by Ownership, 2025 to 2035
  • Figure 172: Asia Pacific Market Attractiveness by Energy Capacity, 2025 to 2035
  • Figure 173: Asia Pacific Market Attractiveness by Storage System, 2025 to 2035
  • Figure 174: Asia Pacific Market Attractiveness by Application, 2025 to 2035
  • Figure 175: Asia Pacific Market Attractiveness by Country, 2025 to 2035
  • Figure 176: Middle East and Africa Market Value (USD Million) by Battery Type, 2025 to 2035
  • Figure 177: Middle East and Africa Market Value (USD Million) by Connection Type, 2025 to 2035
  • Figure 178: Middle East and Africa Market Value (USD Million) by Ownership, 2025 to 2035
  • Figure 179: Middle East and Africa Market Value (USD Million) by Energy Capacity, 2025 to 2035
  • Figure 180: Middle East and Africa Market Value (USD Million) by Storage System, 2025 to 2035
  • Figure 181: Middle East and Africa Market Value (USD Million) by Application, 2025 to 2035
  • Figure 182: Middle East and Africa Market Value (USD Million) by Country, 2025 to 2035
  • Figure 183: Middle East and Africa Market Value (USD Million) Analysis by Country, 2020 to 2035
  • Figure 184: Middle East and Africa Market Value Share (%) and BPS Analysis by Country, 2025 to 2035
  • Figure 185: Middle East and Africa Market Y-o-Y Growth (%) Projections by Country, 2025 to 2035
  • Figure 186: Middle East and Africa Market Value (USD Million) Analysis by Battery Type, 2020 to 2035
  • Figure 187: Middle East and Africa Market Value Share (%) and BPS Analysis by Battery Type, 2025 to 2035
  • Figure 188: Middle East and Africa Market Y-o-Y Growth (%) Projections by Battery Type, 2025 to 2035
  • Figure 189: Middle East and Africa Market Value (USD Million) Analysis by Connection Type, 2020 to 2035
  • Figure 190: Middle East and Africa Market Value Share (%) and BPS Analysis by Connection Type, 2025 to 2035
  • Figure 191: Middle East and Africa Market Y-o-Y Growth (%) Projections by Connection Type, 2025 to 2035
  • Figure 192: Middle East and Africa Market Value (USD Million) Analysis by Ownership, 2020 to 2035
  • Figure 193: Middle East and Africa Market Value Share (%) and BPS Analysis by Ownership, 2025 to 2035
  • Figure 194: Middle East and Africa Market Y-o-Y Growth (%) Projections by Ownership, 2025 to 2035
  • Figure 195: Middle East and Africa Market Value (USD Million) Analysis by Energy Capacity, 2020 to 2035
  • Figure 196: Middle East and Africa Market Value Share (%) and BPS Analysis by Energy Capacity, 2025 to 2035
  • Figure 197: Middle East and Africa Market Y-o-Y Growth (%) Projections by Energy Capacity, 2025 to 2035
  • Figure 198: Middle East and Africa Market Value (USD Million) Analysis by Storage System, 2020 to 2035
  • Figure 199: Middle East and Africa Market Value Share (%) and BPS Analysis by Storage System, 2025 to 2035
  • Figure 200: Middle East and Africa Market Y-o-Y Growth (%) Projections by Storage System, 2025 to 2035
  • Figure 201: Middle East and Africa Market Value (USD Million) Analysis by Application, 2020 to 2035
  • Figure 202: Middle East and Africa Market Value Share (%) and BPS Analysis by Application, 2025 to 2035
  • Figure 203: Middle East and Africa Market Y-o-Y Growth (%) Projections by Application, 2025 to 2035
  • Figure 204: Middle East and Africa Market Attractiveness by Battery Type, 2025 to 2035
  • Figure 205: Middle East and Africa Market Attractiveness by Connection Type, 2025 to 2035
  • Figure 206: Middle East and Africa Market Attractiveness by Ownership, 2025 to 2035
  • Figure 207: Middle East and Africa Market Attractiveness by Energy Capacity, 2025 to 2035
  • Figure 208: Middle East and Africa Market Attractiveness by Storage System, 2025 to 2035
  • Figure 209: Middle East and Africa Market Attractiveness by Application, 2025 to 2035
  • Figure 210: Middle East and Africa Market Attractiveness by Country, 2025 to 2035

Frequently Asked Questions

Which battery technology dominates energy storage systems now?

Lithium-ion batteries prevail because of high efficiency and declining costs.

What is driving demand for large-scale storage projects?

Grid stability requirements and renewable energy integration are primary drivers.

Which areas embrace residential storage the most?

Germany, Australia, and the USA are the leaders in home battery installations.

Why are sodium-ion batteries becoming a focus?

They present lower costs and minimize dependence on key minerals.

How do policies affect storage deployment?

Subsidies and mandates drive adoption in the USA, EU, and China.

Explore Similar Insights

Future Market Insights

Battery Energy Storage System Market