Reports

- Global Locations -

Headquarters

Future Market Insights, Inc.

Christiana Corporate, 200
Continental Drive, Suite 401,
Newark, Delaware - 19713,
United States

T: +1-845-579-5705

Americas

Future Market Insights, Inc.

616 Corporate Way, Suite 2-9018,
Valley Cottage, NY 10989, United States

T: +1-347-918-3531

MEA

Future Market Insights

1602-6 Jumeirah Bay X2 Tower, Plot No: JLT-PH2-X2A,
Jumeirah Lakes Towers, Dubai,
United Arab Emirates

Europe

Future Market Insights

3rd Floor, 207 Regent Street,
W1B 3HH London
United Kingdom

T: + 44 (0) 20 8123 9659
D: +44 (0) 20 3287 4268

Asia Pacific

Future Market Insights

IndiaLand Global Tech Park, Unit UG-1, Behind Grand HighStreet, Phase 1, Hinjawadi, MH, Pune – 411057, India

Battery Materials Market Outlook for 2023 to 2033

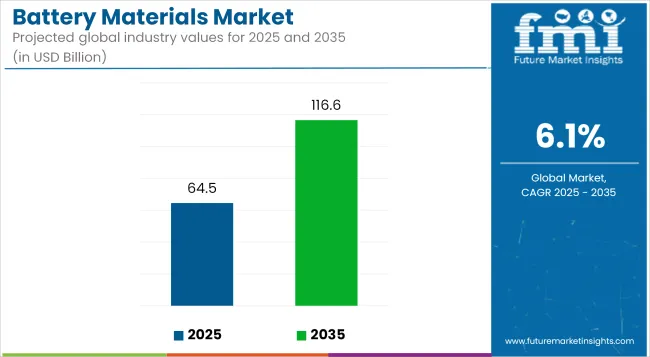
The global battery materials market size reached US$ 54.1 billion in 2022 and is set to total US$ 57.9 billion by 2023. Global battery material sales are projected to increase at 5.9% CAGR during the assessment period, taking the overall market valuation to around US$ 102.8 billion by 2033.

Automotive industry is expected to present lucrative growth prospects for battery material producers. This is due to rising production and sales of vehicles and a shift towards electric cars. The latest battery materials industry insights predict the target segment to thrive at 5.4% CAGR through 2033.

Attributes Key Insights
Global Battery Materials Market Value in 2022 US$ 54.1 billion
Estimated Battery Materials Market Size (2023) US$ 57.9 billion
Expected Market Size (2033) US$ 102.8 billion
Predicted Battery Materials Market CAGR (2023 to 2033) 5.9%

Don't pay for what you don't need

Customize your report by selecting specific countries or regions and save 30%!

Key Market Highlights

A Colossal Market Valuation Despite Reduced CAGR

Despite a slight drop in predicted CAGR, the global battery materials market is projected to expand nearly 1.8X, reaching a colossal valuation of 102.8 billion by 2033. This is due to ongoing transition to electric vehicles, increasing demand for energy storage systems, and advancements in battery materials.

Lithium-ion Batteries Going Head-to-head with Lead-acid Ones

Lead-ion batteries are leading the battery materials market and will likely retain dominance during the forecast period. This is attributable to the rising usage of lead-acid batteries across several industries because of their reliability, durability, and cost-effectiveness.

Lead-acid batteries are among the widely used types of batteries globally. They are relatively inexpensive and easy to manufacture. As a result, these batteries find usage in start-stop systems of automobiles, backup power systems, and other applications, thereby creating high demand for battery materials.

However, lithium-ion batteries are gradually making significant inroads into emerging markets like automotive and consumer electronics. This is due to their advantages, such as high energy density, better efficiency, and longer cycle life. Driven by this, lithium-ion battery materials demand is set to rise significantly.

Ongoing technological advancements in lithium-ion batteries and decreasing costs are expected to fuel their adoption. This will create demand for lithium battery materials like graphite, graphene, titanate, iron phosphate, cobalt oxide, electrolytes, and separators.

Due to their attractive advantages, lead-acid batteries are expected to face high competition from lithium-ion batteries. High adoption of lithium-ion batteries in electric vehicles, consumer electronics, and other applications is likely to create demand for lithium-ion materials and improve market share of the target segment through 2033.

United States Likely to Retain its Dominance Through 2033

The United States is expected to dominate the global battery materials industry during the forecast period. This is due to rapid growth of the renewable energy sector, increasing popularity of electric & hybrid vehicles, and presence of top battery material manufacturers.

Rising environmental concerns and increasing energy demand are attractive huge investments in renewable energy sources and energy-efficient vehicles in the United States. This, in turn, is expected to create a high demand for battery materials.

Americans are also shifting their preference from gasoline and diesel-powered vehicles to electric ones to reduce emissions and comply with regulations. This is anticipated to bolster sales of battery materials in the country.

Manufacturers Using Innovation as a Success Tool

The massive predicted valuation of US$ 102.8 billion indicates the huge potential of the battery materials industry. This might lure companies to try their hands in the battery material business, making it more competitive.

Key companies are using innovation to develop novel battery materials that can store more energy, last longer, and charge & discharge faster. This is helping them boost revenues and remain ahead of the curve. This is anticipated to foster the global battery materials market growth.

As the world continues to seek more efficient, longer-lasting, and sustainable energy storage solutions, innovations in battery materials will remain a hotbed of research and development. Researchers and battery material companies are exploring novel anode and cathode materials like high-nickel formulations and silicon.

Several companies are also developing more sustainable and recyclable battery materials, which could help reduce the environmental impact of battery production and disposal. This will boost the revenue of the battery material producers.

Innovations in battery materials and chemistry also lead to performance, safety, and cost-effectiveness breakthroughs. Hence, companies will continue to innovate to solidify their position in the battery materials market.

Battery materials make components like cathode, anode, electrolyte, and separator. They allow batteries to store and release energy.

Different battery materials are used to make specific batteries. For instance, lithium-ion batteries generally use graphite for anode, lithium cobalt oxide for cathode, and a lithium salt dissolved in a solvent for electrolytes.

Lead-acid batteries use lead and lead dioxide for electrodes and sulfuric acid for electrolytes. Subsequently, nickel and cadmium as electrodes and potassium hydroxide as electrolyte are used in nickel-cadmium batteries.

Battery materials are vital to developing new energy technologies, including renewable energy storage and electric vehicles. They are witnessing high demand due to the increasing adoption of batteries across several industries.

The global battery materials industry is projected to thrive during the forecast period. This is due to the growing trend of electrification, high adoption of electric vehicles, and expansion of the renewable energy sector.

Nations worldwide invest huge amounts to develop and expand their renewable energy infrastructure. This is expected to create high demand for energy storage systems, fostering growth in the battery materials market.

Leading battery material producers are developing new and improved battery materials. These new materials can help to make renewable energy more affordable and accessible, eventually reducing the world’s reliance on fossil fuels.

Historical Performance Vs Battery Materials Market Forecast

Global battery material sales revenue grew at a CAGR of about 7.8% from 2018 to 2022. Total market value reached around US$ 54.1 billion at the end of 2022. In the assessment period, the target market is poised to exhibit a CAGR of 5.9%,

Historical CAGR (2018 to 2022) 7.8%
Forecast CAGR (2023 to 2033) 5.9%

The worldwide battery materials industry witnessed robust growth between 2018 and 2022. This was due to high adoption of consumer electronics.

There was a spike in demand for consumer electronic devices like smartphones, laptops, tablets, etc., during the COVID-19 pandemic due to the rise of remote work and online learning. This created high demand for battery materials, as most consumer electronics rely on rechargeable batteries.

The increased installation of renewable energy systems that rely on energy storage solutions also boosted global sales of battery materials. With these dynamics, the global battery materials market totaled a valuation of US$ 54.1 billion in 2022.

Nikhil Kaitwade
Nikhil Kaitwade

Principal Consultant

Talk to Analyst

Find your sweet spots for generating winning opportunities in this market.

Global Market Dynamics of Battery Materials for Projected Period

The global market for battery materials is forecast to attain a valuation of US$ 102.8 billion by 2033, despite reduced CAGR. This is attributable to increasing adoption of electric & hybrid vehicles, increasing investments in solar and wind power, and continuous advancements in battery technology and materials.

The electric vehicle sector is witnessing exponential growth, and the trend will likely continue in the upcoming years. This is due to rising environmental concerns, high demand for clean technologies, and increasing government initiatives and regulations to encourage adoption of electric vehicles.

According to the International Energy Association (IEA), around 2.3 million electric cars were sold in the first quarter of 2023. Total electric vehicle sales are estimated to reach 14 million by the end of 2023.

The robust outlook of EVs is expected to expand battery manufacturing worldwide. This will uplift global demand for battery materials during the forecast period.

Lithium, nickel, graphite, and cobalt are used in lithium-ion batteries of electric vehicles. Hence, increasing production and sales of EVs is set to create growth opportunities for battery material manufacturers.

Growing popularity of new battery technologies and advancements in battery materials are anticipated to foster market growth. Novel battery technologies like lithium-sulfur (Li-S), solid-state, and lithium-air (Li-air) batteries are gaining wider popularity. This is because they have a much higher energy density than lithium-ion batteries.

Companies like BASF produce and supply high-performance cathode active materials (CAM) for electric vehicles and battery producers globally. They are innovating to meet the evolving requirements of end users.

Businesses providing new solutions for transforming to a circular economy will likely get a competitive advantage. As a result, companies are bringing new ideas and introducing ambitious circular economy programs.

For instance, BASF launched a new Circular Economy Program in December 2020.The company expects to double its sales generated with circular economy by 2030.

Semi Annual Market Update

Particular Value CAGR
H1 5.70% (2022 to 2032)
H2 5.80% (2022 to 2032)
H1 6.10 (2023 to 2033)
H2 5.50% (2023 to 2033)

Key Battery Materials Market Trends and Growth Drivers

  • Rising demand for battery materials from automotive, consumer electronics, and industrial machinery sectors is expected to boost the battery materials market across globe
  • Growing popularity of electric vehicles due to rapid shift towards clean energy and rising fuel costs is set to fuel demand for battery materials
  • Increasing government initiatives, incentives, and subsidies to encourage adoption of EVs and renewable energy systems are likely to bolster battery material sales
  • Developing new eco-friendly materials with high energy densities and growing adoption of recycled lithium-ion batteries are key battery materials market trends
  • Burgeoning demand for consumer electronics, such as smartphones and laptops, is forecast to uplift battery materials demand

Get the data you need at a Fraction of the cost

Personalize your report by choosing insights you need
and save 40%!

Battery Materials Market Opportunities

  • Rising investments in expanding renewable energy infrastructure are anticipated to present opportunities for battery material manufacturers
  • Growing usage of batteries in energy storage devices is likely to create growth prospects for the market
  • Innovation in battery technology and materials is expected to bode well for the battery materials industry
  • Increasing focus on developing next-generation lithium batteries is forecast to create demand for novel materials like lithium-nickel-cobalt-aluminum oxide (NCA) and others
  • Rising government support for the battery materials industry is another key factor expected to create growth prospects
  • Expansion of battery raw materials industry across developed and developing regions is likely to create opportunities for companies
  • Ongoing advances in lithium-ion battery materials might further boost the target market

Battery Materials Market Constraints

  • Fluctuation in battery material prices is restraining market growth
  • Harmful effects of certain battery materials are also negatively impacting the target market
  • Inadequate EV charging infrastructure in several regions might limit market expansion
  • Environmental concerns related to mining of certain battery materials are also challenging the market


Comparative View of the Battery Materials Market

The global battery materials industry is likely to be impacted by the tangential or peer markets in the chemical and materials division. These include other markets, such as the sodium sulfur batteries market and lithium ion separator market. Analysis of these related markets can help companies to get in-depth analysis of the battery materials market.

Battery Materials Market:

Attributes Battery Materials Market
CAGR (2023 to 2033) 5.9%
Market Value (2023) US$ 102.8 billion
Growth Factor Rising adoption of electric vehicles and portable consumer electronic devices is expected to boost the global battery materials market.
Key Trend Innovation in battery technologies and materials is a key trend observed in the market.

  Sodium Sulfur Batteries Industry:

Attributes Sodium Sulfur Batteries Industry
CAGR (2023 to 2033) ~30.0%
Market Value (2023) US$ 170.3 million
Growth Factor Rising demand for energy storage solutions due to expanding renewable energy sector is expected to boost the sodium sulfur batteries market.
Key Trend Innovation in sodium sulfur batteries to improve performance and reduce their costs is a key trend in the market.  

Lithium Ion Battery Separator Market:

Attributes Lithium Ion Battery Separator Market
CAGR (2023 to 2033) 7.2%
Market Value (2023) ~US$ 1742.0 million
Growth Factor Growing usage of lithium-ion batteries in  automotive and industrial applications is expected to boost the global lithium ion battery separator industry.
Key Trend Burgeoning demand for consumer electronic devices like smartphones, tablets, and laptops is likely to drive demand for lithium ion battery separators through 2033.

Country-wise Insights

The table below highlights key countries’ battery materials market revenue. The United States, China, and Japan are the three key markets for battery materials, with projected valuations of US$ 18.0 billion, US$ 14.9 billion, and US$ 10.1 billion, respectively, in 2033. 

Countries like the United Kingdom, South Korea, and India are expected to present revenue-generation opportunities for battery material manufacturers. This is due to rising production and sales of vehicles, favorable government support, and rapid industrial growth.

Countries Market Value (2033)
United States US$ 18.0 billion 
United Kingdom  US$ 3.7 billion
China US$ 14.9 billion 
Japan US$ 10.1 billion
South Korea US$ 5.3 billion

Below table shows the estimated battery materials market growth rates of the top five countries. The United Kingdom, Korea, and Japan are set to experience higher CAGRs of 6.8%, 8.3%, and 7.1%, respectively, through 2033.

Countries Projected Battery Materials Market CAGR (2023 to 2033)
United States 6.1% 
United Kingdom  6.8%
China 6.3% 
Japan 7.1% 
South Korea 8.3%

The table below highlights the top five countries’ historical market growth rates. With CAGRs of 9.7%, 9.1%, and 9.0%, respectively, South Korea, the United Kingdom, and Japan were the key markets for battery material between 2018 and 2022.

Countries Historical Battery Materials Market CAGR (2018 to 2022)
United States 8.1%
United Kingdom  9.1%
China 8.4%
Japan 9.0%
South Korea 9.7%

Expanding Renewable Energy Sector Driving Demand in the United States

The United States battery materials market size is forecast to reach US$ 18.0 billion by 2033. Over the assessment period, battery material demand in the country is projected to rise at 6.1% CAGR.

As per the latest report, the United States is expected to lead the global battery materials market during the forecast period. This is attributable to robust growth of renewable energy sector, growing demand for electric vehicles, and heavy presence of leading automakers.

Amid escalating energy demand and growing environmental concerns, the United States is transitioning towards renewable sources like solar and wind. According to the Solar Energy Industries Association, the United States solar industry installed a total capacity of around 6.1 gigawatts-direct current in the first quarter of 2023.

Expanding renewable energy sector is expected to generate high demand for energy storage systems (ESS). This will positively impact battery material sales in the country during the forecast period.

Rising preference for electric vehicles is another key factor expected to fuel demand for battery materials in the United States. Subsequently, introduction of the Inflation Reduction Act (IRA) is improving the United States battery materials market share.

The IRA is prompting global electromobility companies to expand their operations in the United States. This is expected to create lucrative opportunities for battery material manufacturers and foster growth in the lithium battery materials industry in the United States.

Rising Popularity of Electric Vehicles to Bolster Sales in China

China battery materials market value is predicted to total US$ 14.9 billion by 2033. Over the forecast period, sales of battery materials in the country are likely to soar at around 6.3% CAGR. This is attributable to growing adoption of electric vehicles and technological advancements in battery materials.

China leads from the forefront in electric vehicle manufacturing and sales. It was the leading country for electric vehicles in 2020, with around 4.5 million electric cars, as per the International Energy Association (IEA).

Globally, China accounted for around 60% of all new car registrations in 2022. This growing popularity of electric vehicles is expected to fuel sales of battery materials like lithium, graphite, nickel, cobalt, and others.

China is also home to several top battery material manufacturing companies. These companies are constantly developing new battery technologies that need novel battery materials.

For instance, several China-based companies are concentrating on developing next-generation lithium-ion batteries. This will create demand for novel materials like lithium-nickel-manganese-cobalt oxide (NMC) and lithium-nickel-cobalt-aluminum oxide (NCA).

Rising Investments in Renewable Energy Boosting the United Kingdom

The United Kingdom battery materials market is expected to thrive at a CAGR of 6.8% during the assessment period. By 2033, total market valuation is anticipated to reach US$ 3.7 billion in the country.

Several factors are driving the United Kingdom battery materials industry forward. These include increasing investments in renewable energy sources and rising government support for developing clean energy technologies like battery storage and EVs.

Escalating energy demand across the United Kingdom puts renewable energy sources like wind and solar power into the spotlight. The country is investing rigorously in developing and expanding its renewable energy infrastructure.

Expansion of renewable energy infrastructure is expected to create demand for energy storage systems that use batteries to store excess energy. This, in turn, is set to boost the battery materials market in the country.

In March 2023, the European Union adopted new CO2 standards for vans and cars to reduce emissions. As a result, European automotive companies are racing to develop battery electric vehicles (BEVs) as quickly as possible. This will bode well for the battery materials industry.

Growing Electrification Trend to Create Growth Prospects in Japan

Japan is emerging as a lucrative market for battery material manufacturers globally. This is due to the growing trend towards electrification, favorable government support, and high adoption of electric vehicles.

Japan battery materials market size is projected to reach US$ 10.1 billion by 2033. Overall sales of battery materials in Japan are likely to rise at a CAGR of 7.1% during the assessment period.

Japan is emerging as one of the leading markets for electric vehicles globally. The government in Japan is providing subsidies and tax breaks to encourage the adoption of EVs. This is driving demand for battery materials like lithium and nickel, and the trend is expected to continue through 2033.

Thanks to rising popularity of battery electric vehicles, the scope of the lithium-ion battery materials market in Japan is vast. It is likely to remain a key market for manufacturers of battery materials.

Every vehicle manufactured by Japanese automobile companies will be electrified by 2050, according to the Ministry of Economy, Trade and Industry (METI). This is expected to create demand for battery materials.

The large presence of the world’s leading battery manufacturers like Sony and Panasonic is also expected to boost market revenue in Japan. These companies are investing in new battery technologies, including solid-state batteries, which will likely fuel demand for battery materials.

Increasing Adoption of Consumer Electronics to Fuel Demand in Korea

South Korea is set to register a robust CAGR of 8.3% during the assessment period compared to the 9.7% CAGR recorded from 2018 to 2022. Total market valuation in the country is forecast to reach US$ 5.3 billion by 2033.

Multiple factors drive growth in South Korea battery materials industry. These include rising consumer electronics adoption and shifting towards energy-efficient vehicles like EVs.

Amid high penetration of digitalization and fast-speed internet, usage of consumer electronic devices like laptops and smartphones across Korea is expected to rise rapidly. These portable electronic devices rely on rechargeable batteries. As a result, their high adoption will likely create high demand for battery materials.

Rapid shift towards electric vehicles creates opportunities for battery material manufacturers in Korea. It is also prompting them to use tactics like partnerships and collaborations.

For instance, South Korean battery material manufacturers are forming partnerships with global EV companies to secure long-term contracts. This is expected to foster the battery materials market growth in Korea.

Category-wise Insights

Below section shows the lead-acid segment dominating the market based on battery type. It is predicted to expand at 5.7% CAGR between 2023 and 2033.

Based on application, automotive segment is set to hold a prominent market share. It will likely thrive at a CAGR of 5.4% during the forecast period.

Lead-acid Batteries to Generate Significant Revenue in the Market

Top Segment (Battery Type) Lead-acid
Predicted CAGR (2023 to 2033) 5.7%

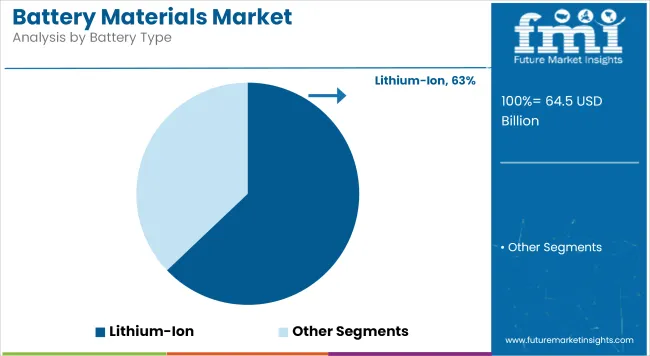
The battery materials market by battery type is categorized into lithium-ion, lead-acid, and others. Among these, the lead-acid battery segment is expected to generate significant revenue in the target market. This is due to rising adoption of lead-acid batteries across several industries.

As per the latest report, lead-acid segment is poised to exhibit a CAGR of 5.7% during the forecast period. Historically, the same segment expanded at 7.5% CAGR.

Lead-acid batteries have been a popular battery type used globally for a long time. This is due to the reliable and cost-effective nature of these energy storage options. These batteries are also easy to manufacture.

Growing usage of lead-acid batteries in vehicles, UPS systems, grid-scale power systems, etc., is expected to create high demand for battery materials. These batteries are composed of anode, cathode, electrolyte, and separator.

Lead-acid batteries are known for their cost-effectiveness, reliability, durability, and eco-friendliness. They are widely used in automotive start-stop systems and backup power systems. As the need for cost-effective and reliable energy storage options continues to rise, so will the sales of lead-acid batteries and battery materials.

On the other hand, lithium-ion batteries are rising in popularity due to their advantages, like high energy density. They are increasingly used in applications like consumer electronics and electric vehicles. Growing popularity of these batteries is set to drive demand for lithium battery materials.

Automotive Sector to Create Ample Opportunities for Manufacturers

Top Segment (Application) Automotive
Projected CAGR (2023 to 2033) 5.4%

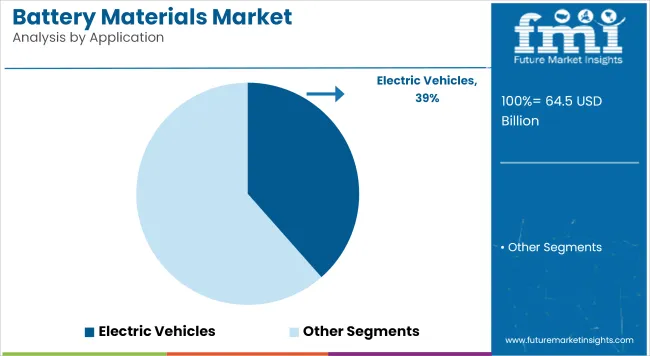
As per the latest report, automotive industry is expected to create lucrative opportunities for battery material manufacturers during the forecast period. This is due to rising production and sales of automobiles and growing popularity of electric vehicles.

From 2018 to 2022, automotive segment exhibited a CAGR of 7.4%. In the assessment period, a CAGR of 5.4% has been estimated for the automotive segment, making it the primary target for battery materials producers to boost their revenues.

As electrification continues to make strides in the automotive industry, usage of batteries in vehicles is set to increase substantially. This, in turn, is expected to fuel demand for battery materials during the forecast period and boost the target segment.

Implementing stringent regulations for encouraging adoption of electric and hybrid cars is another key factor expected to drive growth of the automotive EV segments. These two segments together are expected to hold a dominant market share through 2033.

Battery Materials Market Competition

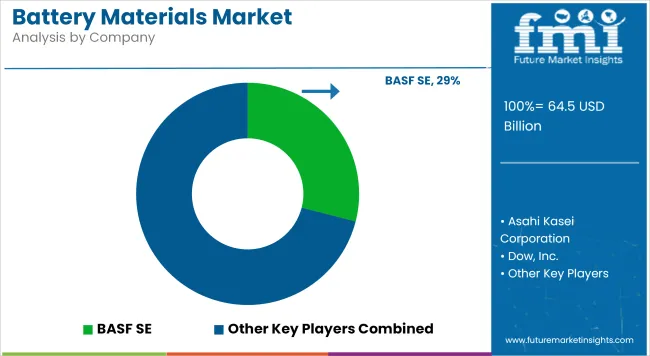
Key manufacturers of battery materials listed in the report include Asahi Kasei Corporation, BASF SE, Dow, Inc., DuPont de Nemours, Inc., Entek International, Gravita’ India Limited, Hitachi Chemical Co., Ltd., Johnson Matthey PLC, Kureha Corporation, and Mitsubishi Chemical Corporation.

These top battery material companies are spending heavily on research and development to advance battery material technology and meet rising demand from the growing electric vehicle industry. They are also establishing new manufacturing facilities and adopting strategies such as acquisitions, joint ventures, mergers, alliances, partnerships, alliances, and collaborations to expand their portfolios and footprint.

Recent Developments in Battery Materials Market:

  • In March 2023, ENTEK, the United States-based producer of wet process lithium-ion battery separators, disclosed the location of first lithium battery separator plant in Indiana to support the booming electric vehicle (EV) industry in Indiana and rest of the United States.
  • In September 2023, Nanotech Energy and BASF, a leading battery materials producer, partnered to manufacturer lithium-ion batteries with native recycled content and low CO2 footprint in North America. Cathode-active materials made by BASF will be used in Nanotech Energy’s lithium-ion battery cells. The companies will also benefit from the bright future of battery materials recycling market.
  • In May 2022, the sale of its Battery Materials business was announced by Johnson Matthey to EV Metals Group.
  • In July 2023, Asahi Kasei initiated licensing of design & manufacturing technology for lithium-ion capacitors based on its proprietary lithium pre-doping technology.
  • In August 2021, Shanshan and BASF formed a joint venture ‘BASF and Shanshan Battery Materials Co., Ltd.’ to focus on the rising electric vehicle segment in China battery materials market.
  • In May 2023, Huntsman developed new polyurethane, carbon nanotube, and epoxy materials to boost battery performance and protection.
  • In November 2021, Dow unveiled a new generation of high-bonding adhesives for EV batteries.
  • In April 2023, CATL introduced condensed battery integrated with innovative technologies like ultra-high energy density cathode materials, separators, novel anode materials, etc.

Scope of Battery Materials Market

Attribute Details
Estimated Market Value (2023) US$ 57.9 billion
Projected Market Value (2033) US$ 102.8 billion
Anticipated Growth Rate (2023 to 2033) 5.9% CAGR
Historical Data 2018 to 2022
Forecast Period 2023 to 2033
Quantitative Units Revenue in US$ Billion, Volume (Tons), and CAGR from 2023 to 2033
Segments Covered Battery Type, Application, and Region
Regions Covered North America, Latin America, Western Europe, Eastern Europe, South Asia and Pacific, East Asia, and the Middle East & Africa
Key Countries Covered United States, Canada, Brazil, Mexico, Germany, United Kingdom, France, Italy, Spain, Nordic, Russia, Poland, China, India, Thailand, Indonesia, Australia and New Zealand, Japan, GCC countries, North Africa, South Africa, and others.
Key Companies Profiled
  • Asahi Kasei Corporation
  • BASF SE
  • Dow, Inc.
  • DuPont de Nemours, Inc
  • Entek International
  • Gravita India Limited
  • Hitachi Chemical Co., Ltd.
  • Johnson Matthey PLC
  • Kureha Corporation
  • Mitsubishi Chemical Corporation

Battery Materials Market Overview based on Segments

Battery Materials Market by Battery Type:

  • Lead-Acid
  • Lithium-Ion
  • Others

Battery Materials Market by Application:

  • Automotive
  • EVs
  • Portable Devices
  • Industrial
  • Others

Battery Materials Market by Region:

  • North America
  • Latin America
  • Western Europe
  • Eastern Europe
  • East Asia
  • South Asia and Pacific
  • Middle East and Africa

Frequently Asked Questions

What was the global battery materials market size in 2022?

The global market size totaled US$ 54.1 billion in 2022.

How big is the global battery materials market?

The global market value is set to reach US$ 57.9 billion in 2023.

What is the future of the battery materials industry?

By 2033, the global industry is projected to reach US$ 102.8 billion by 2033.

What value CAGR did the global market exhibit from 2018 to 2022?

The global market registered a CAGR of 7.8% from 2018 to 2022.

What is the demand outlook for battery materials market?

Global battery demand is forecast to rise at 5.9% CAGR through 2033.

What are the 3 main trends in the battery materials industry?

Adoption of lithium-ion batteries, innovation in materials, and electrification are key trends.

How much is the battery materials market worth in the United States?

The United States market value is set to reach US$ 18.0 billion by 2033.

Who is the market leader in battery materials?

Asahi Kasei Corporation and BASF SE are among few market leaders.

Table of Content

1. Executive Summary

    1.1. Global Market Outlook

    1.2. Demand-side Trends

    1.3. Supply-side Trends

    1.4. Technology Roadmap Analysis

    1.5. Analysis and Recommendations

2. Market Overview

    2.1. Market Coverage / Taxonomy

    2.2. Market Definition / Scope / Limitations

3. Market Background

    3.1. Market Dynamics

        3.1.1. Drivers

        3.1.2. Restraints

        3.1.3. Opportunity

        3.1.4. Trends

    3.2. Scenario Forecast

        3.2.1. Demand in Optimistic Scenario

        3.2.2. Demand in Likely Scenario

        3.2.3. Demand in Conservative Scenario

    3.3. Opportunity Map Analysis

    3.4. Product Life Cycle Analysis

    3.5. Supply Chain Analysis

        3.5.1. Supply Side Participants and their Roles

            3.5.1.1. Producers

            3.5.1.2. Mid-Level Participants (Traders/ Agents/ Brokers)

            3.5.1.3. Wholesalers and Distributors

        3.5.2. Value Added and Value Created at Node in the Supply Chain

        3.5.3. List of Raw Material Suppliers

        3.5.4. List of Existing and Potential Buyer’s

    3.6. Investment Feasibility Matrix

    3.7. Value Chain Analysis

        3.7.1. Profit Margin Analysis

        3.7.2. Wholesalers and Distributors

        3.7.3. Retailers

    3.8. PESTLE and Porter’s Analysis

    3.9. Regulatory Landscape

        3.9.1. By Key Regions

        3.9.2. By Key Countries

    3.10. Regional Parent Market Outlook

    3.11. Production and Consumption Statistics

    3.12. Import and Export Statistics

4. Global Market Analysis 2018 to 2022 and Forecast, 2023 to 2033

    4.1. Historical Market Size Value (US$ Billion) & Volume (Tons) Analysis, 2018 to 2022

    4.2. Current and Future Market Size Value (US$ Billion) & Volume (Tons) Projections, 2023 to 2033

        4.2.1. Y-o-Y Growth Trend Analysis

        4.2.2. Absolute $ Opportunity Analysis

5. Global Market Analysis 2018 to 2022 and Forecast 2023 to 2033, By Battery Type

    5.1. Introduction / Key Findings

    5.2. Historical Market Size Value (US$ Billion) & Volume (Tons) Analysis By Battery Type, 2018 to 2022

    5.3. Current and Future Market Size Value (US$ Billion) & Volume (Tons) Analysis and Forecast By Battery Type, 2023 to 2033

        5.3.1. Lead-Acid

        5.3.2. Lithium-Ion

        5.3.3. Others

    5.4. Y-o-Y Growth Trend Analysis By Battery Type, 2018 to 2022

    5.5. Absolute $ Opportunity Analysis By Battery Type, 2023 to 2033

6. Global Market Analysis 2018 to 2022 and Forecast 2023 to 2033, By Application

    6.1. Introduction / Key Findings

    6.2. Historical Market Size Value (US$ Billion) & Volume (Tons) Analysis By Application, 2018 to 2022

    6.3. Current and Future Market Size Value (US$ Billion) & Volume (Tons) Analysis and Forecast By Application, 2023 to 2033

        6.3.1. Automotive

        6.3.2. EVs

        6.3.3. Portable Devices

        6.3.4. Industrial

        6.3.5. Others

    6.4. Y-o-Y Growth Trend Analysis By Application, 2018 to 2022

    6.5. Absolute $ Opportunity Analysis By Application, 2023 to 2033

7. Global Market Analysis 2018 to 2022 and Forecast 2023 to 2033, By Region

    7.1. Introduction

    7.2. Historical Market Size Value (US$ Billion) & Volume (Tons) Analysis By Region, 2018 to 2022

    7.3. Current Market Size Value (US$ Billion) & Volume (Tons) Analysis and Forecast By Region, 2023 to 2033

        7.3.1. North America

        7.3.2. Latin America

        7.3.3. Western Europe

        7.3.4. Eastern Europe

        7.3.5. South Asia and Pacific

        7.3.6. East Asia

        7.3.7. Middle East and Africa

    7.4. Market Attractiveness Analysis By Region

8. North America Market Analysis 2018 to 2022 and Forecast 2023 to 2033, By Country

    8.1. Historical Market Size Value (US$ Billion) & Volume (Tons) Trend Analysis By Market Taxonomy, 2018 to 2022

    8.2. Market Size Value (US$ Billion) & Volume (Tons) Forecast By Market Taxonomy, 2023 to 2033

        8.2.1. By Country

            8.2.1.1. United States

            8.2.1.2. Canada

        8.2.2. By Battery Type

        8.2.3. By Application

    8.3. Market Attractiveness Analysis

        8.3.1. By Country

        8.3.2. By Battery Type

        8.3.3. By Application

    8.4. Key Takeaways

9. Latin America Market Analysis 2018 to 2022 and Forecast 2023 to 2033, By Country

    9.1. Historical Market Size Value (US$ Billion) & Volume (Tons) Trend Analysis By Market Taxonomy, 2018 to 2022

    9.2. Market Size Value (US$ Billion) & Volume (Tons) Forecast By Market Taxonomy, 2023 to 2033

        9.2.1. By Country

            9.2.1.1. Brazil

            9.2.1.2. Mexico

            9.2.1.3. Rest of Latin America

        9.2.2. By Battery Type

        9.2.3. By Application

    9.3. Market Attractiveness Analysis

        9.3.1. By Country

        9.3.2. By Battery Type

        9.3.3. By Application

    9.4. Key Takeaways

10. Western Europe Market Analysis 2018 to 2022 and Forecast 2023 to 2033, By Country

    10.1. Historical Market Size Value (US$ Billion) & Volume (Tons) Trend Analysis By Market Taxonomy, 2018 to 2022

    10.2. Market Size Value (US$ Billion) & Volume (Tons) Forecast By Market Taxonomy, 2023 to 2033

        10.2.1. By Country

            10.2.1.1. Germany

            10.2.1.2. United Kingdom

            10.2.1.3. France

            10.2.1.4. Spain

            10.2.1.5. Italy

            10.2.1.6. Rest of Western Europe

        10.2.2. By Battery Type

        10.2.3. By Application

    10.3. Market Attractiveness Analysis

        10.3.1. By Country

        10.3.2. By Battery Type

        10.3.3. By Application

    10.4. Key Takeaways

11. Eastern Europe Market Analysis 2018 to 2022 and Forecast 2023 to 2033, By Country

    11.1. Historical Market Size Value (US$ Billion) & Volume (Tons) Trend Analysis By Market Taxonomy, 2018 to 2022

    11.2. Market Size Value (US$ Billion) & Volume (Tons) Forecast By Market Taxonomy, 2023 to 2033

        11.2.1. By Country

            11.2.1.1. Poland

            11.2.1.2. Russia

            11.2.1.3. Czech Republic

            11.2.1.4. Romania

            11.2.1.5. Rest of Eastern Europe

        11.2.2. By Battery Type

        11.2.3. By Application

    11.3. Market Attractiveness Analysis

        11.3.1. By Country

        11.3.2. By Battery Type

        11.3.3. By Application

    11.4. Key Takeaways

12. South Asia and Pacific Market Analysis 2018 to 2022 and Forecast 2023 to 2033, By Country

    12.1. Historical Market Size Value (US$ Billion) & Volume (Tons) Trend Analysis By Market Taxonomy, 2018 to 2022

    12.2. Market Size Value (US$ Billion) & Volume (Tons) Forecast By Market Taxonomy, 2023 to 2033

        12.2.1. By Country

            12.2.1.1. India

            12.2.1.2. Bangladesh

            12.2.1.3. Australia

            12.2.1.4. New Zealand

            12.2.1.5. Rest of South Asia and Pacific

        12.2.2. By Battery Type

        12.2.3. By Application

    12.3. Market Attractiveness Analysis

        12.3.1. By Country

        12.3.2. By Battery Type

        12.3.3. By Application

    12.4. Key Takeaways

13. East Asia Market Analysis 2018 to 2022 and Forecast 2023 to 2033, By Country

    13.1. Historical Market Size Value (US$ Billion) & Volume (Tons) Trend Analysis By Market Taxonomy, 2018 to 2022

    13.2. Market Size Value (US$ Billion) & Volume (Tons) Forecast By Market Taxonomy, 2023 to 2033

        13.2.1. By Country

            13.2.1.1. China

            13.2.1.2. Japan

            13.2.1.3. South Korea

        13.2.2. By Battery Type

        13.2.3. By Application

    13.3. Market Attractiveness Analysis

        13.3.1. By Country

        13.3.2. By Battery Type

        13.3.3. By Application

    13.4. Key Takeaways

14. Middle East and Africa Market Analysis 2018 to 2022 and Forecast 2023 to 2033, By Country

    14.1. Historical Market Size Value (US$ Billion) & Volume (Tons) Trend Analysis By Market Taxonomy, 2018 to 2022

    14.2. Market Size Value (US$ Billion) & Volume (Tons) Forecast By Market Taxonomy, 2023 to 2033

        14.2.1. By Country

            14.2.1.1. GCC Countries

            14.2.1.2. South Africa

            14.2.1.3. Israel

            14.2.1.4. Rest of Middle East & Africa

        14.2.2. By Battery Type

        14.2.3. By Application

    14.3. Market Attractiveness Analysis

        14.3.1. By Country

        14.3.2. By Battery Type

        14.3.3. By Application

    14.4. Key Takeaways

15. Key Countries Market Analysis

    15.1. United States

        15.1.1. Pricing Analysis

        15.1.2. Market Share Analysis, 2023

            15.1.2.1. By Battery Type

            15.1.2.2. By Application

    15.2. Canada

        15.2.1. Pricing Analysis

        15.2.2. Market Share Analysis, 2023

            15.2.2.1. By Battery Type

            15.2.2.2. By Application

    15.3. Brazil

        15.3.1. Pricing Analysis

        15.3.2. Market Share Analysis, 2023

            15.3.2.1. By Battery Type

            15.3.2.2. By Application

    15.4. Mexico

        15.4.1. Pricing Analysis

        15.4.2. Market Share Analysis, 2023

            15.4.2.1. By Battery Type

            15.4.2.2. By Application

    15.5. Germany

        15.5.1. Pricing Analysis

        15.5.2. Market Share Analysis, 2023

            15.5.2.1. By Battery Type

            15.5.2.2. By Application

    15.6. United Kingdom

        15.6.1. Pricing Analysis

        15.6.2. Market Share Analysis, 2023

            15.6.2.1. By Battery Type

            15.6.2.2. By Application

    15.7. France

        15.7.1. Pricing Analysis

        15.7.2. Market Share Analysis, 2023

            15.7.2.1. By Battery Type

            15.7.2.2. By Application

    15.8. Spain

        15.8.1. Pricing Analysis

        15.8.2. Market Share Analysis, 2023

            15.8.2.1. By Battery Type

            15.8.2.2. By Application

    15.9. Italy

        15.9.1. Pricing Analysis

        15.9.2. Market Share Analysis, 2023

            15.9.2.1. By Battery Type

            15.9.2.2. By Application

    15.10. Poland

        15.10.1. Pricing Analysis

        15.10.2. Market Share Analysis, 2023

            15.10.2.1. By Battery Type

            15.10.2.2. By Application

    15.11. Russia

        15.11.1. Pricing Analysis

        15.11.2. Market Share Analysis, 2023

            15.11.2.1. By Battery Type

            15.11.2.2. By Application

    15.12. Czech Republic

        15.12.1. Pricing Analysis

        15.12.2. Market Share Analysis, 2023

            15.12.2.1. By Battery Type

            15.12.2.2. By Application

    15.13. Romania

        15.13.1. Pricing Analysis

        15.13.2. Market Share Analysis, 2023

            15.13.2.1. By Battery Type

            15.13.2.2. By Application

    15.14. India

        15.14.1. Pricing Analysis

        15.14.2. Market Share Analysis, 2023

            15.14.2.1. By Battery Type

            15.14.2.2. By Application

    15.15. Bangladesh

        15.15.1. Pricing Analysis

        15.15.2. Market Share Analysis, 2023

            15.15.2.1. By Battery Type

            15.15.2.2. By Application

    15.16. Australia

        15.16.1. Pricing Analysis

        15.16.2. Market Share Analysis, 2023

            15.16.2.1. By Battery Type

            15.16.2.2. By Application

    15.17. New Zealand

        15.17.1. Pricing Analysis

        15.17.2. Market Share Analysis, 2023

            15.17.2.1. By Battery Type

            15.17.2.2. By Application

    15.18. China

        15.18.1. Pricing Analysis

        15.18.2. Market Share Analysis, 2023

            15.18.2.1. By Battery Type

            15.18.2.2. By Application

    15.19. Japan

        15.19.1. Pricing Analysis

        15.19.2. Market Share Analysis, 2023

            15.19.2.1. By Battery Type

            15.19.2.2. By Application

    15.20. South Korea

        15.20.1. Pricing Analysis

        15.20.2. Market Share Analysis, 2023

            15.20.2.1. By Battery Type

            15.20.2.2. By Application

    15.21. GCC Countries

        15.21.1. Pricing Analysis

        15.21.2. Market Share Analysis, 2023

            15.21.2.1. By Battery Type

            15.21.2.2. By Application

    15.22. South Africa

        15.22.1. Pricing Analysis

        15.22.2. Market Share Analysis, 2023

            15.22.2.1. By Battery Type

            15.22.2.2. By Application

    15.23. Israel

        15.23.1. Pricing Analysis

        15.23.2. Market Share Analysis, 2023

            15.23.2.1. By Battery Type

            15.23.2.2. By Application

16. Market Structure Analysis

    16.1. Competition Dashboard

    16.2. Competition Benchmarking

    16.3. Market Share Analysis of Top Players

        16.3.1. By Regional

        16.3.2. By Battery Type

        16.3.3. By Application

17. Competition Analysis

    17.1. Competition Deep Dive

        17.1.1. Asahi Kasei Corporation

            17.1.1.1. Overview

            17.1.1.2. Product Portfolio

            17.1.1.3. Profitability by Market Segments

            17.1.1.4. Sales Footprint

            17.1.1.5. Strategy Overview

                17.1.1.5.1. Marketing Strategy

                17.1.1.5.2. Product Strategy

                17.1.1.5.3. Channel Strategy

        17.1.2. BASF SE

            17.1.2.1. Overview

            17.1.2.2. Product Portfolio

            17.1.2.3. Profitability by Market Segments

            17.1.2.4. Sales Footprint

            17.1.2.5. Strategy Overview

                17.1.2.5.1. Marketing Strategy

                17.1.2.5.2. Product Strategy

                17.1.2.5.3. Channel Strategy

        17.1.3. Dow, Inc.

            17.1.3.1. Overview

            17.1.3.2. Product Portfolio

            17.1.3.3. Profitability by Market Segments

            17.1.3.4. Sales Footprint

            17.1.3.5. Strategy Overview

                17.1.3.5.1. Marketing Strategy

                17.1.3.5.2. Product Strategy

                17.1.3.5.3. Channel Strategy

        17.1.4. DuPont de Nemours, Inc

            17.1.4.1. Overview

            17.1.4.2. Product Portfolio

            17.1.4.3. Profitability by Market Segments

            17.1.4.4. Sales Footprint

            17.1.4.5. Strategy Overview

                17.1.4.5.1. Marketing Strategy

                17.1.4.5.2. Product Strategy

                17.1.4.5.3. Channel Strategy

        17.1.5. Entek International

            17.1.5.1. Overview

            17.1.5.2. Product Portfolio

            17.1.5.3. Profitability by Market Segments

            17.1.5.4. Sales Footprint

            17.1.5.5. Strategy Overview

                17.1.5.5.1. Marketing Strategy

                17.1.5.5.2. Product Strategy

                17.1.5.5.3. Channel Strategy

        17.1.6. Gravita India Limited

            17.1.6.1. Overview

            17.1.6.2. Product Portfolio

            17.1.6.3. Profitability by Market Segments

            17.1.6.4. Sales Footprint

            17.1.6.5. Strategy Overview

                17.1.6.5.1. Marketing Strategy

                17.1.6.5.2. Product Strategy

                17.1.6.5.3. Channel Strategy

        17.1.7. Hitachi Chemical Co., Ltd.

            17.1.7.1. Overview

            17.1.7.2. Product Portfolio

            17.1.7.3. Profitability by Market Segments

            17.1.7.4. Sales Footprint

            17.1.7.5. Strategy Overview

                17.1.7.5.1. Marketing Strategy

                17.1.7.5.2. Product Strategy

                17.1.7.5.3. Channel Strategy

        17.1.8. Johnson Matthey PLC

            17.1.8.1. Overview

            17.1.8.2. Product Portfolio

            17.1.8.3. Profitability by Market Segments

            17.1.8.4. Sales Footprint

            17.1.8.5. Strategy Overview

                17.1.8.5.1. Marketing Strategy

                17.1.8.5.2. Product Strategy

                17.1.8.5.3. Channel Strategy

        17.1.9. Kureha Corporation;

            17.1.9.1. Overview

            17.1.9.2. Product Portfolio

            17.1.9.3. Profitability by Market Segments

            17.1.9.4. Sales Footprint

            17.1.9.5. Strategy Overview

                17.1.9.5.1. Marketing Strategy

                17.1.9.5.2. Product Strategy

                17.1.9.5.3. Channel Strategy

        17.1.10. Mitsubishi Chemical Corporation

            17.1.10.1. Overview

            17.1.10.2. Product Portfolio

            17.1.10.3. Profitability by Market Segments

            17.1.10.4. Sales Footprint

            17.1.10.5. Strategy Overview

                17.1.10.5.1. Marketing Strategy

                17.1.10.5.2. Product Strategy

                17.1.10.5.3. Channel Strategy

18. Assumptions & Acronyms Used

19. Research Methodology

List of Tables

Table 1: Global Market Value (US$ Billion) Forecast by Region, 2018 to 2033

Table 2: Global Market Volume (Tons) Forecast by Region, 2018 to 2033

Table 3: Global Market Value (US$ Billion) Forecast by Battery Type, 2018 to 2033

Table 4: Global Market Volume (Tons) Forecast by Battery Type, 2018 to 2033

Table 5: Global Market Value (US$ Billion) Forecast by Application, 2018 to 2033

Table 6: Global Market Volume (Tons) Forecast by Application, 2018 to 2033

Table 7: North America Market Value (US$ Billion) Forecast by Country, 2018 to 2033

Table 8: North America Market Volume (Tons) Forecast by Country, 2018 to 2033

Table 9: North America Market Value (US$ Billion) Forecast by Battery Type, 2018 to 2033

Table 10: North America Market Volume (Tons) Forecast by Battery Type, 2018 to 2033

Table 11: North America Market Value (US$ Billion) Forecast by Application, 2018 to 2033

Table 12: North America Market Volume (Tons) Forecast by Application, 2018 to 2033

Table 13: Latin America Market Value (US$ Billion) Forecast by Country, 2018 to 2033

Table 14: Latin America Market Volume (Tons) Forecast by Country, 2018 to 2033

Table 15: Latin America Market Value (US$ Billion) Forecast by Battery Type, 2018 to 2033

Table 16: Latin America Market Volume (Tons) Forecast by Battery Type, 2018 to 2033

Table 17: Latin America Market Value (US$ Billion) Forecast by Application, 2018 to 2033

Table 18: Latin America Market Volume (Tons) Forecast by Application, 2018 to 2033

Table 19: Western Europe Market Value (US$ Billion) Forecast by Country, 2018 to 2033

Table 20: Western Europe Market Volume (Tons) Forecast by Country, 2018 to 2033

Table 21: Western Europe Market Value (US$ Billion) Forecast by Battery Type, 2018 to 2033

Table 22: Western Europe Market Volume (Tons) Forecast by Battery Type, 2018 to 2033

Table 23: Western Europe Market Value (US$ Billion) Forecast by Application, 2018 to 2033

Table 24: Western Europe Market Volume (Tons) Forecast by Application, 2018 to 2033

Table 25: Eastern Europe Market Value (US$ Billion) Forecast by Country, 2018 to 2033

Table 26: Eastern Europe Market Volume (Tons) Forecast by Country, 2018 to 2033

Table 27: Eastern Europe Market Value (US$ Billion) Forecast by Battery Type, 2018 to 2033

Table 28: Eastern Europe Market Volume (Tons) Forecast by Battery Type, 2018 to 2033

Table 29: Eastern Europe Market Value (US$ Billion) Forecast by Application, 2018 to 2033

Table 30: Eastern Europe Market Volume (Tons) Forecast by Application, 2018 to 2033

Table 31: South Asia and Pacific Market Value (US$ Billion) Forecast by Country, 2018 to 2033

Table 32: South Asia and Pacific Market Volume (Tons) Forecast by Country, 2018 to 2033

Table 33: South Asia and Pacific Market Value (US$ Billion) Forecast by Battery Type, 2018 to 2033

Table 34: South Asia and Pacific Market Volume (Tons) Forecast by Battery Type, 2018 to 2033

Table 35: South Asia and Pacific Market Value (US$ Billion) Forecast by Application, 2018 to 2033

Table 36: South Asia and Pacific Market Volume (Tons) Forecast by Application, 2018 to 2033

Table 37: East Asia Market Value (US$ Billion) Forecast by Country, 2018 to 2033

Table 38: East Asia Market Volume (Tons) Forecast by Country, 2018 to 2033

Table 39: East Asia Market Value (US$ Billion) Forecast by Battery Type, 2018 to 2033

Table 40: East Asia Market Volume (Tons) Forecast by Battery Type, 2018 to 2033

Table 41: East Asia Market Value (US$ Billion) Forecast by Application, 2018 to 2033

Table 42: East Asia Market Volume (Tons) Forecast by Application, 2018 to 2033

Table 43: Middle East and Africa Market Value (US$ Billion) Forecast by Country, 2018 to 2033

Table 44: Middle East and Africa Market Volume (Tons) Forecast by Country, 2018 to 2033

Table 45: Middle East and Africa Market Value (US$ Billion) Forecast by Battery Type, 2018 to 2033

Table 46: Middle East and Africa Market Volume (Tons) Forecast by Battery Type, 2018 to 2033

Table 47: Middle East and Africa Market Value (US$ Billion) Forecast by Application, 2018 to 2033

Table 48: Middle East and Africa Market Volume (Tons) Forecast by Application, 2018 to 2033

List of Charts

Figure 1: Global Market Value (US$ Billion) by Battery Type, 2023 to 2033

Figure 2: Global Market Value (US$ Billion) by Application, 2023 to 2033

Figure 3: Global Market Value (US$ Billion) by Region, 2023 to 2033

Figure 4: Global Market Value (US$ Billion) Analysis by Region, 2018 to 2033

Figure 5: Global Market Volume (Tons) Analysis by Region, 2018 to 2033

Figure 6: Global Market Value Share (%) and BPS Analysis by Region, 2023 to 2033

Figure 7: Global Market Y-o-Y Growth (%) Projections by Region, 2023 to 2033

Figure 8: Global Market Value (US$ Billion) Analysis by Battery Type, 2018 to 2033

Figure 9: Global Market Volume (Tons) Analysis by Battery Type, 2018 to 2033

Figure 10: Global Market Value Share (%) and BPS Analysis by Battery Type, 2023 to 2033

Figure 11: Global Market Y-o-Y Growth (%) Projections by Battery Type, 2023 to 2033

Figure 12: Global Market Value (US$ Billion) Analysis by Application, 2018 to 2033

Figure 13: Global Market Volume (Tons) Analysis by Application, 2018 to 2033

Figure 14: Global Market Value Share (%) and BPS Analysis by Application, 2023 to 2033

Figure 15: Global Market Y-o-Y Growth (%) Projections by Application, 2023 to 2033

Figure 16: Global Market Attractiveness by Battery Type, 2023 to 2033

Figure 17: Global Market Attractiveness by Application, 2023 to 2033

Figure 18: Global Market Attractiveness by Region, 2023 to 2033

Figure 19: North America Market Value (US$ Billion) by Battery Type, 2023 to 2033

Figure 20: North America Market Value (US$ Billion) by Application, 2023 to 2033

Figure 21: North America Market Value (US$ Billion) by Country, 2023 to 2033

Figure 22: North America Market Value (US$ Billion) Analysis by Country, 2018 to 2033

Figure 23: North America Market Volume (Tons) Analysis by Country, 2018 to 2033

Figure 24: North America Market Value Share (%) and BPS Analysis by Country, 2023 to 2033

Figure 25: North America Market Y-o-Y Growth (%) Projections by Country, 2023 to 2033

Figure 26: North America Market Value (US$ Billion) Analysis by Battery Type, 2018 to 2033

Figure 27: North America Market Volume (Tons) Analysis by Battery Type, 2018 to 2033

Figure 28: North America Market Value Share (%) and BPS Analysis by Battery Type, 2023 to 2033

Figure 29: North America Market Y-o-Y Growth (%) Projections by Battery Type, 2023 to 2033

Figure 30: North America Market Value (US$ Billion) Analysis by Application, 2018 to 2033

Figure 31: North America Market Volume (Tons) Analysis by Application, 2018 to 2033

Figure 32: North America Market Value Share (%) and BPS Analysis by Application, 2023 to 2033

Figure 33: North America Market Y-o-Y Growth (%) Projections by Application, 2023 to 2033

Figure 34: North America Market Attractiveness by Battery Type, 2023 to 2033

Figure 35: North America Market Attractiveness by Application, 2023 to 2033

Figure 36: North America Market Attractiveness by Country, 2023 to 2033

Figure 37: Latin America Market Value (US$ Billion) by Battery Type, 2023 to 2033

Figure 38: Latin America Market Value (US$ Billion) by Application, 2023 to 2033

Figure 39: Latin America Market Value (US$ Billion) by Country, 2023 to 2033

Figure 40: Latin America Market Value (US$ Billion) Analysis by Country, 2018 to 2033

Figure 41: Latin America Market Volume (Tons) Analysis by Country, 2018 to 2033

Figure 42: Latin America Market Value Share (%) and BPS Analysis by Country, 2023 to 2033

Figure 43: Latin America Market Y-o-Y Growth (%) Projections by Country, 2023 to 2033

Figure 44: Latin America Market Value (US$ Billion) Analysis by Battery Type, 2018 to 2033

Figure 45: Latin America Market Volume (Tons) Analysis by Battery Type, 2018 to 2033

Figure 46: Latin America Market Value Share (%) and BPS Analysis by Battery Type, 2023 to 2033

Figure 47: Latin America Market Y-o-Y Growth (%) Projections by Battery Type, 2023 to 2033

Figure 48: Latin America Market Value (US$ Billion) Analysis by Application, 2018 to 2033

Figure 49: Latin America Market Volume (Tons) Analysis by Application, 2018 to 2033

Figure 50: Latin America Market Value Share (%) and BPS Analysis by Application, 2023 to 2033

Figure 51: Latin America Market Y-o-Y Growth (%) Projections by Application, 2023 to 2033

Figure 52: Latin America Market Attractiveness by Battery Type, 2023 to 2033

Figure 53: Latin America Market Attractiveness by Application, 2023 to 2033

Figure 54: Latin America Market Attractiveness by Country, 2023 to 2033

Figure 55: Western Europe Market Value (US$ Billion) by Battery Type, 2023 to 2033

Figure 56: Western Europe Market Value (US$ Billion) by Application, 2023 to 2033

Figure 57: Western Europe Market Value (US$ Billion) by Country, 2023 to 2033

Figure 58: Western Europe Market Value (US$ Billion) Analysis by Country, 2018 to 2033

Figure 59: Western Europe Market Volume (Tons) Analysis by Country, 2018 to 2033

Figure 60: Western Europe Market Value Share (%) and BPS Analysis by Country, 2023 to 2033

Figure 61: Western Europe Market Y-o-Y Growth (%) Projections by Country, 2023 to 2033

Figure 62: Western Europe Market Value (US$ Billion) Analysis by Battery Type, 2018 to 2033

Figure 63: Western Europe Market Volume (Tons) Analysis by Battery Type, 2018 to 2033

Figure 64: Western Europe Market Value Share (%) and BPS Analysis by Battery Type, 2023 to 2033

Figure 65: Western Europe Market Y-o-Y Growth (%) Projections by Battery Type, 2023 to 2033

Figure 66: Western Europe Market Value (US$ Billion) Analysis by Application, 2018 to 2033

Figure 67: Western Europe Market Volume (Tons) Analysis by Application, 2018 to 2033

Figure 68: Western Europe Market Value Share (%) and BPS Analysis by Application, 2023 to 2033

Figure 69: Western Europe Market Y-o-Y Growth (%) Projections by Application, 2023 to 2033

Figure 70: Western Europe Market Attractiveness by Battery Type, 2023 to 2033

Figure 71: Western Europe Market Attractiveness by Application, 2023 to 2033

Figure 72: Western Europe Market Attractiveness by Country, 2023 to 2033

Figure 73: Eastern Europe Market Value (US$ Billion) by Battery Type, 2023 to 2033

Figure 74: Eastern Europe Market Value (US$ Billion) by Application, 2023 to 2033

Figure 75: Eastern Europe Market Value (US$ Billion) by Country, 2023 to 2033

Figure 76: Eastern Europe Market Value (US$ Billion) Analysis by Country, 2018 to 2033

Figure 77: Eastern Europe Market Volume (Tons) Analysis by Country, 2018 to 2033

Figure 78: Eastern Europe Market Value Share (%) and BPS Analysis by Country, 2023 to 2033

Figure 79: Eastern Europe Market Y-o-Y Growth (%) Projections by Country, 2023 to 2033

Figure 80: Eastern Europe Market Value (US$ Billion) Analysis by Battery Type, 2018 to 2033

Figure 81: Eastern Europe Market Volume (Tons) Analysis by Battery Type, 2018 to 2033

Figure 82: Eastern Europe Market Value Share (%) and BPS Analysis by Battery Type, 2023 to 2033

Figure 83: Eastern Europe Market Y-o-Y Growth (%) Projections by Battery Type, 2023 to 2033

Figure 84: Eastern Europe Market Value (US$ Billion) Analysis by Application, 2018 to 2033

Figure 85: Eastern Europe Market Volume (Tons) Analysis by Application, 2018 to 2033

Figure 86: Eastern Europe Market Value Share (%) and BPS Analysis by Application, 2023 to 2033

Figure 87: Eastern Europe Market Y-o-Y Growth (%) Projections by Application, 2023 to 2033

Figure 88: Eastern Europe Market Attractiveness by Battery Type, 2023 to 2033

Figure 89: Eastern Europe Market Attractiveness by Application, 2023 to 2033

Figure 90: Eastern Europe Market Attractiveness by Country, 2023 to 2033

Figure 91: South Asia and Pacific Market Value (US$ Billion) by Battery Type, 2023 to 2033

Figure 92: South Asia and Pacific Market Value (US$ Billion) by Application, 2023 to 2033

Figure 93: South Asia and Pacific Market Value (US$ Billion) by Country, 2023 to 2033

Figure 94: South Asia and Pacific Market Value (US$ Billion) Analysis by Country, 2018 to 2033

Figure 95: South Asia and Pacific Market Volume (Tons) Analysis by Country, 2018 to 2033

Figure 96: South Asia and Pacific Market Value Share (%) and BPS Analysis by Country, 2023 to 2033

Figure 97: South Asia and Pacific Market Y-o-Y Growth (%) Projections by Country, 2023 to 2033

Figure 98: South Asia and Pacific Market Value (US$ Billion) Analysis by Battery Type, 2018 to 2033

Figure 99: South Asia and Pacific Market Volume (Tons) Analysis by Battery Type, 2018 to 2033

Figure 100: South Asia and Pacific Market Value Share (%) and BPS Analysis by Battery Type, 2023 to 2033

Figure 101: South Asia and Pacific Market Y-o-Y Growth (%) Projections by Battery Type, 2023 to 2033

Figure 102: South Asia and Pacific Market Value (US$ Billion) Analysis by Application, 2018 to 2033

Figure 103: South Asia and Pacific Market Volume (Tons) Analysis by Application, 2018 to 2033

Figure 104: South Asia and Pacific Market Value Share (%) and BPS Analysis by Application, 2023 to 2033

Figure 105: South Asia and Pacific Market Y-o-Y Growth (%) Projections by Application, 2023 to 2033

Figure 106: South Asia and Pacific Market Attractiveness by Battery Type, 2023 to 2033

Figure 107: South Asia and Pacific Market Attractiveness by Application, 2023 to 2033

Figure 108: South Asia and Pacific Market Attractiveness by Country, 2023 to 2033

Figure 109: East Asia Market Value (US$ Billion) by Battery Type, 2023 to 2033

Figure 110: East Asia Market Value (US$ Billion) by Application, 2023 to 2033

Figure 111: East Asia Market Value (US$ Billion) by Country, 2023 to 2033

Figure 112: East Asia Market Value (US$ Billion) Analysis by Country, 2018 to 2033

Figure 113: East Asia Market Volume (Tons) Analysis by Country, 2018 to 2033

Figure 114: East Asia Market Value Share (%) and BPS Analysis by Country, 2023 to 2033

Figure 115: East Asia Market Y-o-Y Growth (%) Projections by Country, 2023 to 2033

Figure 116: East Asia Market Value (US$ Billion) Analysis by Battery Type, 2018 to 2033

Figure 117: East Asia Market Volume (Tons) Analysis by Battery Type, 2018 to 2033

Figure 118: East Asia Market Value Share (%) and BPS Analysis by Battery Type, 2023 to 2033

Figure 119: East Asia Market Y-o-Y Growth (%) Projections by Battery Type, 2023 to 2033

Figure 120: East Asia Market Value (US$ Billion) Analysis by Application, 2018 to 2033

Figure 121: East Asia Market Volume (Tons) Analysis by Application, 2018 to 2033

Figure 122: East Asia Market Value Share (%) and BPS Analysis by Application, 2023 to 2033

Figure 123: East Asia Market Y-o-Y Growth (%) Projections by Application, 2023 to 2033

Figure 124: East Asia Market Attractiveness by Battery Type, 2023 to 2033

Figure 125: East Asia Market Attractiveness by Application, 2023 to 2033

Figure 126: East Asia Market Attractiveness by Country, 2023 to 2033

Figure 127: Middle East and Africa Market Value (US$ Billion) by Battery Type, 2023 to 2033

Figure 128: Middle East and Africa Market Value (US$ Billion) by Application, 2023 to 2033

Figure 129: Middle East and Africa Market Value (US$ Billion) by Country, 2023 to 2033

Figure 130: Middle East and Africa Market Value (US$ Billion) Analysis by Country, 2018 to 2033

Figure 131: Middle East and Africa Market Volume (Tons) Analysis by Country, 2018 to 2033

Figure 132: Middle East and Africa Market Value Share (%) and BPS Analysis by Country, 2023 to 2033

Figure 133: Middle East and Africa Market Y-o-Y Growth (%) Projections by Country, 2023 to 2033

Figure 134: Middle East and Africa Market Value (US$ Billion) Analysis by Battery Type, 2018 to 2033

Figure 135: Middle East and Africa Market Volume (Tons) Analysis by Battery Type, 2018 to 2033

Figure 136: Middle East and Africa Market Value Share (%) and BPS Analysis by Battery Type, 2023 to 2033

Figure 137: Middle East and Africa Market Y-o-Y Growth (%) Projections by Battery Type, 2023 to 2033

Figure 138: Middle East and Africa Market Value (US$ Billion) Analysis by Application, 2018 to 2033

Figure 139: Middle East and Africa Market Volume (Tons) Analysis by Application, 2018 to 2033

Figure 140: Middle East and Africa Market Value Share (%) and BPS Analysis by Application, 2023 to 2033

Figure 141: Middle East and Africa Market Y-o-Y Growth (%) Projections by Application, 2023 to 2033

Figure 142: Middle East and Africa Market Attractiveness by Battery Type, 2023 to 2033

Figure 143: Middle East and Africa Market Attractiveness by Application, 2023 to 2033

Figure 144: Middle East and Africa Market Attractiveness by Country, 2023 to 2033

Recommendations

Chemicals & Materials

Lithium and Lithium Ion Battery Electrolyte Market

Published : February 2024

Chemicals & Materials

Lithium Ion Battery Separator Market

Published : October 2022

Chemicals & Materials

Flexible Batteries Market

Published : June 2022

Chemicals & Materials

Sodium Sulfur Batteries Market

Published : March 2022

Explore Chemicals & Materials Insights

View Reports