Battery Resistance Tester Market Size and Share Forecast Outlook 2025 to 2035

The Battery Resistance Tester Market is estimated to be valued at USD 65.8 million in 2025 and is projected to reach USD 119.6 million by 2035, registering a compound annual growth rate (CAGR) of 6.2% over the forecast period.
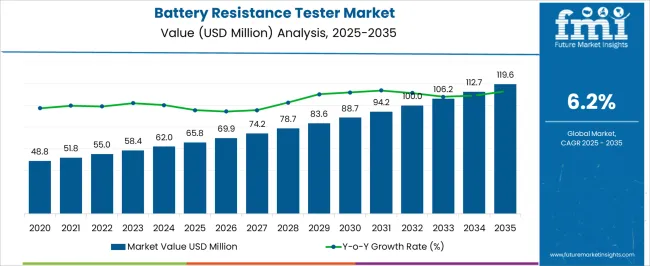
Quick Stats for Battery Resistance Tester Market

  • Battery Resistance Tester Market Value (2025): USD 65.8 million
  • Battery Resistance Tester Market Forecast Value (2035): USD 119.6 million
  • Battery Resistance Tester Market Forecast CAGR: 6.2%
  • Leading Segment in Battery Resistance Tester Market in 2025: Portable Battery Resistance Testers (55.0%)
  • Key Growth Regions in Battery Resistance Tester Market: North America, Asia-Pacific, Europe
  • Top Key Players in Battery Resistance Tester Market: Danaher, Bosch, Fortive, ACT Meters, Cadex Electronics, Maccor, West Mountain Radio, Eagle Eye Power Solutions, Transcat, Storage Battery Systems, DV Power, Hioki, Megger

Battery Resistance Tester Market Market Value Analysis

Battery Resistance Tester Market Key Takeaways

Metric Value
Battery Resistance Tester Market Estimated Value in (2025 E) USD 65.8 million
Battery Resistance Tester Market Forecast Value in (2035 F) USD 119.6 million
Forecast CAGR (2025 to 2035) 6.2%

Why is the Battery Resistance Tester Market Growing?

The Battery Resistance Tester market is being driven by the rising demand for efficient monitoring and maintenance of battery health across various industries. The current market scenario reflects a growing need to ensure performance, safety, and reliability in energy storage systems, electric vehicles, and backup power solutions. Increasing adoption of portable solutions and advanced analytics has further accelerated market expansion, as users seek cost-effective and user-friendly methods to assess battery performance without interrupting operations.

The focus on predictive maintenance and avoiding downtime is contributing to the wider acceptance of resistance testing across sectors. The market’s future outlook is expected to benefit from the surge in electric mobility, renewable energy storage systems, and the need for safe battery management in industrial settings.

Growing investments in energy infrastructure and stricter safety regulations are also influencing market growth As industries increasingly rely on battery-dependent systems, demand for accurate and real-time resistance testing tools is anticipated to rise, creating opportunities for innovation and expansion in both developed and emerging regions.

Segmental Analysis

The battery resistance tester market is segmented by product type, application, end use industry, and geographic regions. By product type, battery resistance tester market is divided into Portable Battery Resistance Testers and Stationery Battery Resistance Testers. In terms of application, battery resistance tester market is classified into Battery Resistance Testers For Standard Batteries and Battery Resistance Testers For Rechargeable Batteries. Based on end use industry, battery resistance tester market is segmented into Battery Resistance Testers For Automotive, Battery Resistance Testers For Aviation, Battery Resistance Testers For Healthcare, and Battery Resistance Testers For IT & Telecom. Regionally, the battery resistance tester industry is classified into North America, Latin America, Western Europe, Eastern Europe, Balkan & Baltic Countries, Russia & Belarus, Central Asia, East Asia, South Asia & Pacific, and the Middle East & Africa.
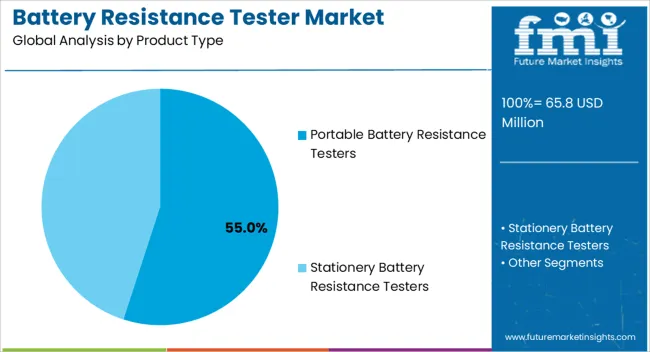
Insights into the Portable Battery Resistance Testers Segment

Battery Resistance Tester Market Analysis By Product Type

The portable battery resistance testers segment is expected to hold 55.00% of the total revenue share in the Battery Resistance Tester market in 2025. This leadership is being attributed to the rising need for flexible, on-site battery testing solutions that can be easily transported across facilities. Portable devices are being favored for their ability to deliver accurate readings without requiring large setups or additional infrastructure.

The segment’s growth has been supported by increased deployment in sectors such as automotive maintenance, energy utilities, and industrial equipment, where battery performance directly impacts operational efficiency. The adoption of portable solutions is also being driven by advancements in lightweight design, intuitive interfaces, and safety features that reduce user error and enhance testing accuracy.

The ability to conduct resistance measurements without removing the battery has further accelerated the use of portable testers As industries focus on maintaining uninterrupted power supply and optimizing battery lifespan, portable resistance testers are being seen as essential tools for proactive maintenance strategies.
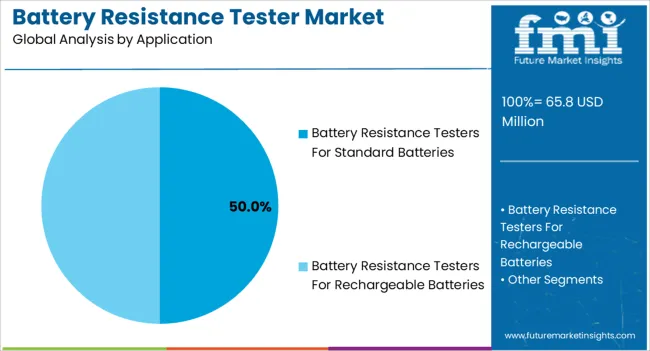
Insights into the Battery Resistance Testers for Standard Batteries Segment

Battery Resistance Tester Market Analysis By Application

The battery resistance testers for standard batteries segment is projected to account for 50.00% of the market revenue in 2025, making it a leading application area. This dominance is being attributed to the widespread use of standard batteries in consumer electronics, backup power supplies, and industrial equipment. The need to monitor the state of charge, health, and safety of such batteries has prompted greater adoption of resistance testers designed specifically for standard battery chemistries.

The growth in this segment has been supported by the increased reliance on uninterrupted power systems, where battery performance directly influences reliability. Easy-to-use resistance testers that provide rapid diagnostics without requiring technical expertise have further expanded the segment’s reach.

Moreover, the rising awareness about battery aging and the importance of maintenance protocols have encouraged businesses and individuals to invest in testing solutions As battery-powered devices continue to proliferate across both personal and professional settings, the demand for specialized testing tools tailored for standard batteries is expected to remain strong.
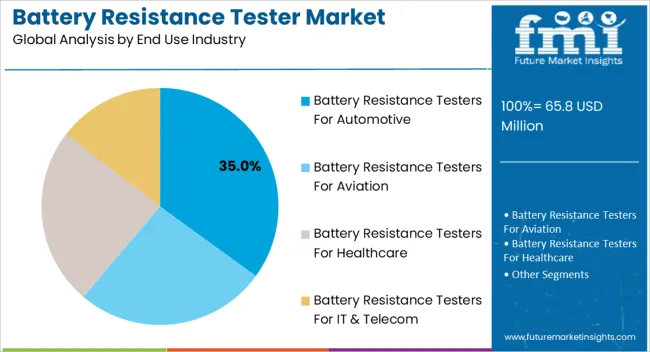
Insights into the Battery Resistance Testers for Automotive Segment

Battery Resistance Tester Market Analysis By End Use Industry

The battery resistance testers for automotive segment is forecasted to hold 35.00% of the total market revenue in 2025. This leading position is being driven by the growing number of electric and hybrid vehicles, where battery efficiency and health monitoring are critical for vehicle performance and safety. Automotive batteries are being subjected to rigorous conditions such as frequent charging cycles, extreme temperatures, and high current draws, making resistance testing an essential maintenance practice.

The segment’s growth has been supported by the increasing complexity of battery management systems and the need for accurate diagnostics to prevent battery failures and optimize energy use. Vehicle manufacturers and service centers are being encouraged to adopt resistance testers that offer quick, reliable readings with minimal downtime.

The shift toward electrification and stringent safety regulations has further prompted stakeholders to invest in automotive-specific resistance testing solutions With the automotive industry’s continued focus on performance optimization and lifecycle management, resistance testers tailored for automotive batteries are being positioned as indispensable tools for maintenance and quality assurance.

Market Overview

Battery Resistance Tester Market Overview

Battery resistance testers, multipurpose voltage testers, and resistance testers are all on the rise. Quickly stores and records omic values, temperature, and voltage of strings, cells, and inter-cell connectors, battery resistance testers, a new method gaining traction as user-friendly software becomes more prevalent. Manufacturers are working hard to achieve innovation that is in line with the interests of their customers.

As a result, players in the battery resistance tester market conduct experiments with new features. The battery resistance tester instantly recalls and retests readings on-site for data comparison and trending. This is propelling the battery resistance tester market forward. The battery resistance tester market is expected to grow at a single-digit CAGR owing to these factors.

The global battery resistance tester market has grown significantly as a result of increased demand in the electronics and instrumentation industries, which is expected to boost battery resistance tester manufacturing and sales. The battery resistance tester market has benefited from government support for a holistic approach to instruments.
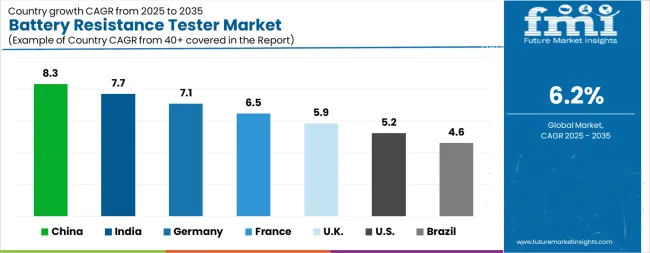
Analysis of Battery Resistance Tester Market By Key Countries

Battery Resistance Tester Market Cagr Analysis By Country

Country CAGR
China 8.3%
India 7.7%
Germany 7.1%
France 6.5%
UK 5.9%
USA 5.2%
Brazil 4.6%

Country-wise Analysis

The Battery Resistance Tester Market is expected to register a CAGR of 6.2% during the forecast period, exhibiting varied country level momentum. China leads with the highest CAGR of 8.3%, followed by India at 7.7%. Developed markets such as Germany, France, and the UK continue to expand steadily, while the USA is likely to grow at consistent rates. Brazil posts the lowest CAGR at 4.6%, yet still underscores a broadly positive trajectory for the global Battery Resistance Tester Market. In 2024, Germany held a dominant revenue in the Western Europe market and is expected to grow with a CAGR of 7.1%. The USA Battery Resistance Tester Market is estimated to be valued at USD 24.6 million in 2025 and is anticipated to reach a valuation of USD 41.1 million by 2035. Sales are projected to rise at a CAGR of 5.2% over the forecast period between 2025 and 2035. While Japan and South Korea markets are estimated to be valued at USD 3.0 million and USD 2.0 million respectively in 2025.
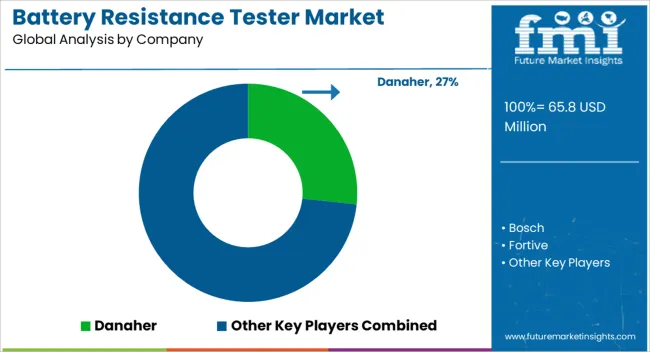
Key Players in the Battery Resistance Tester Market

Battery Resistance Tester Market Analysis By Company

  • Danaher
  • Bosch
  • Fortive
  • ACT Meters
  • Cadex Electronics
  • Maccor
  • West Mountain Radio
  • Eagle Eye Power Solutions
  • Transcat
  • Storage Battery Systems
  • DV Power
  • Hioki
  • Megger

Scope of the Report

Item Value
Quantitative Units USD 65.8 Million
Product Type Portable Battery Resistance Testers and Stationery Battery Resistance Testers
Application Battery Resistance Testers For Standard Batteries and Battery Resistance Testers For Rechargeable Batteries
End Use Industry Battery Resistance Testers For Automotive, Battery Resistance Testers For Aviation, Battery Resistance Testers For Healthcare, and Battery Resistance Testers For IT & Telecom
Regions Covered North America, Europe, Asia-Pacific, Latin America, Middle East & Africa
Country Covered United States, Canada, Germany, France, United Kingdom, China, Japan, India, Brazil, South Africa
Key Companies Profiled Danaher, Bosch, Fortive, ACT Meters, Cadex Electronics, Maccor, West Mountain Radio, Eagle Eye Power Solutions, Transcat, Storage Battery Systems, DV Power, Hioki, and Megger

Battery Resistance Tester Market by Segments

Product Type:

  • Portable Battery Resistance Testers
  • Stationery Battery Resistance Testers

Application:

  • Battery Resistance Testers For Standard Batteries
  • Battery Resistance Testers For Rechargeable Batteries

End Use Industry:

  • Battery Resistance Testers For Automotive
  • Battery Resistance Testers For Aviation
  • Battery Resistance Testers For Healthcare
  • Battery Resistance Testers For IT & Telecom

Region:

  • North America
    • USA
    • Canada
    • Mexico
  • Latin America
    • Brazil
    • Chile
    • Rest of Latin America
  • Western Europe
    • Germany
    • UK
    • Italy
    • Spain
    • France
    • Nordic
    • BENELUX
    • Rest of Western Europe
  • Eastern Europe
    • Russia
    • Poland
    • Hungary
    • Balkan & Baltic
    • Rest of Eastern Europe
  • East Asia
    • China
    • Japan
    • South Korea
  • South Asia and Pacific
    • India
    • ASEAN
    • Australia & New Zealand
    • Rest of South Asia and Pacific
  • Middle East & Africa
    • Kingdom of Saudi Arabia
    • Other GCC Countries
    • Turkiye
    • South Africa
    • Other African Union
    • Rest of Middle East & Africa

Table of Content

  1. Executive Summary
    • Global Market Outlook
    • Demand-side Trends
    • Supply-side Trends
    • Technology Roadmap Analysis
    • Analysis and Recommendations
  2. Market Overview
    • Market Coverage / Taxonomy
    • Market Definition / Scope / Limitations
  3. Market Background
    • Market Dynamics
      • Drivers
      • Restraints
      • Opportunity
      • Trends
    • Scenario Forecast
      • Demand in Optimistic Scenario
      • Demand in Likely Scenario
      • Demand in Conservative Scenario
    • Opportunity Map Analysis
    • Product Life Cycle Analysis
    • Supply Chain Analysis
    • Investment Feasibility Matrix
    • Value Chain Analysis
    • PESTLE and Porter’s Analysis
    • Regulatory Landscape
    • Regional Parent Market Outlook
    • Production and Consumption Statistics
    • Import and Export Statistics
  4. Global Market Analysis 2020 to 2024 and Forecast, 2025 to 2035
    • Historical Market Size Value (USD Million) Analysis, 2020 to 2024
    • Current and Future Market Size Value (USD Million) Projections, 2025 to 2035
      • Y-o-Y Growth Trend Analysis
      • Absolute $ Opportunity Analysis
  5. Global Market Pricing Analysis 2020 to 2024 and Forecast 2025 to 2035
  6. Global Market Analysis 2020 to 2024 and Forecast 2025 to 2035, By Product Type
    • Introduction / Key Findings
    • Historical Market Size Value (USD Million) Analysis By Product Type , 2020 to 2024
    • Current and Future Market Size Value (USD Million) Analysis and Forecast By Product Type , 2025 to 2035
      • Portable Battery Resistance Testers
      • Stationery Battery Resistance Testers
    • Y-o-Y Growth Trend Analysis By Product Type , 2020 to 2024
    • Absolute $ Opportunity Analysis By Product Type , 2025 to 2035
  7. Global Market Analysis 2020 to 2024 and Forecast 2025 to 2035, By Application
    • Introduction / Key Findings
    • Historical Market Size Value (USD Million) Analysis By Application, 2020 to 2024
    • Current and Future Market Size Value (USD Million) Analysis and Forecast By Application, 2025 to 2035
      • Battery Resistance Testers For Standard Batteries
      • Battery Resistance Testers For Rechargeable Batteries
    • Y-o-Y Growth Trend Analysis By Application, 2020 to 2024
    • Absolute $ Opportunity Analysis By Application, 2025 to 2035
  8. Global Market Analysis 2020 to 2024 and Forecast 2025 to 2035, By End Use Industry
    • Introduction / Key Findings
    • Historical Market Size Value (USD Million) Analysis By End Use Industry, 2020 to 2024
    • Current and Future Market Size Value (USD Million) Analysis and Forecast By End Use Industry, 2025 to 2035
      • Battery Resistance Testers For Automotive
      • Battery Resistance Testers For Aviation
      • Battery Resistance Testers For Healthcare
      • Battery Resistance Testers For IT & Telecom
    • Y-o-Y Growth Trend Analysis By End Use Industry, 2020 to 2024
    • Absolute $ Opportunity Analysis By End Use Industry, 2025 to 2035
  9. Global Market Analysis 2020 to 2024 and Forecast 2025 to 2035, By Region
    • Introduction
    • Historical Market Size Value (USD Million) Analysis By Region, 2020 to 2024
    • Current Market Size Value (USD Million) Analysis and Forecast By Region, 2025 to 2035
      • North America
      • Latin America
      • Western Europe
      • Eastern Europe
      • East Asia
      • South Asia and Pacific
      • Middle East & Africa
    • Market Attractiveness Analysis By Region
  10. North America Market Analysis 2020 to 2024 and Forecast 2025 to 2035, By Country
    • Historical Market Size Value (USD Million) Trend Analysis By Market Taxonomy, 2020 to 2024
    • Market Size Value (USD Million) Forecast By Market Taxonomy, 2025 to 2035
      • By Country
        • USA
        • Canada
        • Mexico
      • By Product Type
      • By Application
      • By End Use Industry
    • Market Attractiveness Analysis
      • By Country
      • By Product Type
      • By Application
      • By End Use Industry
    • Key Takeaways
  11. Latin America Market Analysis 2020 to 2024 and Forecast 2025 to 2035, By Country
    • Historical Market Size Value (USD Million) Trend Analysis By Market Taxonomy, 2020 to 2024
    • Market Size Value (USD Million) Forecast By Market Taxonomy, 2025 to 2035
      • By Country
        • Brazil
        • Chile
        • Rest of Latin America
      • By Product Type
      • By Application
      • By End Use Industry
    • Market Attractiveness Analysis
      • By Country
      • By Product Type
      • By Application
      • By End Use Industry
    • Key Takeaways
  12. Western Europe Market Analysis 2020 to 2024 and Forecast 2025 to 2035, By Country
    • Historical Market Size Value (USD Million) Trend Analysis By Market Taxonomy, 2020 to 2024
    • Market Size Value (USD Million) Forecast By Market Taxonomy, 2025 to 2035
      • By Country
        • Germany
        • UK
        • Italy
        • Spain
        • France
        • Nordic
        • BENELUX
        • Rest of Western Europe
      • By Product Type
      • By Application
      • By End Use Industry
    • Market Attractiveness Analysis
      • By Country
      • By Product Type
      • By Application
      • By End Use Industry
    • Key Takeaways
  13. Eastern Europe Market Analysis 2020 to 2024 and Forecast 2025 to 2035, By Country
    • Historical Market Size Value (USD Million) Trend Analysis By Market Taxonomy, 2020 to 2024
    • Market Size Value (USD Million) Forecast By Market Taxonomy, 2025 to 2035
      • By Country
        • Russia
        • Poland
        • Hungary
        • Balkan & Baltic
        • Rest of Eastern Europe
      • By Product Type
      • By Application
      • By End Use Industry
    • Market Attractiveness Analysis
      • By Country
      • By Product Type
      • By Application
      • By End Use Industry
    • Key Takeaways
  14. East Asia Market Analysis 2020 to 2024 and Forecast 2025 to 2035, By Country
    • Historical Market Size Value (USD Million) Trend Analysis By Market Taxonomy, 2020 to 2024
    • Market Size Value (USD Million) Forecast By Market Taxonomy, 2025 to 2035
      • By Country
        • China
        • Japan
        • South Korea
      • By Product Type
      • By Application
      • By End Use Industry
    • Market Attractiveness Analysis
      • By Country
      • By Product Type
      • By Application
      • By End Use Industry
    • Key Takeaways
  15. South Asia and Pacific Market Analysis 2020 to 2024 and Forecast 2025 to 2035, By Country
    • Historical Market Size Value (USD Million) Trend Analysis By Market Taxonomy, 2020 to 2024
    • Market Size Value (USD Million) Forecast By Market Taxonomy, 2025 to 2035
      • By Country
        • India
        • ASEAN
        • Australia & New Zealand
        • Rest of South Asia and Pacific
      • By Product Type
      • By Application
      • By End Use Industry
    • Market Attractiveness Analysis
      • By Country
      • By Product Type
      • By Application
      • By End Use Industry
    • Key Takeaways
  16. Middle East & Africa Market Analysis 2020 to 2024 and Forecast 2025 to 2035, By Country
    • Historical Market Size Value (USD Million) Trend Analysis By Market Taxonomy, 2020 to 2024
    • Market Size Value (USD Million) Forecast By Market Taxonomy, 2025 to 2035
      • By Country
        • Kingdom of Saudi Arabia
        • Other GCC Countries
        • Turkiye
        • South Africa
        • Other African Union
        • Rest of Middle East & Africa
      • By Product Type
      • By Application
      • By End Use Industry
    • Market Attractiveness Analysis
      • By Country
      • By Product Type
      • By Application
      • By End Use Industry
    • Key Takeaways
  17. Key Countries Market Analysis
    • USA
      • Pricing Analysis
      • Market Share Analysis, 2024
        • By Product Type
        • By Application
        • By End Use Industry
    • Canada
      • Pricing Analysis
      • Market Share Analysis, 2024
        • By Product Type
        • By Application
        • By End Use Industry
    • Mexico
      • Pricing Analysis
      • Market Share Analysis, 2024
        • By Product Type
        • By Application
        • By End Use Industry
    • Brazil
      • Pricing Analysis
      • Market Share Analysis, 2024
        • By Product Type
        • By Application
        • By End Use Industry
    • Chile
      • Pricing Analysis
      • Market Share Analysis, 2024
        • By Product Type
        • By Application
        • By End Use Industry
    • Germany
      • Pricing Analysis
      • Market Share Analysis, 2024
        • By Product Type
        • By Application
        • By End Use Industry
    • UK
      • Pricing Analysis
      • Market Share Analysis, 2024
        • By Product Type
        • By Application
        • By End Use Industry
    • Italy
      • Pricing Analysis
      • Market Share Analysis, 2024
        • By Product Type
        • By Application
        • By End Use Industry
    • Spain
      • Pricing Analysis
      • Market Share Analysis, 2024
        • By Product Type
        • By Application
        • By End Use Industry
    • France
      • Pricing Analysis
      • Market Share Analysis, 2024
        • By Product Type
        • By Application
        • By End Use Industry
    • India
      • Pricing Analysis
      • Market Share Analysis, 2024
        • By Product Type
        • By Application
        • By End Use Industry
    • ASEAN
      • Pricing Analysis
      • Market Share Analysis, 2024
        • By Product Type
        • By Application
        • By End Use Industry
    • Australia & New Zealand
      • Pricing Analysis
      • Market Share Analysis, 2024
        • By Product Type
        • By Application
        • By End Use Industry
    • China
      • Pricing Analysis
      • Market Share Analysis, 2024
        • By Product Type
        • By Application
        • By End Use Industry
    • Japan
      • Pricing Analysis
      • Market Share Analysis, 2024
        • By Product Type
        • By Application
        • By End Use Industry
    • South Korea
      • Pricing Analysis
      • Market Share Analysis, 2024
        • By Product Type
        • By Application
        • By End Use Industry
    • Russia
      • Pricing Analysis
      • Market Share Analysis, 2024
        • By Product Type
        • By Application
        • By End Use Industry
    • Poland
      • Pricing Analysis
      • Market Share Analysis, 2024
        • By Product Type
        • By Application
        • By End Use Industry
    • Hungary
      • Pricing Analysis
      • Market Share Analysis, 2024
        • By Product Type
        • By Application
        • By End Use Industry
    • Kingdom of Saudi Arabia
      • Pricing Analysis
      • Market Share Analysis, 2024
        • By Product Type
        • By Application
        • By End Use Industry
    • Turkiye
      • Pricing Analysis
      • Market Share Analysis, 2024
        • By Product Type
        • By Application
        • By End Use Industry
    • South Africa
      • Pricing Analysis
      • Market Share Analysis, 2024
        • By Product Type
        • By Application
        • By End Use Industry
  18. Market Structure Analysis
    • Competition Dashboard
    • Competition Benchmarking
    • Market Share Analysis of Top Players
      • By Regional
      • By Product Type
      • By Application
      • By End Use Industry
  19. Competition Analysis
    • Competition Deep Dive
      • Danaher
        • Overview
        • Product Portfolio
        • Profitability by Market Segments (Product/Age /Sales Channel/Region)
        • Sales Footprint
        • Strategy Overview
          • Marketing Strategy
          • Product Strategy
          • Channel Strategy
      • Bosch
      • Fortive
      • ACT Meters
      • Cadex Electronics
      • Maccor
      • West Mountain Radio
      • Eagle Eye Power Solutions
      • Transcat
      • Storage Battery Systems
      • DV Power
      • Hioki
      • Megger
  20. Assumptions & Acronyms Used
  21. Research Methodology

List of Tables

  • Table 1: Global Market Value (USD Million) Forecast by Region, 2020 to 2035
  • Table 2: Global Market Value (USD Million) Forecast by Product Type , 2020 to 2035
  • Table 3: Global Market Value (USD Million) Forecast by Application, 2020 to 2035
  • Table 4: Global Market Value (USD Million) Forecast by End Use Industry, 2020 to 2035
  • Table 5: North America Market Value (USD Million) Forecast by Country, 2020 to 2035
  • Table 6: North America Market Value (USD Million) Forecast by Product Type , 2020 to 2035
  • Table 7: North America Market Value (USD Million) Forecast by Application, 2020 to 2035
  • Table 8: North America Market Value (USD Million) Forecast by End Use Industry, 2020 to 2035
  • Table 9: Latin America Market Value (USD Million) Forecast by Country, 2020 to 2035
  • Table 10: Latin America Market Value (USD Million) Forecast by Product Type , 2020 to 2035
  • Table 11: Latin America Market Value (USD Million) Forecast by Application, 2020 to 2035
  • Table 12: Latin America Market Value (USD Million) Forecast by End Use Industry, 2020 to 2035
  • Table 13: Western Europe Market Value (USD Million) Forecast by Country, 2020 to 2035
  • Table 14: Western Europe Market Value (USD Million) Forecast by Product Type , 2020 to 2035
  • Table 15: Western Europe Market Value (USD Million) Forecast by Application, 2020 to 2035
  • Table 16: Western Europe Market Value (USD Million) Forecast by End Use Industry, 2020 to 2035
  • Table 17: Eastern Europe Market Value (USD Million) Forecast by Country, 2020 to 2035
  • Table 18: Eastern Europe Market Value (USD Million) Forecast by Product Type , 2020 to 2035
  • Table 19: Eastern Europe Market Value (USD Million) Forecast by Application, 2020 to 2035
  • Table 20: Eastern Europe Market Value (USD Million) Forecast by End Use Industry, 2020 to 2035
  • Table 21: East Asia Market Value (USD Million) Forecast by Country, 2020 to 2035
  • Table 22: East Asia Market Value (USD Million) Forecast by Product Type , 2020 to 2035
  • Table 23: East Asia Market Value (USD Million) Forecast by Application, 2020 to 2035
  • Table 24: East Asia Market Value (USD Million) Forecast by End Use Industry, 2020 to 2035
  • Table 25: South Asia and Pacific Market Value (USD Million) Forecast by Country, 2020 to 2035
  • Table 26: South Asia and Pacific Market Value (USD Million) Forecast by Product Type , 2020 to 2035
  • Table 27: South Asia and Pacific Market Value (USD Million) Forecast by Application, 2020 to 2035
  • Table 28: South Asia and Pacific Market Value (USD Million) Forecast by End Use Industry, 2020 to 2035
  • Table 29: Middle East & Africa Market Value (USD Million) Forecast by Country, 2020 to 2035
  • Table 30: Middle East & Africa Market Value (USD Million) Forecast by Product Type , 2020 to 2035
  • Table 31: Middle East & Africa Market Value (USD Million) Forecast by Application, 2020 to 2035
  • Table 32: Middle East & Africa Market Value (USD Million) Forecast by End Use Industry, 2020 to 2035

List of Figures

  • Figure 1: Global Market Pricing Analysis
  • Figure 2: Global Market Value (USD Million) Forecast 2020 to 2035
  • Figure 3: Global Market Value Share and BPS Analysis by Product Type , 2025 and 2035
  • Figure 4: Global Market Y-o-Y Growth Comparison by Product Type , 2025 to 2035
  • Figure 5: Global Market Attractiveness Analysis by Product Type
  • Figure 6: Global Market Value Share and BPS Analysis by Application, 2025 and 2035
  • Figure 7: Global Market Y-o-Y Growth Comparison by Application, 2025 to 2035
  • Figure 8: Global Market Attractiveness Analysis by Application
  • Figure 9: Global Market Value Share and BPS Analysis by End Use Industry, 2025 and 2035
  • Figure 10: Global Market Y-o-Y Growth Comparison by End Use Industry, 2025 to 2035
  • Figure 11: Global Market Attractiveness Analysis by End Use Industry
  • Figure 12: Global Market Value (USD Million) Share and BPS Analysis by Region, 2025 and 2035
  • Figure 13: Global Market Y-o-Y Growth Comparison by Region, 2025 to 2035
  • Figure 14: Global Market Attractiveness Analysis by Region
  • Figure 15: North America Market Incremental Dollar Opportunity, 2025 to 2035
  • Figure 16: Latin America Market Incremental Dollar Opportunity, 2025 to 2035
  • Figure 17: Western Europe Market Incremental Dollar Opportunity, 2025 to 2035
  • Figure 18: Eastern Europe Market Incremental Dollar Opportunity, 2025 to 2035
  • Figure 19: East Asia Market Incremental Dollar Opportunity, 2025 to 2035
  • Figure 20: South Asia and Pacific Market Incremental Dollar Opportunity, 2025 to 2035
  • Figure 21: Middle East & Africa Market Incremental Dollar Opportunity, 2025 to 2035
  • Figure 22: North America Market Value Share and BPS Analysis by Country, 2025 and 2035
  • Figure 23: North America Market Value Share and BPS Analysis by Product Type , 2025 and 2035
  • Figure 24: North America Market Y-o-Y Growth Comparison by Product Type , 2025 to 2035
  • Figure 25: North America Market Attractiveness Analysis by Product Type
  • Figure 26: North America Market Value Share and BPS Analysis by Application, 2025 and 2035
  • Figure 27: North America Market Y-o-Y Growth Comparison by Application, 2025 to 2035
  • Figure 28: North America Market Attractiveness Analysis by Application
  • Figure 29: North America Market Value Share and BPS Analysis by End Use Industry, 2025 and 2035
  • Figure 30: North America Market Y-o-Y Growth Comparison by End Use Industry, 2025 to 2035
  • Figure 31: North America Market Attractiveness Analysis by End Use Industry
  • Figure 32: Latin America Market Value Share and BPS Analysis by Country, 2025 and 2035
  • Figure 33: Latin America Market Value Share and BPS Analysis by Product Type , 2025 and 2035
  • Figure 34: Latin America Market Y-o-Y Growth Comparison by Product Type , 2025 to 2035
  • Figure 35: Latin America Market Attractiveness Analysis by Product Type
  • Figure 36: Latin America Market Value Share and BPS Analysis by Application, 2025 and 2035
  • Figure 37: Latin America Market Y-o-Y Growth Comparison by Application, 2025 to 2035
  • Figure 38: Latin America Market Attractiveness Analysis by Application
  • Figure 39: Latin America Market Value Share and BPS Analysis by End Use Industry, 2025 and 2035
  • Figure 40: Latin America Market Y-o-Y Growth Comparison by End Use Industry, 2025 to 2035
  • Figure 41: Latin America Market Attractiveness Analysis by End Use Industry
  • Figure 42: Western Europe Market Value Share and BPS Analysis by Country, 2025 and 2035
  • Figure 43: Western Europe Market Value Share and BPS Analysis by Product Type , 2025 and 2035
  • Figure 44: Western Europe Market Y-o-Y Growth Comparison by Product Type , 2025 to 2035
  • Figure 45: Western Europe Market Attractiveness Analysis by Product Type
  • Figure 46: Western Europe Market Value Share and BPS Analysis by Application, 2025 and 2035
  • Figure 47: Western Europe Market Y-o-Y Growth Comparison by Application, 2025 to 2035
  • Figure 48: Western Europe Market Attractiveness Analysis by Application
  • Figure 49: Western Europe Market Value Share and BPS Analysis by End Use Industry, 2025 and 2035
  • Figure 50: Western Europe Market Y-o-Y Growth Comparison by End Use Industry, 2025 to 2035
  • Figure 51: Western Europe Market Attractiveness Analysis by End Use Industry
  • Figure 52: Eastern Europe Market Value Share and BPS Analysis by Country, 2025 and 2035
  • Figure 53: Eastern Europe Market Value Share and BPS Analysis by Product Type , 2025 and 2035
  • Figure 54: Eastern Europe Market Y-o-Y Growth Comparison by Product Type , 2025 to 2035
  • Figure 55: Eastern Europe Market Attractiveness Analysis by Product Type
  • Figure 56: Eastern Europe Market Value Share and BPS Analysis by Application, 2025 and 2035
  • Figure 57: Eastern Europe Market Y-o-Y Growth Comparison by Application, 2025 to 2035
  • Figure 58: Eastern Europe Market Attractiveness Analysis by Application
  • Figure 59: Eastern Europe Market Value Share and BPS Analysis by End Use Industry, 2025 and 2035
  • Figure 60: Eastern Europe Market Y-o-Y Growth Comparison by End Use Industry, 2025 to 2035
  • Figure 61: Eastern Europe Market Attractiveness Analysis by End Use Industry
  • Figure 62: East Asia Market Value Share and BPS Analysis by Country, 2025 and 2035
  • Figure 63: East Asia Market Value Share and BPS Analysis by Product Type , 2025 and 2035
  • Figure 64: East Asia Market Y-o-Y Growth Comparison by Product Type , 2025 to 2035
  • Figure 65: East Asia Market Attractiveness Analysis by Product Type
  • Figure 66: East Asia Market Value Share and BPS Analysis by Application, 2025 and 2035
  • Figure 67: East Asia Market Y-o-Y Growth Comparison by Application, 2025 to 2035
  • Figure 68: East Asia Market Attractiveness Analysis by Application
  • Figure 69: East Asia Market Value Share and BPS Analysis by End Use Industry, 2025 and 2035
  • Figure 70: East Asia Market Y-o-Y Growth Comparison by End Use Industry, 2025 to 2035
  • Figure 71: East Asia Market Attractiveness Analysis by End Use Industry
  • Figure 72: South Asia and Pacific Market Value Share and BPS Analysis by Country, 2025 and 2035
  • Figure 73: South Asia and Pacific Market Value Share and BPS Analysis by Product Type , 2025 and 2035
  • Figure 74: South Asia and Pacific Market Y-o-Y Growth Comparison by Product Type , 2025 to 2035
  • Figure 75: South Asia and Pacific Market Attractiveness Analysis by Product Type
  • Figure 76: South Asia and Pacific Market Value Share and BPS Analysis by Application, 2025 and 2035
  • Figure 77: South Asia and Pacific Market Y-o-Y Growth Comparison by Application, 2025 to 2035
  • Figure 78: South Asia and Pacific Market Attractiveness Analysis by Application
  • Figure 79: South Asia and Pacific Market Value Share and BPS Analysis by End Use Industry, 2025 and 2035
  • Figure 80: South Asia and Pacific Market Y-o-Y Growth Comparison by End Use Industry, 2025 to 2035
  • Figure 81: South Asia and Pacific Market Attractiveness Analysis by End Use Industry
  • Figure 82: Middle East & Africa Market Value Share and BPS Analysis by Country, 2025 and 2035
  • Figure 83: Middle East & Africa Market Value Share and BPS Analysis by Product Type , 2025 and 2035
  • Figure 84: Middle East & Africa Market Y-o-Y Growth Comparison by Product Type , 2025 to 2035
  • Figure 85: Middle East & Africa Market Attractiveness Analysis by Product Type
  • Figure 86: Middle East & Africa Market Value Share and BPS Analysis by Application, 2025 and 2035
  • Figure 87: Middle East & Africa Market Y-o-Y Growth Comparison by Application, 2025 to 2035
  • Figure 88: Middle East & Africa Market Attractiveness Analysis by Application
  • Figure 89: Middle East & Africa Market Value Share and BPS Analysis by End Use Industry, 2025 and 2035
  • Figure 90: Middle East & Africa Market Y-o-Y Growth Comparison by End Use Industry, 2025 to 2035
  • Figure 91: Middle East & Africa Market Attractiveness Analysis by End Use Industry
  • Figure 92: Global Market – Tier Structure Analysis
  • Figure 93: Global Market – Company Share Analysis

Frequently Asked Questions

How big is the battery resistance tester market in 2025?

The global battery resistance tester market is estimated to be valued at USD 65.8 million in 2025.

What will be the size of battery resistance tester market in 2035?

The market size for the battery resistance tester market is projected to reach USD 119.6 million by 2035.

How much will be the battery resistance tester market growth between 2025 and 2035?

The battery resistance tester market is expected to grow at a 6.2% CAGR between 2025 and 2035.

What are the key product types in the battery resistance tester market?

The key product types in battery resistance tester market are portable battery resistance testers and stationery battery resistance testers.

Which application segment to contribute significant share in the battery resistance tester market in 2025?

In terms of application, battery resistance testers for standard batteries segment to command 50.0% share in the battery resistance tester market in 2025.

Explore Similar Insights

Future Market Insights

Battery Resistance Tester Market

Chat With MaRIA

Chat With

MaRIA

Hi There, I am MaRIA, Your Market Research Intelligence Assistant. How may I help you?