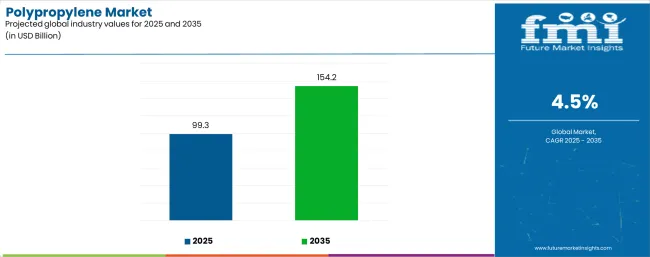
The global polypropylene market is forecasted to reach USD 154.2 billion by 2035, recording an absolute increase of USD 54.9 billion over the forecast period. The market is valued at USD 99.3 billion in 2025 and is set to rise at a CAGR of 4.5% during the assessment period. The overall market size is expected to grow by nearly 1.6 times during the same period, supported by increasing demand for lightweight and versatile polymer solutions worldwide, driving demand for efficient packaging materials and automotive light weighting applications and increasing investments in petrochemical capacity expansion, circular economy initiatives, and advanced conversion technologies globally. The volatile propylene feedstock prices and environmental concerns regarding plastic waste may pose challenges to market expansion.
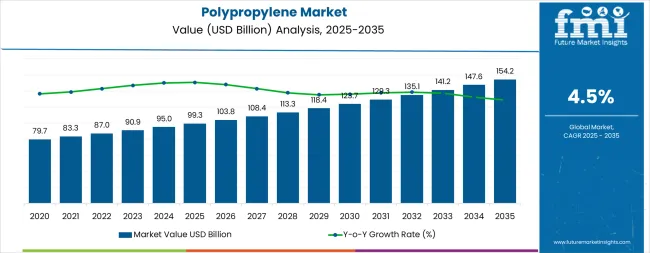
Between 2025 and 2030, the market is projected to expand from USD 99.3 billion to USD 123.8 billion, resulting in a value increase of USD 24.5 billion, which represents 44.6% of the total forecast growth for the decade. This phase of development will be shaped by rising demand for flexible and rigid packaging solutions, product innovation in circular and recycled PP grades, as well as expanding integration with automotive light weighting programs and e-commerce packaging requirements. Companies are establishing competitive positions through investment in advanced propylene dehydrogenation units, chemical recycling infrastructure, and strategic market expansion across packaging, automotive, and healthcare applications.
From 2030 to 2035, the market is forecast to grow from USD 123.8 billion to USD 154.2 billion, adding another USD 30.4 billion, which constitutes 55.4% of the overall ten-year expansion. This period is expected to be characterized by the expansion of specialized polypropylene systems, including advanced high-melt-strength grades and integrated circular PP solutions tailored for specific industry requirements, strategic collaborations between petrochemical producers and brand-owner companies, and an enhanced focus on mechanical and chemical recycling infrastructure development. The growing focus on sustainability credentials and regulatory compliance will drive demand for advanced, high-performance polypropylene solutions across diverse industrial applications.
| Metric | Value |
|---|---|
| Market Value (2025) | USD 99.3 billion |
| Market Forecast Value (2035) | USD 154.2 billion |
| Forecast CAGR (2025-2035) | 4.5% |
The market grows by enabling manufacturers to achieve optimal balance between cost-effectiveness, mechanical properties, and processing versatility across diverse applications ranging from flexible packaging films to automotive interior components. Industrial manufacturers face mounting pressure to reduce material costs while improving product performance, with polypropylene offering exceptional stiffness-to-weight ratios, chemical resistance, and recyclability that make it essential for cost-competitive manufacturing operations across packaging, automotive, and consumer goods sectors. The packaging industry's transition toward lightweight, recyclable materials creates steady demand for PP films, containers, and closures that reduce material consumption while maintaining product protection and shelf appeal.
Automotive industry light weighting initiatives accelerate adoption of polypropylene in interior trim, bumpers, and under-hood components, where material substitution delivers 10-20% weight savings compared to conventional materials while meeting stringent safety and durability requirements. Government initiatives promoting circular economy principles and extended producer responsibility drive investments in polypropylene recycling infrastructure and certified recycled content grades meeting food-contact and healthcare applications. The volatile propylene feedstock pricing tied to crude oil and natural gas markets creates margin pressure for producers and converters, while growing regulatory scrutiny of single-use plastics and marine litter concerns may limit adoption rates in specific packaging applications and geographic regions implementing plastic reduction mandates.
The market is segmented by product type, end-user, processing/conversion method, and region. By product type, the market is divided into homo-polymer (HP), random co-polymer (RCP), impact co-polymer (ICP), and thermoplastic polyolefin (TPO). Based on end-user, the market is categorized into packaging, automotive, building & construction, healthcare, electrical equipment & appliances, textiles, and consumer durables & others. By processing/conversion method, the market is segmented into injection molding, film & sheet (including BOPP), pipe & profile extrusion, fiber/nonwovens, and blow molding. Regionally, the market is divided into Asia Pacific, Europe, North America, Latin America, and Middle East & Africa.
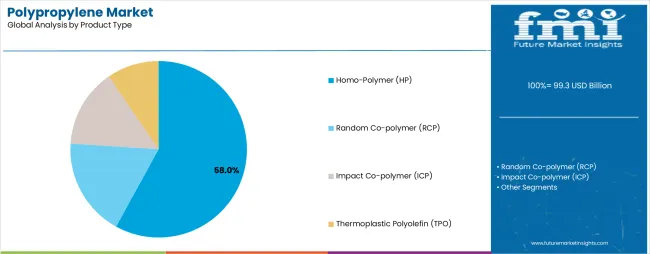
The homo-polymer segment represents the dominant force in the market, capturing approximately 58.0% of total market share in 2025. This foundational product category encompasses polypropylene homopolymers featuring only propylene monomers in the polymer chain, delivering exceptional stiffness, tensile strength, and heat resistance characteristics that enable superior performance in rigid packaging, fibers, and injection-molded components. The homo-polymer segment's market leadership stems from its optimal balance of mechanical properties and cost-effectiveness, with HP grades serving as the workhorse material across woven bags, raffia tapes, injection-molded containers, and high-tenacity fibers requiring maximum strength and rigidity.
The random co-polymer segment maintains a substantial 18.0% market share, driven by applications requiring enhanced clarity, lower heat-seal temperatures, and improved impact resistance at low temperatures compared to homopolymers. Impact co-polymer captures 16.0% share through automotive applications, appliance components, and packaging requiring superior impact strength and toughness. Thermoplastic polyolefin accounts for 8.0% share in automotive soft-touch interiors and elastomeric applications requiring rubber-like properties.
Key technological advantages driving the homo-polymer segment include:
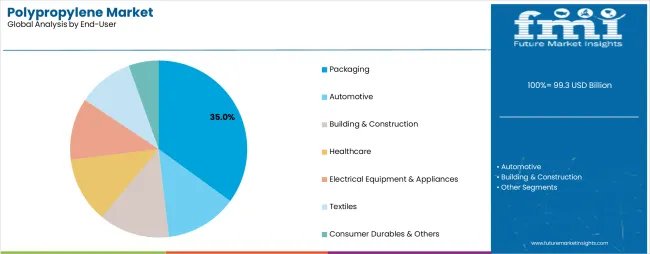
Packaging applications dominate the market with approximately 35.0% market share in 2025, reflecting the critical role of PP in flexible films, rigid containers, closures, and intermediate bulk containers supporting global consumer goods and industrial supply chains. The packaging segment's market leadership is reinforced by e-commerce growth driving corrugated box liner demand, food safety requirements favoring virgin and recycled PP grades, and green initiatives promoting recyclable monomaterial packaging structures. Polypropylene's exceptional moisture barrier properties, chemical resistance, and heat-seal characteristics make it indispensable for food packaging, pharmaceutical blister packs, and personal care product containers.
The automotive segment represents the second-largest end-user category, capturing 21.0% market share through interior trim components, bumper fascias, battery cases for electric vehicles, and under-hood applications. This segment benefits from ongoing vehicle lightweighting requirements and material consolidation strategies reducing part complexity and assembly costs while improving fuel efficiency and electric vehicle range.
Building & construction accounts for 12.0% market share through pipes, geotextiles, and building products. Healthcare captures 11.0% share in disposable medical devices, pharmaceutical packaging, and nonwoven hygiene products. Electrical equipment & appliances represent 9.0% through appliance housings and electrical components, textiles hold 7.0% in carpet backing and nonwovens, while consumer durables & others account for 5.0% of the market.
Key market dynamics supporting packaging growth include:
The market is driven by three concrete demand factors tied to packaging evolution and light weighting imperatives. First, e-commerce growth and changing retail formats create explosive demand for protective packaging materials, with global parcel shipments projected to exceed 200 billion units annually by 2025, requiring polypropylene films, void fill, and industrial packaging solutions that protect products during distribution while minimizing dimensional weight charges. Second, automotive industry transformation toward electric vehicles accelerate polypropylene adoption in battery housings, thermal management components, and interior trim systems, as manufacturers seek 15-20% vehicle weight reduction to maximize electric range and improve efficiency while maintaining safety and durability requirements. Third, healthcare and hygiene product expansion driven by demographic trends and hygiene awareness constant demand for nonwoven polypropylene in surgical gowns, face masks, diapers, and feminine hygiene products, with global nonwovens consumption growing 6-8% annually across medical and personal care applications.
Market restraints include propylene feedstock price volatility creating margin compression and competitive pressure, particularly during periods of crude oil price spikes or natural gas supply disruptions that impact propylene production economics from steam crackers and propane dehydrogenation units. Environmental regulations targeting single-use plastics create uncertainty around long-term demand in specific packaging applications, as governments implement bans on plastic bags, straws, and food service items that historically consumed significant PP volumes. Recycling infrastructure limitations constrain circular economy ambitions, as mechanical recycling capacity remains insufficient to process available PP waste streams while maintaining quality standards for food-contact and healthcare applications, requiring substantial capital investment in advanced sorting, washing, and reprocessing facilities.
Key trends indicate accelerating adoption of circular polypropylene grades produced through mechanical and chemical recycling routes, enabling brand owners to meet recycled content commitments while maintaining material performance and regulatory compliance in food-contact applications. Development of high-melt-strength PP enables foam applications and thermoforming operations previously limited to polystyrene and PET, expanding addressable markets in protective packaging and food service items. Growing investment in propane dehydrogenation technology diversifies propylene supply away from refinery operations, improving supply reliability and reducing carbon intensity compared to naphtha-based production routes. The market thesis could face disruption if regulatory restrictions on plastic packaging accelerate globally beyond current projections or if alternative materials including paper-based and biodegradable polymers achieve cost and performance parity across key application segments.
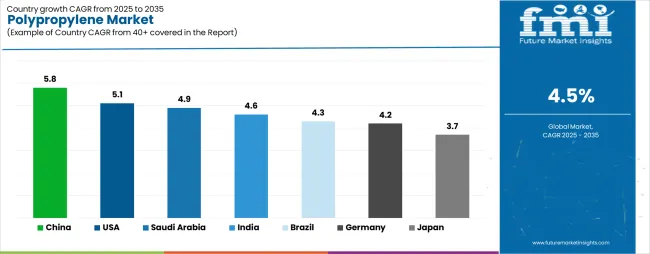
| Country | CAGR (2025 to 2035) |
|---|---|
| China | 5.8% |
| USA | 5.1% |
| India | 4.6% |
| Germany | 4.2% |
| Japan | 3.7% |
| Saudi Arabia | 4.9% |
| Brazil | 4.3% |
The market is gaining momentum worldwide, with China taking the lead thanks to massive capacity additions in PP production and packaging demand growth from e-commerce expansion combined with automotive interiors and consumer appliances manufacturing scale. Close behind, the United States benefits from propane dehydrogenation investments supporting domestic propylene supply and growing adoption in automotive lightweighting, healthcare disposables, and recycled PP applications. India shows strong advancement through fast-growing FMCG packaging demand, pipe infrastructure development, and two-wheeler and compact automotive components production supporting organized retail expansion. Germany demonstrates steady growth driven by engineering films, automotive components, and appliance housings with strong transition to circular PP grades meeting ecofriendly targets. Saudi Arabia stands out for new propylene and PP production lines tied to liquids-to-chemicals strategies and export-oriented resin production, and Japan and Brazil continue to record progress in precision applications and consumer packaging respectively. Together, China and the United States anchor the global expansion story, while emerging markets build momentum through packaging and infrastructure development.
The report covers an in-depth analysis of 40+ countries, top-performing countries are highlighted below.
China demonstrates the strongest growth potential in the market with a CAGR of 5.8% through 2035. The country's leadership position stems from massive petrochemical capacity additions including new PP production facilities, explosive e-commerce packaging demand from platforms including Alibaba and JD.com, and manufacturing scale in automotive interiors and consumer appliances. Growth is concentrated in major producing and consuming regions, including coastal provinces for petrochemical production, Pearl River Delta and Yangtze River Delta for packaging conversion, and northern provinces for automotive and appliance manufacturing. Distribution channels through established polymer trading companies and direct supply agreements with major converters expand deployment across flexible packaging, injection molding, and fiber applications. The country's dual-circulation strategy and manufacturing competitiveness initiatives provide policy support for domestic PP capacity development and value chain integration.
Key market factors:
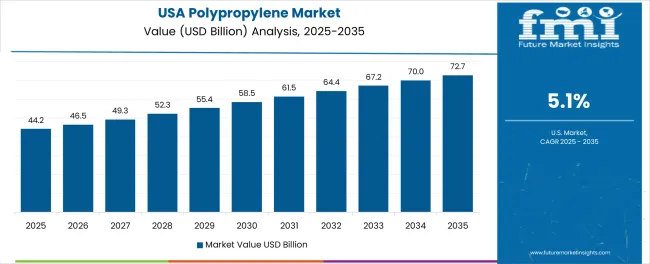
In major industrial regions including the Gulf Coast, Midwest manufacturing belt, and California consumer markets, polypropylene adoption is expanding across automotive light weighting applications, healthcare disposable products, and advanced recycling initiatives, driven by propane dehydrogenation capacity additions and ecofriendly commitments. The market demonstrates strong growth momentum with a CAGR of 5.1% through 2035, linked to reshoring of manufacturing capacity and growing focus on circular economy solutions including mechanical and chemical recycling infrastructure. American manufacturers are implementing advanced PP grades for electric vehicle battery housings, medical device applications, and food-contact recycled content meeting FDA requirements. The country's innovation leadership in chemical recycling technologies and brand owner sustainability commitments create steady demand for certified circular PP grades.
Key market characteristics:
India's market expansion is driven by fast-moving consumer goods packaging growth supporting organized retail development, polymer pipe demand for water distribution and sanitation infrastructure projects, and two-wheeler and compact automotive component manufacturing. The country demonstrates promising growth potential with a CAGR of 4.6% through 2035, supported by government initiatives including Swachh Bharat, Housing for All, and Make in India programs. Indian manufacturers are implementing PP solutions across flexible packaging for foods and personal care, woven bags for agriculture and cement, and injection-molded components for automotive and consumer durables. Growing middle-class consumption and infrastructure investment create compelling business cases for PP capacity expansion and conversion technology deployment.
Market characteristics:
Germany's advanced polymer industry demonstrates sophisticated implementation of polypropylene systems, with documented applications in high-performance films, automotive components meeting stringent safety and emissions standards, and appliance housings requiring aesthetic and functional excellence. The country's manufacturing infrastructure in major industrial centers, including Bavaria, Baden-Württemberg, North Rhine-Westphalia, and Lower Saxony, showcases integration of advanced PP grades with existing automotive and appliance production systems, leveraging expertise in polymer engineering and precision manufacturing. German manufacturers prioritize circular economy principles and REACH compliance, creating steady demand for certified recycled PP grades meeting food-contact and durability requirements. The market maintains steady growth through focus on premium applications and export competitiveness, with a CAGR of 4.2% through 2035.
Key development areas:
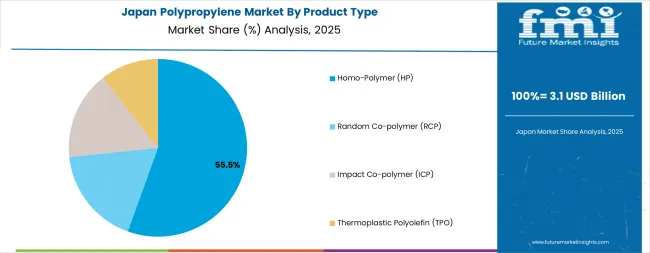
Japan's market demonstrates sophisticated implementation focused on precision films and automotive components, with documented integration of advanced PP grades achieving superior optical properties in packaging films and exceptional dimensional stability in automotive interior components. The country maintains moderate growth momentum with a CAGR of 3.7% through 2035, driven by manufacturers' focus on quality excellence and continuous improvement methodologies aligned with lean manufacturing principles. Major industrial regions showcase advanced deployment of specialty PP grades where materials integrate seamlessly with existing quality control systems and comprehensive production management programs, supporting automotive, electronics, and specialty packaging applications demanding consistent performance characteristics.
Key market characteristics:
Saudi Arabia's market expansion is driven by strategic investments in integrated propylene and polypropylene production facilities leveraging abundant hydrocarbon feedstocks, liquids-to-chemicals strategies capturing greater value from crude oil resources, and export-oriented resin production serving regional and international markets. The country demonstrates solid growth potential with a CAGR of 4.9% through 2035, supported by SABIC and other major petrochemical producers expanding capacity and developing specialty grades. Saudi manufacturers are implementing world-scale PP production units with advanced catalyst systems and process technologies producing broad product portfolios spanning packaging, automotive, and specialty applications. Growing domestic consumption in construction, packaging, and automotive sectors complements substantial export volumes to Asia, Africa, and Europe.
Market characteristics:
Brazil's market expansion is driven by consumer packaging demand for foods, beverages, and personal care products, agriculture film applications supporting modern farming practices, and appliance manufacturing serving domestic and regional markets. The country demonstrates solid growth potential with a CAGR of 4.3% through 2035, supported by domestic petrochemical capacity expansion and import substitution initiatives. Brazilian manufacturers face logistics challenges related to infrastructure and feedstock availability but are developing integrated production capabilities and regional supply relationships. Growing middle-class consumption and agricultural productivity improvements create steady demand for PP packaging films, woven bags, and injection-molded containers.
Market development factors:
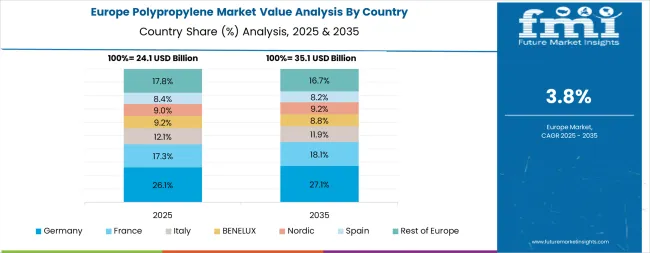
The polypropylene market in Europe represents approximately 23.0% of global revenue in 2025, concentrated in packaging, automotive, appliances, and building products. Within Europe, Germany leads with approximately 22.0% of regional market share, supported by extensive automotive manufacturing infrastructure and advanced film conversion operations in major industrial centers focusing engineering applications and circular PP adoption.
Italy follows with approximately 16.0% share driven by rigid packaging production, appliance manufacturing, and specialty conversion operations in northern industrial regions. France holds approximately 15.0% share through packaging applications, automotive components, and appliance production in major manufacturing zones. The United Kingdom commands approximately 12.0% market share driven by healthcare packaging, FMCG consumer packaging, and specialty applications.
Spain accounts for approximately 9.0% share supported by food packaging, agriculture film production, and consumer goods manufacturing. Benelux countries capture approximately 8.0% share through distribution hubs, specialty conversion, and chemical industry integration. The Nordic region maintains approximately 6.0% share driven by specialty applications and green packaging initiatives. Central and Eastern Europe, including Poland, Czech Republic, and Hungary, represent approximately 12.0% share driven by automotive component production, packaging conversion, and growing consumer markets.
Germany is anchored by automotive interior and exterior components alongside high-performance films serving packaging and technical applications. Italy and France demonstrate strength in rigid packaging including closures and containers alongside appliance housings requiring aesthetic and functional properties. The United Kingdom focuses healthcare disposables and FMCG packaging supporting consumer goods sectors, while Spain focuses on food packaging and agriculture films serving agricultural and food processing industries. The European market benefits from circular economy frameworks driving recycled PP adoption and advanced conversion technologies supporting premium applications.
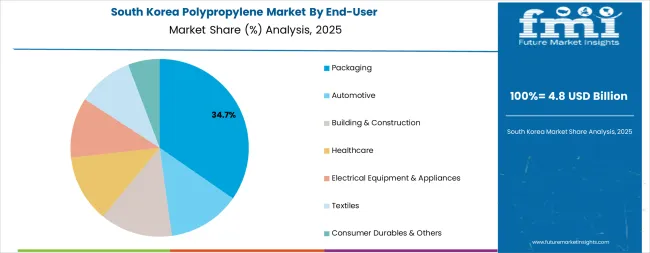
The South Korean market is characterized by strong focus on automotive interior components and flexible packaging applications, with major petrochemical producers maintaining significant positions through comprehensive product portfolios and technical service capabilities for automotive OEMs and packaging converters. The market demonstrates growing focus on light weighting and sustainability, as Korean manufacturers increasingly adopt advanced PP grades for vehicle platforms and recyclable packaging solutions supporting automotive exports and consumer goods production. Local converters are enhancing capabilities through strategic partnerships with resin producers, offering optimized solutions for automotive and packaging applications deployed across Hyundai-Kia automotive facilities and Samsung-LG consumer goods operations. The competitive landscape shows increasing collaboration between petrochemical producers and end-user industries, creating integrated value chains combining resin innovation with application development and market responsiveness.
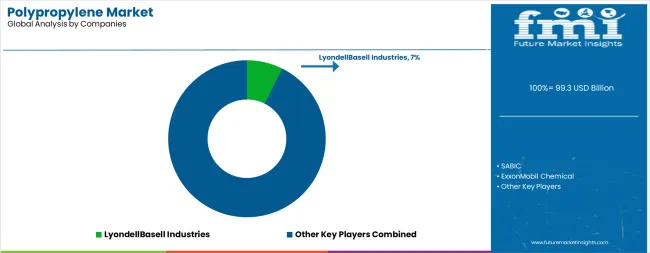
The market features approximately 25-30 meaningful players with moderate concentration, where the top three companies control roughly 20-25% of global market share through established production capacity and extensive value chain integration. Competition centers on cost position, product portfolio breadth, and technical service capabilities rather than differentiation alone. The leading company, Lyondell Basell Industries, commands approximately 7.5% of global market share through comprehensive PP product portfolios spanning homo-polymers, random and impact co-polymers, and specialty grades, supported by global production footprint and advanced catalyst technologies.
Market leaders include Lyondell Basell Industries, SABIC, and ExxonMobil Chemical, which maintain competitive advantages through integrated propylene supply, world-scale production facilities, and deep technical expertise in polymer science and application development, creating switching barriers through product qualification and technical service relationships. These companies leverage research and development capabilities and ongoing customer collaboration to defend market positions while expanding into circular PP and specialty applications.
Challengers encompass Braskem in the Americas, Borealis in Europe and Middle East, and Total Energies with global operations competing through regional strength and product specialization. Technology specialists including INEOS, Reliance Industries, Formosa Plastics Corporation, and Sinopec focus on specific geographic markets or product segments, offering differentiated capabilities in cost-competitive production, integrated value chains, and regional customer service.
Regional players and emerging producers in China, India, and Middle East create competitive pressure through capacity expansion and cost-advantaged feedstock positions, particularly in high-growth markets where local production provides logistics advantages and market responsiveness. Market dynamics favor companies that combine reliable resin quality with comprehensive technical support offerings addressing complete application requirements from material selection through process optimization and end-product performance validation supporting customer success across packaging, automotive, and industrial applications.
Polypropylene represents the world's second-most-produced thermoplastic polymer that enables manufacturers to achieve optimal cost-performance balance across diverse applications, delivering exceptional stiffness-to-weight ratios, chemical resistance, and processing versatility with densities around 0.9 g/cm³ enabling material savings compared to denser polymers while maintaining mechanical integrity. With the market projected to grow from USD 99.3 billion in 2025 to USD 154.2 billion by 2035 at a 4.5% CAGR, these versatile polymer systems offer compelling advantages - lightweight performance, recyclability, and design flexibility - making them essential for packaging applications (35% market share), automotive components (21% share), and industrial sectors seeking cost-effective polymer solutions for diverse manufacturing requirements.
| Item | Value |
|---|---|
| Quantitative Units | USD 99.3 billion |
| Product Type | Homo-Polymer (HP), Random Co-polymer (RCP), Impact Co-polymer (ICP), Thermoplastic Polyolefin (TPO) |
| End-User | Packaging, Automotive, Building & Construction, Healthcare, Electrical Equipment & Appliances, Textiles, Consumer Durables & Others |
| Processing/Conversion | Injection Molding, Film & Sheet (incl. BOPP), Pipe & Profile Extrusion, Fiber/Nonwovens (melt-blown, spunbond), Blow Molding |
| Regions Covered | Asia Pacific, Europe, North America, Latin America, Middle East & Africa |
| Country Covered | China, the USA, India, Germany, Japan, Saudi Arabia, Brazil, and 40+ countries |
| Key Companies Profiled | LyondellBasell Industries, SABIC, ExxonMobil Chemical, Braskem, Borealis, TotalEnergies, INEOS, Reliance Industries, Formosa Plastics Corporation, Sinopec |
| Additional Attributes | Dollar sales by product type, end-user, and processing/conversion categories, regional adoption trends across Asia Pacific, Europe, and North America, competitive landscape with petrochemical producers and conversion technology integrators, production facility requirements and specifications, integration with circular economy initiatives and ecofriendly programs, innovations in polymer catalyst technology and recycling systems, and development of specialized grades with enhanced performance and environmental compliance capabilities. |
The global polypropylene market is estimated to be valued at USD 99.3 billion in 2025.
The market size for the polypropylene market is projected to reach USD 154.2 billion by 2035.
The polypropylene market is expected to grow at a 4.5% CAGR between 2025 and 2035.
The key product types in polypropylene market are homo-polymer (hp), random co-polymer (rcp), impact co-polymer (icp) and thermoplastic polyolefin (tpo).
In terms of end-user, packaging segment to command 35.0% share in the polypropylene market in 2025.


Full Research Suite comprises of:
Market outlook & trends analysis
Interviews & case studies
Strategic recommendations
Vendor profiles & capabilities analysis
5-year forecasts
8 regions and 60+ country-level data splits
Market segment data splits
12 months of continuous data updates
DELIVERED AS:
PDF EXCEL ONLINE
Polypropylene Yarn Market Size and Share Forecast Outlook 2025 to 2035
Polypropylene Corrugated Packaging Market Size and Share Forecast Outlook 2025 to 2035
Polypropylene Random Copolymers Market Growth – Trends & Forecast 2025 to 2035
Polypropylene Packaging Films Market Trends - Growth & Forecast 2025 to 2035
Market Share Distribution Among Polypropylene Woven Bag and Sack Manufacturers
Polypropylene Woven Bag and Sack Market from 2024 to 2034
Polypropylene Screw Caps Market
Polypropylene Film Market
Polypropylene Fibre Market
Japan Polypropylene Packaging Films Market Size and Share Forecast Outlook 2025 to 2035
Foamed Polypropylene Films Market Growth - Demand & Forecast 2025 to 2035
Biobased Polypropylene PP Size Market Size and Share Forecast Outlook 2025 to 2035
Expanded Polypropylene (EPP) Foam Market 2025 to 2035
Surgical Polypropylene Mesh Market
Demand for Polypropylene in EU Size and Share Forecast Outlook 2025 to 2035
Melt-Blown Polypropylene Filters Market Size and Share Forecast Outlook 2025 to 2035
Medical Grade Polypropylene Market Size and Share Forecast Outlook 2025 to 2035
Biaxially Oriented Polypropylene Market Size and Share Forecast Outlook 2025 to 2035
Coupling Agent (Compatibilizer) for Polypropylene Market

Thank you!
You will receive an email from our Business Development Manager. Please be sure to check your SPAM/JUNK folder too.
Chat With
MaRIA