The global polypropylene yarn market is projected to be valued at USD 19.1 billion by 2025. It is slated to reach USD 31.7 billion by 2035, recording an absolute increase of USD 12.6 billion over the forecast period. This translates into a total growth of 66.0%, with the market forecast to expand at a CAGR of 5.2% between 2025 and 2035. According to FMI’s materials innovation tracker, used by chemical engineers and market strategists worldwide, the overall market size is expected to grow by nearly 1.66 times during the same period, supported by increasing demand for lightweight and durable textile solutions, growing adoption of polypropylene yarn in automotive and technical textile applications, and rising emphasis on cost-effective and moisture-resistant fiber systems across diverse home furnishing, packaging, and industrial processing applications.
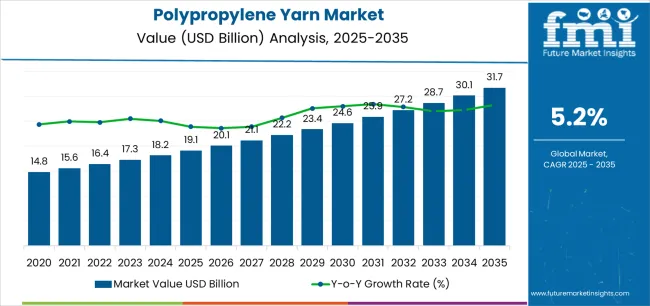
Between 2025 and 2030, the polypropylene yarn market is projected to expand from USD 19.1 billion to USD 24.6 billion, resulting in a value increase of USD 5.5 billion, which represents 43.7% of the total forecast growth for the decade. This phase of development will be shaped by increasing automotive interior upgrades, the rising adoption of advanced dye-dyed and UV-stabilized yarn formulations, and a growing demand for recyclable textile solutions that ensure durability and environmental compliance. Textile manufacturers and automotive suppliers are expanding their capabilities in polypropylene yarn production to meet the growing demand for efficient fiber production and lightweight material systems.
| Metric | Value |
|---|---|
| Estimated Value in (2025E) | USD 19.1 billion |
| Forecast Value in (2035F) | USD 31.7 billion |
| Forecast CAGR (2025 to 2035) | 5.2% |
The textile industry is the largest contributor, accounting for approximately 40-45% of the market. Polypropylene yarn is widely used in the production of carpets, upholstery fabrics, and industrial textiles due to its lightweight, durable, and cost-effective properties. The growing demand for high-performance textiles in residential, commercial, and automotive sectors contributes to the significant share from this parent market. The automotive market adds about 20-25% to the polypropylene yarn market, as the yarn is used in automotive interior fabrics, including seat covers, door panels, and carpets. The durability, resistance to stains, and ease of cleaning make polypropylene yarn an ideal choice for the automotive industry.
The packaging market contributes approximately 15-18%, where polypropylene yarn is used in the production of woven sacks, bags, and fabrics for packaging purposes. These products are commonly employed in the agricultural, food, and industrial sectors due to the material's strength and flexibility. The furniture and home decor market represents around 10-12%, with polypropylene yarn being used in the production of rugs, mats, and other home textiles. The sports and recreation market accounts for about 8-10%, where polypropylene yarn is used in the manufacturing of sportswear, outdoor gear, and recreational products like ropes and tents.
Market expansion is being supported by the increasing global demand for lightweight and durable textile materials and the corresponding need for versatile fiber systems that can deliver moisture resistance, ensure cost-effective production, and maintain performance consistency across various home textile, automotive interior, and technical fabric applications. Modern textile manufacturers and product designers are increasingly focused on implementing fiber solutions that can handle diverse processing requirements, withstand challenging use conditions, and provide reliable performance in demanding application environments. Polypropylene yarn's proven ability to deliver lightweight construction, operate with excellent moisture resistance, and support efficient manufacturing operations makes it essential material for contemporary textile production and industrial fabric facilities.
The growing emphasis on circular economy principles is driving demand for polypropylene yarns that can support recyclable material systems, ensure resource efficiency, and enable comprehensive environmental stewardship. Textile manufacturers' preference for fiber systems that combine durability with cost-effectiveness and processing versatility is creating opportunities for innovative polypropylene yarn implementations. The rising influence of automotive lightweighting and technical textile innovation is also contributing to increased adoption of polypropylene yarns that can provide reliable performance without compromising material efficiency or application functionality.
The market is segmented by product type, application, process type, and region. By product type, the market is divided into multifilament yarn, monofilament, textured, spun, and tape/fibrillated & ATY. Based on application, the market is categorized into home textiles, automotive interiors, packaging materials, construction materials, medical textiles, sports/activewear, and industrial/PPE/filtration. By process type, the market includes FDY (Fully Drawn Yarn), POY, DTY, and others. Regionally, the market is divided into Asia Pacific, North America, Europe, Latin America, and the Middle East & Africa.
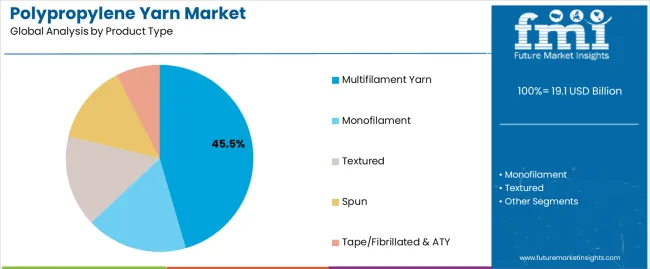
The multifilament yarn segment is projected to maintain its leading position in the polypropylene yarn market in 2025, reaffirming its role as the preferred product category with 45.5% market share for versatile textile applications and specialized fiber requirements. Textile manufacturers and product designers increasingly utilize multifilament polypropylene yarn for its superior strength characteristics, excellent dyeing versatility, and comprehensive application suitability across various fabric constructions and end-use scenarios. Multifilament yarn technology's proven effectiveness and processing flexibility directly address the industrial requirements for consistent fiber performance and reliable textile production in diverse manufacturing and application environments.
This product segment forms the foundation of modern polypropylene yarn consumption, as it represents the fiber type with the greatest application versatility and established performance record across multiple textile processes and industrial applications. Within the multifilament segment, dope-dyed variants account for 12.0% of total market share, offering superior colorfastness and reduced environmental impact through integrated pigmentation during polymer extrusion. Color-dyed formulations represent 18.0% of the market, serving applications requiring custom shade matching and batch flexibility. High-tenacity grades capture 9.0% market share through enhanced strength characteristics for demanding industrial and geotextile applications, while UV-stabilized variants account for 6.5% with specialized outdoor and agricultural textile capabilities.
Monofilament products maintain 18.0% market share, serving specialized applications including filtration fabrics, industrial meshes, and technical textiles requiring single-strand construction. Textured yarns account for 14.0% through bulked constructions for carpet and upholstery applications, while spun variants capture 12.0% with staple fiber processing. Tape/fibrillated and ATY products represent 10.5% of the market, serving specialized packaging and technical fabric requirements.
Key technological advantages driving the multifilament segment include:
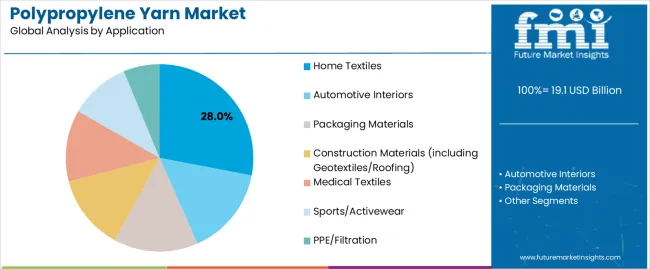
The home textiles application segment is projected to represent the largest share of polypropylene yarn demand in 2025 with 28% market share, underscoring its critical role as the primary driver for specialized yarn adoption across residential carpeting, upholstery fabrics, and home furnishing operations. Home textile manufacturers prefer polypropylene yarn for fabric production due to its excellent moisture resistance, reliable stain resistance performance, and ability to ensure cost-effective textile manufacturing while supporting product durability and maintenance efficiency. Positioned as essential material for modern home furnishing operations, polypropylene yarn offers both economic advantages and performance benefits.
Within the home textiles segment, carpets and rugs represent the largest sub-category at 10.5% of total market share, driven by polypropylene's excellent wear resistance, stain repellency, and cost advantages in residential and commercial floor covering applications. Mattress and linen applications account for 8.5% through moisture management properties and hygienic characteristics. Upholstery fabrics capture 5.0% market share with durable constructions for furniture applications, while curtains and blinds represent 4.0% through UV-resistance and dimensional stability.
The automotive interiors segment represents the second-largest application category, capturing 20.0% market share through interior trim fabrics, door panels, trunk liners, and acoustic insulation materials requiring lightweight construction and durability. This segment benefits from automotive industry lightweighting initiatives and growing demand for cost-effective interior materials with consistent performance characteristics.
Packaging materials account for 16.0% market share, serving woven sacks, bulk container fabrics, and flexible intermediate bulk containers requiring high strength and moisture resistance. Construction materials including geotextiles and roofing membranes capture 15.0% through soil stabilization, drainage systems, and waterproofing applications. Medical textiles represent 9.0% with specialized applications in disposable surgical fabrics and hygiene products, while sports/activewear accounts for 7.0% through moisture-wicking athletic fabrics. Industrial/PPE/filtration applications represent 5.0% of the market with specialized technical textile requirements.
Key market dynamics supporting application growth include:
The polypropylene yarn market is advancing steadily due to increasing demand for lightweight and cost-effective textile materials and growing adoption of specialized fiber technologies that provide enhanced moisture resistance and durability across diverse home textile, automotive, and technical fabric applications. The market faces challenges, including competition from alternative synthetic fibers and natural materials, environmental concerns regarding plastic-based textiles and recyclability, and raw material price volatility affecting production economics. Innovation in recycled-content formulations and circular economy integration continues to influence product development and market expansion patterns.
The growing adoption of eco-conscious initiatives and circular economy principles is enabling textile manufacturers to achieve better environmental performance, reduce virgin polymer consumption, and implement comprehensive lifecycle management, improving their corporate environmental positioning. Recycled-content polypropylene yarn formulations help lower carbon footprints while allowing textile producers to meet brand eco-friendly goals and regulatory requirements across automotive, home textile, and packaging sectors. Manufacturers are increasingly recognizing the competitive advantages of integrating recycled content for market differentiation and environmental responsibility.
Modern polypropylene yarn manufacturers are incorporating advanced dope-dyeing technologies and functional additives to enhance color consistency, reduce water consumption, and support comprehensive performance optimization through integrated UV stabilization, antimicrobial treatments, and flame-retardant systems. These technologies improve textile functionality while enabling new applications, including outdoor fabrics, healthcare textiles, and specialty industrial materials. Advanced functional integration also allows manufacturers to support comprehensive performance objectives and application requirements beyond traditional commodity yarn approaches.
| Country | CAGR (2025-2035) |
|---|---|
| India | 5.6% |
| United States | 5.1% |
| China | 4.8% |
| South Korea | 4.6% |
| Japan | 4.2% |
| Germany | 3.9% |
| United Kingdom | 3.7% |
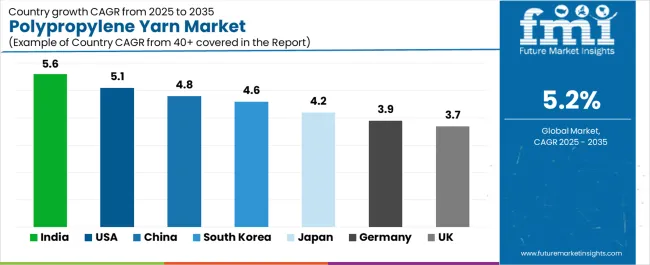
The polypropylene yarn market is experiencing solid growth globally, with India leading at a 5.6% CAGR through 2035, driven by the expanding domestic textile manufacturing base, growing technical textiles sector, and significant government policy support for man-made fiber production and home furnishings exports. The United States follows at 5.1%, supported by automotive interior upgrades, growing geotextile applications, and increasing adoption of low-VOC dope-dyed yarn systems for environmental compliance.
China shows growth at 4.8%, emphasizing its large packaging and home textile manufacturing base with ongoing upgrades to high-tenacity grades. South Korea records 4.6%, focusing on advanced electronics and EV supply chain integration with specialized PP nonwovens. Japan demonstrates 4.2% growth, supported by premium medical textiles and precision manufacturing applications. Germany exhibits 3.9% growth, emphasizing geosynthetic infrastructure applications and circular economy initiatives. The United Kingdom shows 3.7% growth, supported by home improvement markets and technical textile specialization.
The report covers an in-depth analysis of 40+ countries; seven top-performing countries are highlighted below.
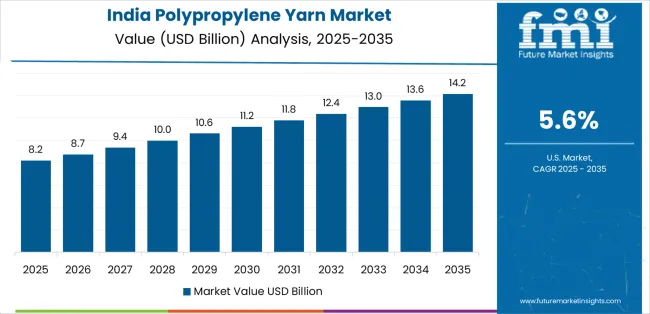
Revenue from polypropylene yarn in India is projected to exhibit exceptional growth with a CAGR of 5.6% through 2035, driven by expanding domestic textile manufacturing capacity and rapidly growing technical textiles sector supported by government National Technical Textiles Mission and man-made fiber promotion programs. The country's massive home textile production base and increasing investment in advanced yarn manufacturing technologies are creating substantial demand for polypropylene fiber systems. Major textile companies and synthetic fiber producers are establishing comprehensive polypropylene yarn capabilities to serve both domestic furnishing markets and growing home textile export opportunities.
Demand for polypropylene yarn in the United States is expanding at a CAGR of 5.1%, supported by the country's automotive interior refresh cycles, increasing geotextile infrastructure applications, and rising demand for environmentally compliant dope-dyed yarn systems in commercial and residential textile markets. The country's mature automotive manufacturing base and expanding civil engineering infrastructure are driving demand for specialized polypropylene yarn capabilities. Domestic fiber producers and international yarn manufacturers are establishing extensive production and technical service capabilities to address the growing demand for functional polypropylene yarns.
Revenue from polypropylene yarn in China is growing at a CAGR of 4.8%, supported by the country's massive packaging material production, extensive home textile manufacturing infrastructure, and ongoing technology upgrades for high-tenacity industrial yarn applications. The nation's dominant position in global textile manufacturing and emphasis on value-added synthetic fiber products are driving sophisticated polypropylene yarn capabilities throughout the manufacturing sector. Leading textile companies and chemical fiber producers are investing extensively in advanced spinning technology and functional yarn development.
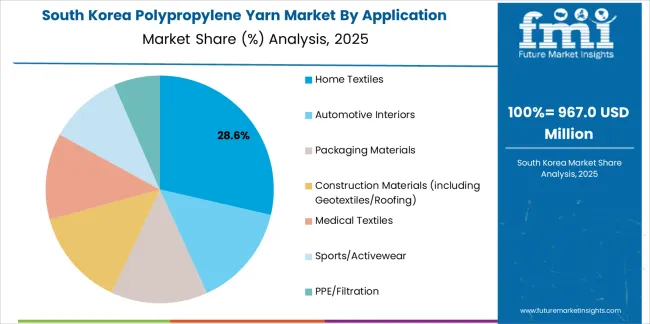
Demand for polypropylene yarn in South Korea is expected to grow at a CAGR of 4.6%, driven by expanding electronics and EV supply chain requirements for specialized PP nonwoven materials, increasing production of advanced color and UV-stable yarn grades, and strong export orientation in technical fabric manufacturing. The country's advanced automotive and electronics industries and emphasis on high-performance materials are supporting demand for premium polypropylene yarn technologies across specialized application segments. Domestic chemical companies and specialty yarn producers are establishing comprehensive capabilities to serve both domestic manufacturing requirements and regional export opportunities.
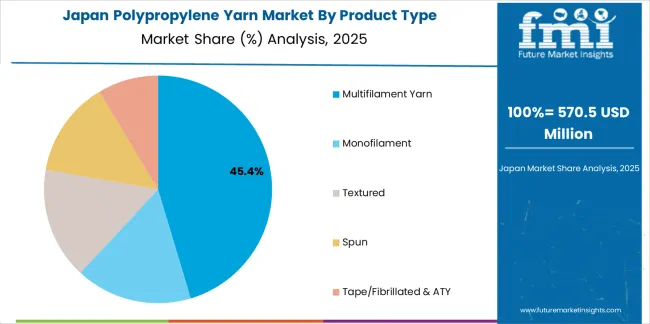
Revenue from polypropylene yarn in Japan is anticipated to expand at a CAGR of 4.2%, supported by the country's focus on medical and cleanroom textile applications, premium home and automotive interior trim materials, and strong emphasis on process quality and yarn uniformity optimization in precision textile manufacturing. The nation's sophisticated healthcare sector and advanced automotive industry are driving demand for high-quality polypropylene yarn products and specialized functional systems. Leading fiber companies are investing in specialized capabilities to serve medical device, healthcare textile, and premium automotive interior applications.
Demand for polypropylene yarn in Germany is expanding at a CAGR of 3.9%, supported by the country's advanced geosynthetic infrastructure applications, established OEM automotive interior supply chains, and strong emphasis on circular economy principles with recycled polypropylene yarn development. The nation's comprehensive infrastructure investment programs and automotive manufacturing excellence are driving sophisticated polypropylene yarn capabilities throughout technical textile and automotive supply sectors. Leading chemical companies and specialty yarn producers are investing extensively in eco-friendly yarn technology development and recycled-content formulations.
Revenue from polypropylene yarn in the United Kingdom is growing at a CAGR of 3.7%, driven by the country's emphasis on home improvement and contract carpet markets, growing performance packaging applications, and strong focus on niche technical textile converter capabilities. The UK's established home furnishing retail sector and specialized technical textile industry are supporting investment in polypropylene yarn capabilities throughout residential and commercial textile markets. Industry leaders are establishing comprehensive yarn sourcing and product development systems to serve both domestic market requirements and specialized export applications.
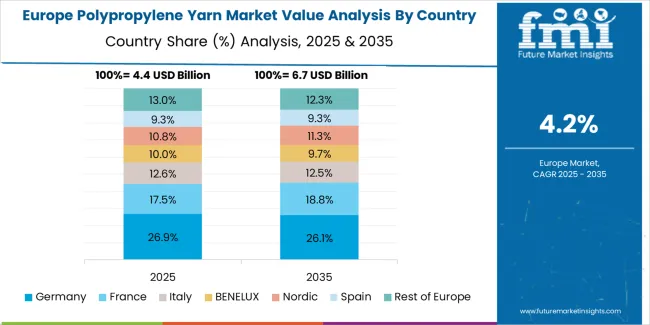
The polypropylene yarn market in Europe is projected to grow from USD 5.2 billion in 2025 to USD 8.1 billion by 2035, registering a CAGR of 4.5% over the forecast period. Germany is expected to maintain its leadership position with a 34.2% market share in 2025, supported by its strong automotive manufacturing base, geosynthetic infrastructure applications, and comprehensive technical textile production serving major European markets.
Italy follows with 18.0% in 2025, driven by established contract upholstery production, carpet manufacturing excellence, and fashion accessory applications implementing polypropylene yarn solutions. The United Kingdom holds 18.6% in 2025, supported by retail carpet market strength and specialized packaging applications. France maintains 15.9% market share through balanced home textile and industrial nonwoven consumption. Spain accounts for 7.0% in 2025 with growing technical agro-textile and hospitality furnishing applications.
The Benelux region commands 6.3% market share, specializing in high-tenacity and dope-dyed multifilament for technical applications. The Nordic countries maintain 4.0% share with emphasis on UV-stable and low-VOC yarns for outdoor applications. Central & Eastern Europe, including Poland, Czech Republic, and Romania, is anticipated to gain momentum, holding a collective 10.0% share, attributed to rapidly expanding export-oriented converter operations supplying Western European OEMs in automotive interiors and flexible packaging applications.
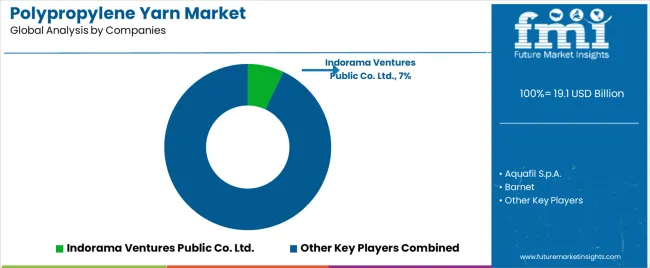
The polypropylene yarn market is characterized by competition among integrated petrochemical companies, specialized synthetic fiber producers, and regional yarn manufacturers. Companies are investing in advanced spinning technology research, functional additive development and comprehensive product portfolios to deliver cost-effective, durable, and versatile polypropylene yarn solutions. Innovation in dope-dyeing technologies, recycled-content formulations, and specialized functional treatments is central to strengthening market position and competitive advantage.
Indorama Ventures Public Co. Ltd. leads the market with 7% share through comprehensive petrochemical integration, offering advanced polypropylene yarn with a focus on recycled-content formulation development across diverse textile applications. Aquafil S.p.A. provides specialized synthetic fiber solutions with emphasis on circular economy principles and regenerated polymer systems. Filatex India Ltd. delivers innovative yarn manufacturing with focus on domestic market leadership and cost-effective production capabilities. Barnet specializes in industrial yarn applications with emphasis on packaging and technical textile markets. Drake Extrusion, Inc. focuses on specialized monofilament and tape yarn production for industrial and agricultural applications.
LEGS Sp. z o.o. offers comprehensive polypropylene yarn solutions from Central European manufacturing with focus on automotive and technical textile markets. Lotte Chemical Corp. provides integrated polymer and fiber production with emphasis on Asian market supply. RadiciGroup delivers specialized high-performance yarn with focus on automotive and industrial applications. Thrace Group offers comprehensive polypropylene-based packaging and industrial textile solutions with expanding geosynthetic capabilities. U.P. Filaments specializes in multifilament yarn production for home textile and industrial markets.
Polypropylene yarn represents a specialized synthetic fiber segment within textiles and technical fabrics, projected to grow from USD 19.1 billion in 2025 to USD 31.7 billion by 2035 at a 5.2% CAGR. These versatile thermoplastic fiber systems—primarily multifilament configurations for diverse textile applications—offer lightweight construction, excellent moisture resistance, and cost-effective production in home textiles, automotive interiors, packaging materials, and construction geotextile applications. Market expansion is driven by increasing home furnishing demand, growing automotive lightweighting initiatives, expanding technical textile infrastructure, and rising emphasis on cost-effective and durable fiber solutions in diverse industrial environments.
How Textile Industry Regulators Could Strengthen Product Standards and Environmental Compliance?
Fiber Performance Standards: Establish comprehensive technical specifications for polypropylene yarn, including tensile strength, elongation characteristics, color fastness properties, and dimensional stability requirements that ensure consistent performance in textile manufacturing and end-use applications.
Environmental Compliance Integration: Develop regulatory frameworks addressing polypropylene textile recyclability, microfiber emission control, and end-of-life management requiring advanced collection systems, mechanical recycling infrastructure, and circular economy integration that minimize environmental impact.
Safety and Flammability Requirements: Implement mandatory fire safety standards for polypropylene textiles in residential and commercial applications, including flame retardant treatments, smoke generation limits, and toxicity requirements specific to home furnishing and transportation interior uses.
Eco-labeling Standards: Establish standardized disclosure requirements for recycled content, carbon footprint, and environmental attributes to enhance consumer awareness and foster the market development of eco-friendly polypropylene yarn products.
Technical Textile Quality Assurance: Provide regulatory support for geotextile and industrial fabric performance standards, including long-term durability testing, environmental resistance validation, and application-specific certification that ensure reliable infrastructure performance.
How Textile Industry Associations Could Advance Technology Standards and Market Development?
Yarn Specification Standards: Develop comprehensive technical guidelines for polypropylene yarn classification, performance testing, and quality control that optimize manufacturing consistency, enable product comparison, and ensure reliable performance across different spinning processes and end applications.
Processing Best Practices: Establish standardized procedures for yarn dyeing, texturing, and finishing operations specifically designed for polypropylene fibers with unique thermal and chemical properties requiring specialized processing approaches.
Application Performance Guidelines: Create industry-wide recommendations for yarn selection in specific end uses including carpet construction, automotive interiors, and geotextile applications that enable optimal performance, durability, and cost-effectiveness.
Eco-certification Systems: Establish comprehensive programs for recycled-content verification, environmental performance assessment, and circular economy compliance to support the market growth of eco-friendly polypropylene products.
Professional Training and Education: Facilitate specialized training for textile engineers, quality control personnel, and product designers covering polypropylene fiber properties, processing requirements, and application optimization in diverse textile manufacturing environments.
How Yarn Manufacturers Could Drive Innovation and Competitive Advantage?
Advanced Functional Formulations: Invest in research and development of enhanced polypropylene yarn with integrated UV stabilization, antimicrobial properties, flame retardancy, and specialized surface treatments that enable superior performance in demanding applications while expanding market opportunities.
Eco-friendly Production Systems: Develop comprehensive recycled-content formulations using post-consumer and post-industrial polypropylene waste, leveraging mechanical and chemical recycling technologies to maintain fiber performance while minimizing environmental impact and meeting brand eco-friendly requirements.
Process Technology Innovation: Engineer advanced spinning and drawing systems with improved energy efficiency, reduced water consumption, and enhanced process control that optimize production economics while maintaining superior yarn quality and consistency.
Customization Capabilities: Create flexible manufacturing platforms with rapid color matching, specialized denier ranges, and application-specific property optimization that enable customized solutions for diverse customer requirements across textile and industrial markets.
Global Supply Chain Excellence: Establish comprehensive distribution networks providing reliable yarn availability, technical support services, and collaborative product development that ensure optimal customer performance throughout extended business relationships.
How Textile Manufacturers and Converters Could Optimize Production and Product Performance?
Strategic Material Selection: Conduct comprehensive assessments of fiber requirements, processing capabilities, and end-use performance needs to optimize polypropylene yarn selection considering cost, functionality, and eco-conscious goals, while enhancing product competitiveness.
Advanced Processing Optimization: Implement specialized dyeing, weaving, and finishing technologies specifically adapted for polypropylene fiber properties to achieve superior color consistency, dimensional stability, and functional performance in finished textile products.
Quality Management Systems: Utilize statistical process control, automated testing equipment, and comprehensive inspection protocols to ensure consistent yarn and fabric quality while minimizing defects and production waste across manufacturing operations.
Eco-conscious Integration: Develop systematic approaches for incorporating recycled-content polypropylene yarn, optimizing material efficiency, and implementing closed-loop manufacturing that reduces environmental impact while meeting customer eco-friendly expectations.
Product Innovation Programs: Collaborate with yarn suppliers on new product development including specialized functional textiles, enhanced performance characteristics, and novel application opportunities that create market differentiation and competitive advantages.
How Design Professionals and Brand Owners Could Enable Market Growth?
Eco-friendly Product Development: Specify polypropylene yarn with verified recycled content, reduced environmental footprint, and circular economy integration in carpet, upholstery, and automotive interior designs that align with corporate eco-conscious commitments while maintaining performance standards.
Performance Optimization: Leverage polypropylene fiber advantages including moisture resistance, stain repellency, and lightweight construction in product designs that deliver enhanced functionality, reduced maintenance requirements, and improved user experience.
Market Education Initiatives: Promote consumer understanding of polypropylene textile benefits, recyclability potential, and performance characteristics through transparent communication that supports market acceptance and demand growth.
Circular Economy Leadership: Develop product take-back programs, recycling partnerships, and closed-loop supply chains that demonstrate commitment to environmental responsibility while creating business model innovation and competitive differentiation.
Innovation Partnerships: Collaborate with yarn manufacturers and textile converters on breakthrough product concepts, novel applications, and emerging market opportunities that expand polypropylene yarn utilization across diverse industries.
How Investors and Financial Enablers Could Support Market Growth and Industry Development?
Manufacturing Capacity Expansion: Provide capital for new spinning facilities, technology upgrades, and production efficiency improvements that meet growing polypropylene yarn demand while reducing costs and environmental impact across global markets.
Recycling Infrastructure Development: Finance mechanical recycling plants, chemical depolymerization facilities, and collection systems that enable circular economy implementation and support green polypropylene yarn production from post-consumer waste streams.
Technology Innovation Investment: Support research and development of advanced spinning processes, functional additives, and specialty formulations that enhance polypropylene yarn performance while addressing current limitations and emerging application requirements.
Supply Chain Integration: Provide financing for vertical integration initiatives, strategic partnerships, and regional production networks that optimize supply chain efficiency while ensuring reliable material availability and customer service excellence.
Emerging Market Development: Fund capacity expansion and market development initiatives in high-growth regions including India, Southeast Asia, and Latin America, creating new demand centers while supporting economic development and textile industry growth.
| Items | Values |
|---|---|
| Quantitative Units (2025) | USD 19.1 billion |
| Product Type | Multifilament Yarn (Dope-dyed, Color-dyed, High-tenacity, UV-stabilized), Monofilament, Textured, Spun, Tape/Fibrillated & ATY |
| Application | Home Textiles (Carpets & rugs, Mattress/linens, Upholstery, Curtains/blinds), Automotive Interiors, Packaging Materials, Construction Materials (Geotextiles/Roofing), Medical Textiles, Sports/Activewear, Industrial/PPE/Filtration |
| Process Type | FDY (Fully Drawn Yarn - Standard, Intermingled, Twisted), POY, DTY, Others |
| Regions Covered | Asia Pacific, North America, Europe, Latin America, Middle East & Africa |
| Countries Covered | India, United States, China, South Korea, Japan, Germany, United Kingdom, and 40+ countries |
| Key Companies Profiled | Indorama Ventures Public Co. Ltd., Aquafil S.p.A., Barnet, Drake Extrusion Inc., Filatex India Ltd., LEGS Sp. z o.o., Lotte Chemical Corp., RadiciGroup, Thrace Group, U.P. Filaments |
| Additional Attributes | Dollar sales by product type, application, and process category, regional demand trends, competitive landscape, technological advancements in spinning and dyeing systems, recycled-content development, circular economy innovation, and functional performance optimization |
Asia Pacific
North America
Europe
Latin America
Middle East & Africa
The global polypropylene yarn market is estimated to be valued at USD 19.1 billion in 2025.
The market size for the polypropylene yarn market is projected to reach USD 31.7 billion by 2035.
The polypropylene yarn market is expected to grow at a 5.2% CAGR between 2025 and 2035.
The key product types in polypropylene yarn market are multifilament yarn, monofilament, textured, spun and tape/fibrillated & aty.
In terms of application, home textiles segment to command 28.0% share in the polypropylene yarn market in 2025.


Full Research Suite comprises of:
Market outlook & trends analysis
Interviews & case studies
Strategic recommendations
Vendor profiles & capabilities analysis
5-year forecasts
8 regions and 60+ country-level data splits
Market segment data splits
12 months of continuous data updates
DELIVERED AS:
PDF EXCEL ONLINE
Polypropylene Market Size and Share Forecast Outlook 2025 to 2035
Polypropylene Corrugated Packaging Market Size and Share Forecast Outlook 2025 to 2035
Polypropylene Random Copolymers Market Growth – Trends & Forecast 2025 to 2035
Polypropylene Packaging Films Market Trends - Growth & Forecast 2025 to 2035
Market Share Distribution Among Polypropylene Woven Bag and Sack Manufacturers
Polypropylene Woven Bag and Sack Market from 2024 to 2034
Polypropylene Screw Caps Market
Polypropylene Film Market
Polypropylene Fibre Market
Japan Polypropylene Packaging Films Market Size and Share Forecast Outlook 2025 to 2035
Foamed Polypropylene Films Market Growth - Demand & Forecast 2025 to 2035
Biobased Polypropylene PP Size Market Size and Share Forecast Outlook 2025 to 2035
Expanded Polypropylene (EPP) Foam Market 2025 to 2035
Surgical Polypropylene Mesh Market
Demand for Polypropylene in EU Size and Share Forecast Outlook 2025 to 2035
Melt-Blown Polypropylene Filters Market Size and Share Forecast Outlook 2025 to 2035
Medical Grade Polypropylene Market Size and Share Forecast Outlook 2025 to 2035
Biaxially Oriented Polypropylene Market Size and Share Forecast Outlook 2025 to 2035
Coupling Agent (Compatibilizer) for Polypropylene Market
Spun Yarn Paper Cone Market

Thank you!
You will receive an email from our Business Development Manager. Please be sure to check your SPAM/JUNK folder too.
Chat With
MaRIA