Microbial Therapeutic Products Market
Market Insights on Microbial Therapeutic Products covering sales outlook, demand forecast & up-to-date key trends
Microbial Therapeutic Products Market by Product, Route of Administration, Source, Application, End User & Region - Forecast 2022 - 2030
Microbial Therapeutic Products Market Outlook (2022-2030)
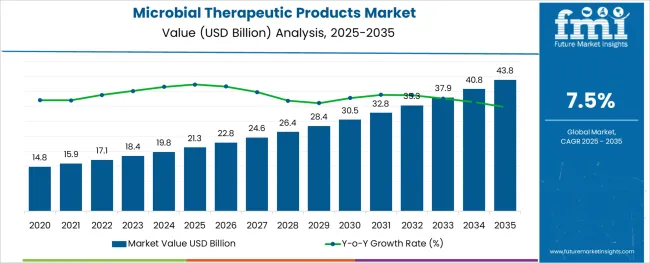
[250 Pages Report] Global consumption of microbial therapeutic products is predicted to be worth US$ 17.11 Bn in 2022. The market is projected to register 7.5% CAGR and reach a valuation of US$ 30.55 Bn by the end of 2030.
Microbial Therapeutic Products Market Size (2022) |
US$ 17.11 Bn |
Revenue Forecast (2030) |
US$ 30.55 Bn |
Global Market Growth Rate (2022-2030) |
7.5% CAGR |
Dominant Application |
Oncology (24.2% Share) |
The microbial therapeutic products market is expected to continue to rise at a healthy rate owing to rising incidence of antibiotic resistance across the world. Microbial therapeutic products currently account for 10.7% share in the global cancer therapy market.
Let us know your requirement to get
100% FREE customization
How The Market Progressed Till June 2022?
Particulars |
Details |
H1, 2021 |
7.47% |
H1, 2022 Projected |
7.51% |
H1, 2022 Outlook |
7.31% |
BPS Change - H1, 2022 (O) – H1, 2022 (P) |
(-) 20 ↓ |
BPS Change – H1, 2022 (O) – H1, 2021 |
(-) 16 ↓ |
The market for microbial therapeutic products is subject to changes as per the regulatory impositions and quality control guidelines within its region of jurisdiction, with reference to the macro and industry scale dynamics.
H1-2022 outlook period in comparison to H1-2022 projected period showed a negative growth in terms of Basis Point Share by 20 BPS. However, In H1-2022, the market growth rate of microbial therapeutic products is expected to fall by 16 basis point share (BPS), as per FMI analysis.
The drop in the BPS values observed is due to the initial restrictive impact of the COVID-19 pandemic globally. With the restrictions in production and distribution activities, the market observed a decline in the BPS values. Moreover, the high cost of production of microbial therapeutic products also poses operational cost burden upon manufacturers.
Conversely, with the growing trend of contract manufacturing within developing countries of the Asian region for microbial therapeutic products, the market is set to expand with a positive growth outlook over the forecasted years. The key developments in the market include the expansion of the bioprocess industry into processes with consolidated flow for up-scale of materials.
Microbial Therapeutic Product Demand Analysis (2015 to 2021) Vs Market Outlook (2022 to 2030)
A microbe, such as a bacteria, yeast, or fungus, is a microscopic living entity. Microbes create microbial treatment products, which are mostly used to make cheese, wine, vinegar, and bread. Enzyme, antibiotic, and nutrition production are all examples of medicinal microbiology.
Microbes have been portrayed as our enemies throughout most of modern medical history; yet, it is now plainly obvious that they can be exploited as therapies. In reality, a growing number of firms currently are focusing on microbial treatment products leading to clinical development in their product pipelines. The few extant live bacterial prophylactic vaccines and more recent efforts employing fecal microbiota transplant demonstrate the potential of therapeutic microbial.
Several studies have found that microbial imbalance is linked to the risk of getting certain diseases. The commercial prospects have improved as the focus on creating therapeutic microbial medicines that treat and successfully mitigate the development of these kinds of diseases has gained traction.
The microbial therapeutic products market expanded at a CAGR of 6.6% from 2015 to 2021, and amassed revenue worth US$ 15.94 Bn in 2021. The market is primarily driven by rising prevalence of lifestyle-related chronic diseases and antibiotic resistance.
As a result, market players are scrambling to create novel solutions and products to cure a variety of immunological illnesses and other bodily ailments, consequently expanding the market's scope in the coming years.
Sales of microbial therapeutic products are predicted to surge at a CAGR of 7.5% from 2022 to 2030, with the global market expected to close in on a valuation of US$ 30.55 Bn by 2030.
Why is Demand for Microbial Therapeutic Products Expected to Grow?
“Increasing Cases of Chronic Disorders Fueling Sales of Microbial Therapeutic Products”
WHO reports that "Noncommunicable diseases (NCDs) claim the lives of 41 million people each year, accounting for 71% of all deaths worldwide. More than 15 million people between the ages of 30 and 69 die each year from an NCD; 85 percent of these "premature" deaths occur in low- and middle-income nations ".
Chronic diseases, also known as noncommunicable diseases, are long-term illnesses caused by a mix of genetic, physiological, environmental, and behavioural factors. Diabetes, cardiovascular disease, cancer, and asthma are all likely to become more common as the global senior population grows.
Pharmaceutical companies are boosting their research to produce viable therapies against this backdrop. The importance of microbes in human health and disease has become increasingly recognized over time.
By combining non-pathogenic bacteria into living biotherapeutics made up of synthetic microbes, a new study has revealed the possibilities of building live biotherapeutics to address specific disease pathways. Given the rising prevalence of the global population and the growth of numerous lifestyle disorders, emerging economies are anticipated to emerge as potential opportunity centers.
“Improved Technologies in Disease Diagnostic Driving Demand for Microbial Therapeutic Solutions”
Disease diagnosis is transforming as the global healthcare business faces paradigm transformations. Healthcare institutions are investing in technologically enhanced testing and diagnostic procedures in response to increased demand for shorter turnaround times, multiplexing of reactions, and specificity.
- For Example, the Mass Spec Pen, developed by University of Texas researchers, is capable of detecting and separating malignant tissue with a 96 percent accuracy rate. It analyses tissue metabolites, allowing surgeons to distinguish between healthy tissues and tumours without having to label them separately.
- To date, the Mass Spec Pen has been used to detect breast, ovarian, thyroid, lung, and pancreatic tumours in over 800 human tissues using an ex-vivo technique.
Clinical trials are currently underway to explore in-vivo techniques as well as other minimally invasive procedures to improve patient comfort.
“Rising Investments in R&D of Biological Drugs Aiding Sales Microbial Therapeutic Solutions”
Governments worldwide have proactively lobbied for increased funding allocation to even further biosimilar medication development research works. The FDA in the United States, for example, has recently approved roughly 300 biologics products, with 87 percent of them being imports.
This is expected to open up new opportunities for the development of future microbial therapeutic products. Europe, on a similar note, has favourable reimbursement regulations for drug development.
Based on these trends, the future of microbial therapeutic products appears to be bright, with major manufacturers striving to establish a consolidated presence across key regions throughout the projected period.
Find your sweet spots for generating winning opportunities in this market.
Talk to AnalystWhich Challenges May Impede Sales Growth of Microbial Therapeutic Products?
“Dearth of Proper Data May Decrease Microbial Therapeutic Enzyme Demand”
The scarcity of proper data is a serious challenge for microbial therapy professionals. According to Microbiotica, a famous microbiome researcher, the mapping of diverse bacteria sources is imprecise, making most treatments unnecessary. While identification is possible, the consequences of many strains on human health are unknown.
Furthermore, many of the specific bacteria's functions can be shared by unrelated species. Thus, there may only be one comparable strain within a group of roughly ten germs connected to any given disease. This provides a problem in terms of determining which formulations should be used to ensure the drug's efficacy.
Even though that a variety of treatment options have arisen, there is no universal agreement on which, is most effective. One such option is live bacterial therapies, which, despite being widely used, are still equivocal in terms of effectiveness. Many researchers have been unsuccessful in demonstrating how to live bacteria engraft and persist in the gut after intake.
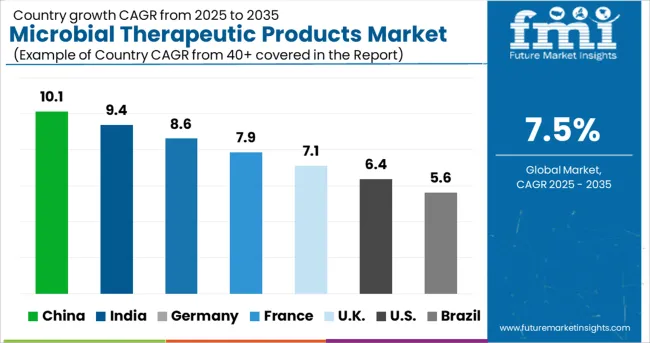
Which Regional Markets are Likely to Generate High Revenue for Microbial Therapeutic Product Manufacturers?
“Increasing Cases of Chronic Disorders Augmenting Sales Growth of North America Market”
North America will continue to be the world's largest market for microbial therapeutics products, with global volume sales expected to rise at a rapid pace. The key growth catalyst is the increasing frequency of regulatory approvals for biosimilar candidates. Chronic disease cases are on the rise, which bodes well for market expansion.
According to the NCBI, cancer has been a serious public health concern in Europe since the beginning of the twenty-first century, with a prevalence rate of about 3% and rising to 15% as people get older. The main factor is the growing geriatric population.
Furthermore, the World Health Organization predicts that noncommunicable diseases such as diabetes, chronic respiratory diseases, mental disorders, and cardiovascular diseases (CVDs) account for 86 percent of fatalities and 77 percent of the disease burden in the region. This is partly due to the predominance of sedentary behaviours.
Furthermore, as bacteria strains evolve, the burden of contagious diseases is increasing, as is antibiotic resistance. As a result, pharmaceutical companies are rushing to create a variety of microbial therapeutic solutions.
By 2030, the East Asia market is predicted to grow at a dizzying rate. The growing presence of key pharmaceutical companies that are introducing novel drug combinations to address the rising burden of chronic and infectious diseases is largely to blame for the industry's growth.
A unified Market Research Subscription Platform, built for today's disparate research needs.
Country-wise Analysis
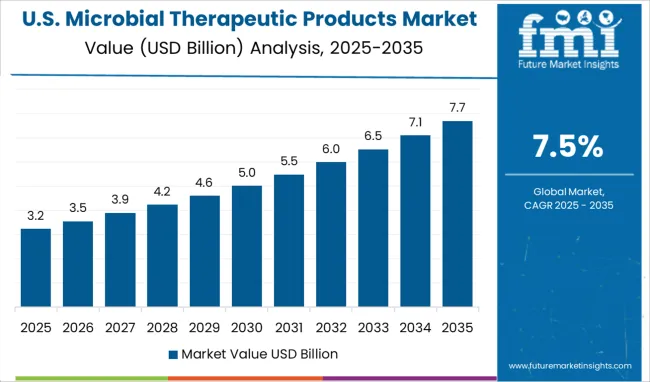
How is Demand for Microbial Therapeutic Products Shaping Up in the U.S. Market?
“Rising Cases of Cancer Increasing Demand for Microbial Therapeutic Products”
The increased prevalence of cancer in the United States is expected to increase the demand for microbial therapeutic solutions. In the United States, cancer is the second largest cause of death.
"In 2022, there will be a predicted 1.9 Mn new cancer cases diagnosed and 609,360 cancer deaths in the United States," according to cancer.org.
Pharmaceutical companies are utilizing microbial treatments, largely bacteria-derived, to regress various forms of cancer and other ailments as a result of this, prompting experts to create a variety of modified bacterial strains.
How is the China Microbial Therapeutic Products Market Growing?
“Presence of Key Pharma Companies Aiding Microbial Therapeutic Products Market Growth”
One of the most potential biotechnologies in the globe is biopharmaceutical technology. Biopharmaceuticals are flourishing and increasing rapidly as a worldwide high-tech biotechnology business, providing biopharmaceuticals with unparalleled market possibilities in China and other developing countries, due to the advancement of modern biotechnology.
Growth of biopharmaceutical solutions in the country is increasing because most pharma and biopharma companies are focusing on capitalizing on the expansion, including looking for opportunities to collaborate/partner with local firms, which is assisting the emergence and growth of the microbial therapeutics products market over the forecast period.
Category-wise Analysis
Which Product Segment is Likely to Account for High Market Expansion?
“Anti-cancer Agents Offer Plethora of Possibilities Due to Increasing R&D Investments by Key Producers”
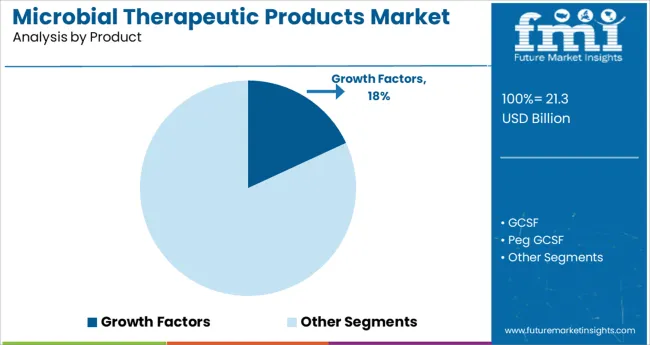
Growing worldwide cancer burden is fuelling rapid improvements in oncology, opening the door for increased anti-cancer drug sales in key regions. The segment is predicted to reach massive volume sales by 2022 end. For a variety of malignancies, a crucial growth stimulant, several precision-based therapy candidates are being investigated.
Simultaneously, demand for antimicrobial growth factors is increasing significantly. Healthcare and pharmaceutical key companies are incorporating this method into their medicine formulations due to the increased possibility for improved tissue regeneration among patients. Through 2030, the segment is expected to expand at a high CAGR.
Which Injections are the Prominent Route of Administration?
“Single-use Pre-filled Injections/Injector Pens to Remain Eminent Route of Administration”
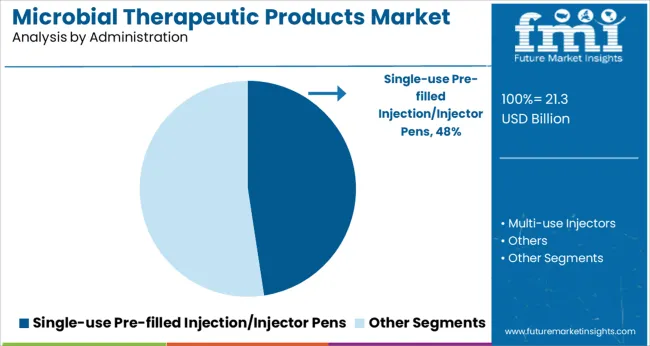
Single-use pre-filled injections will be the most commonly used technique for infusing microbial therapeutic agents by route of delivery. Concerns about infection transmission through multiple-use injections are driving an increase in the use of single-use injection pens.
The others segment is predicted to have the most influence, generating more than 40% of revenue over the forecast period. Eco Therapeutics and fecal microbiota transplants are becoming more common, especially when it comes to changing the gut microbiota.
Which Source-based Therapeutic Product is Most Preferred?
“Wide Availability of Bacteria-based Microbial Therapeutic Products in the Market”
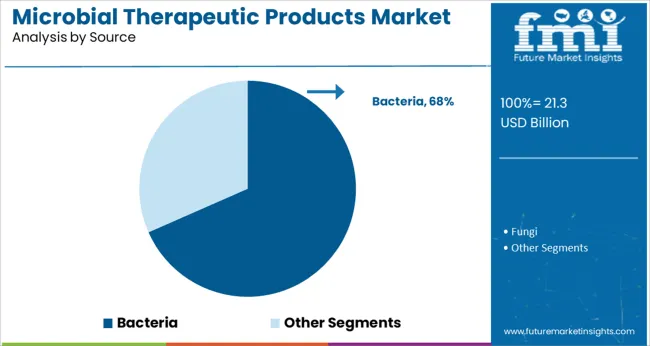
Bacterium-derived microbial therapeutic products are likely to remain profitable due to their widespread availability from various sources. Furthermore, microbes have served as the foundation for the development and manufacture of a variety of therapeutic medications, including antibiotics and vitamins.
Because of their benign nature, the gut microbiota has been a popular bacteria culturing source over time. Intestinal bacteria have proven to be quite beneficial in the treatment of digestive problems and food poisoning. As a result, genetic engineering strategies for extracting them have proliferated in recent years.
Which Microbial Therapeutic Product Application is Most Popular?
“Oncology to Remain Key Application Area of Microbial Therapeutic Products”
Despite significant improvements in cancer treatment, new therapeutic platforms are currently being studied to provide cancer patients with the best possible care. This increased search is projected to result in significant growth potential in the oncology market.
At present, oncology and metabolic disorders are likely to account for 24.2% and 20% of the global market share respectively. While infectious and allergic diseases together are likely to hold 18.8% of the global market share, in 2022.
Bacteriocin antibiotics, enzymes, and peptides, according to research, have a lot of potential for producing anti-cancer medications. Bacteriocins appear to be the most promising candidate for future medication development.
In 2022, haematological disorders and immunological disorders are expected to account for 12.6% and 9.6% of the global market share respectively. The other applications are predicted to hold 14.8% of the global market share currently.
COVID-19 Impact on Market
The COVID-19 pandemic has pushed the market for microbial therapeutics to unprecedented heights. Supportive treatment and complication avoidance are two important therapeutic approaches for the infection.
Healthcare providers are stepping up their efforts to find a permanent cure as soon as possible. With the availability of a large number of vaccines, a breakthrough has already been made.
Over the decade, there will be several excellent chances for global microbial therapeutic solutions. The market is projected to stay good in the long run with proactive respective government backing and adequate financing for COVID-19 medication research.
Competitive Landscape
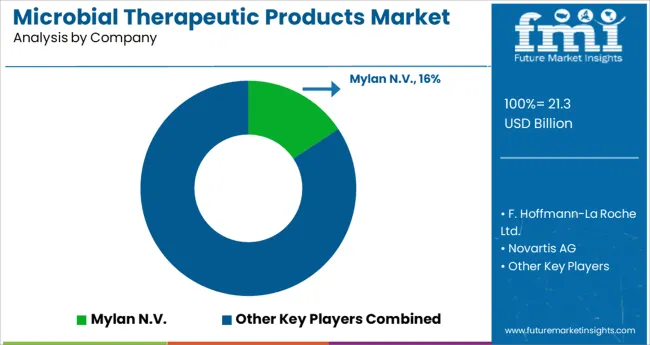
Some of the market players featured in this report are Mylan N.V., F. Hoffmann La-Roche Ltd., Novartis AG, Amgen Inc., Merck & Co. Inc., Biocon, Pfizer Inc., Dr. Reddy’s Laboratories Ltd., Intas Pharmaceuticals Ltd., Novo Nordisk A/S, Eli Lilly and Company, Sanofi S.A., Boehringer Ingelheim, Bristol-Myers Squibb Company, and Abbot Laboratories.
Pfizer Inc., Sanofi S.A., Merck & Co., Amgen Inc., and Novartis AG account for a majority of overall revenue. To commercialize and sell their products, these companies place strong emphasis on collaborative license agreements with other partners.
Furthermore, some market players are concentrating on acquisitions and the launch of biosimilars. Companies are also looking for more favourable regulatory approvals to get into profitable sectors.
- Pfizer Inc., for example, is actively partnering with Merck & Co. to promote oncology research and development. For many years, the alliance has been aimed at advancing the latter's investigational anti-PD-1 treatment medication candidate with two Pfizer oncology assets.
Microbial Therapeutic Products Industry Report Scope
Attribute |
Details |
Forecast Period |
2022-2030 |
Historical Data Available for |
2015-2021 |
Market Analysis |
US$ Bn for Value |
Key Regions Covered |
|
Key Countries Covered |
|
Key Market Segments Covered |
|
Key Companies Profiled |
|
Pricing |
Available upon Request |
Key Segments of Microbial Therapeutic Products Industry Survey
Microbial Therapeutic Products Market by Product:
- Growth Factors
- GCSF
- Peg GCSF
- Exenatide
- Anti-cancer Agents
- Immunosuppressants
- Enzymes
- Others
Microbial Therapeutic Products Market by Route of Administration:
- Single-use Pre-filled Injection/Injector Pens
- Multi-use Injectors
- Others
Microbial Therapeutic Products Market by Source:
- Bacteria
- Fungi
Microbial Therapeutic Products Market by Application:
- Metabolic Disorders
- Haematological Disorders
- Oncology
- Immunological Disorders
- Infectious Diseases
- Allergic Diseases
- Others
Microbial Therapeutic Products Market by End User:
- Hospitals
- Pharmaceuticals & Biopharmaceutical Companies
- Research & Academic Institutions
Microbial Therapeutic Products Market by Region:
- North America Microbial Therapeutic Products Market
- Latin America Microbial Therapeutic Products Market
- Europe Microbial Therapeutic Products Market
- East Asia Microbial Therapeutic Products Market
- South Asia & Pacific Microbial Therapeutic Products Market
- Middle East & Africa (MEA) Microbial Therapeutic Products Market
Frequently Asked Questions
The global microbial therapeutic products market is estimated to progress at a high CAGR of 7.5% through 2030.
The microbial therapeutic products market report is segmented into product, route of application, source, application, end user, and region.
The global market for microbial therapeutic products is currently worth US$ 17.11 Bn, and is anticipated to attain a valuation of US$ 30.55 Bn by 2030.
In 2022, oncology is predicted to account for 24.2% of the global market share.
The North America market is expected to grow at a high rate, thereby being advantageous for microbial therapeutic product producers.
Due to ongoing research & development by top healthcare providers to find a robust treatment candidate for eradicating the current coronavirus outbreak, the COVID-19 pandemic has only contributed to driving the expansion of the microbial therapeutic products market.
Table of Content
1. Executive Summary
1.1. Global Market Outlook
1.2. Demand Side Trends
1.3. Supply Side Trends
1.4. Analysis and Recommendations
2. Market Overview
2.1. Market Coverage / Taxonomy
2.2. Market Definition / Scope / Limitations
2.3. Inclusions and Exclusions
3. Key Market Trends
3.1. Key Trends Impacting the Market
3.2. Key Market Trends: GCSF, PEF-GCSF, Exenatide
3.3. Product Innovation / Development Trends
3.4. COVID19 Crisis Analysis
3.4.1. Current COVID19 Statistics and Probable Future Impact
3.4.2. Current GDP Projection and Probable Impact
3.4.3. Current Economic Projection as compared to 2008 Economic analysis
3.4.4. COVID19 and Impact Analysis
3.4.4.1. Revenue by Product
3.4.4.2. Revenue by Route of Administration
3.4.4.3. Revenue by Source
3.4.4.4. Revenue by Application
3.4.4.5. Revenue by End User
3.4.5. 2022 Market Scenario
3.4.6. Recovery Scenario – Short term, Midterm and Long Term Impact
4. Market Background
4.1. Macro-Economic Factors
4.1.1. Global GDP Growth Outlook
4.1.2. Global Healthcare Outlook
4.2. Forecast Factors - Relevance & Impact
4.2.1. Product Adoption
4.2.2. Product Availability
4.2.3. Product Pricing
4.2.4. Regulatory Framework
4.3. Market Dynamics
4.3.1. Drivers
4.3.2. Restraints
4.3.3. Opportunities
5. Market Context
5.1. Microbial Therapeutic Products Adoption Analysis
5.2. Pipeline Assessment
5.3. Regulatory Landscape – U.S & Europe
5.4. Key Promotional Strategies
5.5. Value Chain Analysis
6. Global Microbial Therapeutic Products Market Value (US$ Mn) Analysis 2015-2021 and Forecast, 2022-2030
6.1. Historical Market Value (US$ Mn) Analysis, 2015-2021
6.2. Current and Future Market Value (US$ Mn) Projections, 2022-2030
6.2.1. Y-o-Y Growth Trend Analysis
6.2.2. Opportunity Analysis, 2022-2030
7. Global Microbial Therapeutic Products Market Analysis 2015-2021 and Forecast 2022-2030, By Product
7.1. Introduction / Key Findings
7.2. Historical Market Size (US$ Mn) Analysis by Product, 2015–2021
7.3. Current and Future Market Size (US$ Mn) Analysis and Forecast by Product, 2022-2030
7.3.1. Growth Factors
7.3.1.1. GCSF
7.3.1.2. PEG-GCSF
7.3.1.3. Exenatide
7.3.2. Anti-cancer Agents
7.3.3. Immuno-Suppressants
7.3.4. Enzymes
7.3.5. Others
7.4. Market Attractiveness Analysis by Product
8. Global Microbial Therapeutic Products Market Analysis 2015-2021 and Forecast 2022-2030, By Route of Administration
8.1. Introduction / Key Findings
8.2. Historical Market Size (US$ Mn) Analysis by Route of Administration, 2015–2021
8.3. Current and Future Market Size (US$ Mn) Analysis and Forecast by Route of Administration, 2022-2030
8.3.1. Single Use Pre-Filled Injection/Route of Administration pen
8.3.2. Multi-use Route of Administrations
8.3.3. Others
8.4. Market Attractiveness Analysis by Route of Administration
9. Global Microbial Therapeutic Products Market Analysis 2015-2021 and Forecast 2022-2030, By Source
9.1. Introduction / Key Findings
9.2. Historical Market Size (US$ Mn) Analysis by Source, 2015–2021
9.3. Current and Future Market Size (US$ Mn) Analysis and Forecast by Source, 2022-2030
9.3.1. Bacteria
9.3.2. Fungi
9.4. Market Attractiveness Analysis by Source
10. Global Microbial Therapeutic Products Market Analysis 2015-2021 and Forecast 2022-2030, By Application
10.1. Introduction / Key Findings
10.2. Historical Market Size (US$ Mn) Analysis by Application, 2015–2021
10.3. Current and Future Market Size (US$ Mn) Analysis and Forecast by Application, 2022-2030
10.3.1. Metabolic Disorders
10.3.2. Hematological Disorders
10.3.3. Oncology
10.3.4. Immunology Disorders
10.3.5. Infectious Diseases
10.3.6. Allergic Disorders
10.3.7. Others
10.4. Market Attractiveness Analysis by Application
11. Global Microbial Therapeutic Products Market Analysis 2015-2021 and Forecast 2022-2030, by End User
11.1. Introduction / Key Findings
11.2. Historical Market Size (US$ Mn) Analysis by End User, 2015–2021
11.3. Current and Future Market Size (US$ Mn) Analysis and Forecast by End User, 2022-2030
11.3.1. Hospitals
11.3.2. Pharmaceutical and Biopharmaceutical Companies
11.3.3. Research and Academic Institutes
11.4. Market Attractiveness Analysis by End User
12. Global Microbial Therapeutic Products Market Analysis 2015-2021 and Forecast 2022-2030, by Region
12.1. Introduction
12.2. Historical Market Size (US$ Mn) Analysis by Region, 2015 - 2021
12.3. Current Market Size (US$ Mn) Analysis and Forecast by Region, 2022 - 2030
12.3.1. North America
12.3.2. Latin America
12.3.3. Europe
12.3.4. East Asia
12.3.5. South Asia
12.3.6. Oceania
12.3.7. Middle East and Africa (MEA)
12.4. Market Attractiveness Analysis by Region
13. North America Microbial Therapeutic Products Market Analysis 2015-2021 and Forecast 2022-2030
13.1. Introduction
13.2. Historical Market Size (US$ Mn) Trend Analysis by Market Taxonomy, 2015 - 2021
13.3. Market Size (US$ Mn) Forecast by Market Taxonomy, 2022 - 2030
13.3.1. By Country
13.3.1.1. U.S.
13.3.1.2. Canada
13.3.2. By Product
13.3.3. By Route of Administration
13.3.4. By Source
13.3.5. By Application
13.3.6. By End User
13.4. Market Attractiveness Analysis
13.5. Key Market Participants - Intensity Mapping
13.6. Drivers and Restraints - Impact Analysis
14. Latin America Microbial Therapeutic Products Market Analysis 2015-2021 and Forecast 2022-2030
14.1. Introduction
14.2. Historical Market Size (US$ Mn) Trend Analysis by Market Taxonomy, 2015 - 2021
14.3. Market Size (US$ Mn) Forecast by Market Taxonomy, 2022 - 2030
14.3.1. By Country
14.3.1.1. Brazil
14.3.1.2. Mexico
14.3.1.3. Argentina
14.3.1.4. Rest of Latin America
14.3.2. By Product
14.3.3. By Route of Administration
14.3.4. By Source
14.3.5. By Application
14.3.6. By End User
14.4. Market Attractiveness Analysis
14.5. Key Market Participants - Intensity Mapping
14.6. Drivers and Restraints - Impact Analysis
15. Europe Microbial Therapeutic Products Market Analysis 2015-2021 and Forecast 2022-2030
15.1. Introduction
15.2. Historical Market Size (US$ Mn) Trend Analysis by Market Taxonomy, 2015 - 2021
15.3. Market Size (US$ Mn) Forecast by Market Taxonomy, 2022 - 2030
15.3.1. By Country
15.3.1.1. Germany
15.3.1.2. Italy
15.3.1.3. France
15.3.1.4. U.K.
15.3.1.5. Spain
15.3.1.6. BENELUX
15.3.1.7. Russia
15.3.1.8. Rest of Europe
15.3.2. By Product
15.3.3. By Route of Administration
15.3.4. By Source
15.3.5. By Application
15.3.6. By End User
15.4. Market Attractiveness Analysis
15.5. Key Market Participants - Intensity Mapping
15.6. Drivers and Restraints - Impact Analysis
16. East Asia Microbial Therapeutic Products Market Analysis 2015-2021 and Forecast 2022-2030
16.1. Introduction
16.2. Historical Market Size (US$ Mn) Trend Analysis by Market Taxonomy, 2015 - 2021
16.3. Market Size (US$ Mn) Forecast by Market Taxonomy, 2022 - 2030
16.3.1. By Country
16.3.1.1. China
16.3.1.2. Japan
16.3.1.3. South Korea
16.3.2. By Product
16.3.3. By Route of Administration
16.3.4. By Source
16.3.5. By Application
16.3.6. By End User
16.4. Market Attractiveness Analysis
16.5. Key Market Participants - Intensity Mapping
16.6. Drivers and Restraints - Impact Analysis
17. South Asia Microbial Therapeutic Products Market Analysis 2015-2021 and Forecast 2022-2030
17.1. Introduction
17.2. Historical Market Size (US$ Mn) Trend Analysis by Market Taxonomy, 2015 - 2021
17.3. Market Size (US$ Mn) Forecast by Market Taxonomy, 2022 - 2030
17.3.1. By Country
17.3.1.1. India
17.3.1.2. Thailand
17.3.1.3. Indonesia
17.3.1.4. Malaysia
17.3.1.5. Rest of South Asia
17.3.2. By Product
17.3.3. By Route of Administration
17.3.4. By Source
17.3.5. By Application
17.3.6. By End User
17.4. Market Attractiveness Analysis
17.5. Key Market Participants - Intensity Mapping
17.6. Drivers and Restraints - Impact Analysis
18. Oceania Microbial Therapeutic Products Market Analysis 2015-2021 and Forecast 2022-2030
18.1. Introduction
18.2. Historical Market Size (US$ Mn) Trend Analysis by Market Taxonomy, 2015 - 2021
18.3. Market Size (US$ Mn) Forecast by Market Taxonomy, 2022 - 2030
18.3.1. By Country
18.3.1.1. Australia
18.3.1.2. New Zealand
18.3.2. By Product
18.3.3. By Route of Administration
18.3.4. By Source
18.3.5. By Application
18.3.6. By End User
18.4. Market Attractiveness Analysis
18.5. Key Market Participants - Intensity Mapping
18.6. Drivers and Restraints - Impact Analysis
19. Middle East and Africa Microbial Therapeutic Products Market Analysis 2015-2021 and Forecast 2022-2030
19.1. Introduction
19.2. Historical Market Size (US$ Mn) Trend Analysis by Market Taxonomy, 2015 - 2021
19.3. Market Size (US$ Mn) Forecast by Market Taxonomy, 2022 - 2030
19.3.1. By Country
19.3.1.1. GCC Countries
19.3.1.2. South Africa
19.3.1.3. Rest of Middle East and Africa
19.3.2. By Product
19.3.3. By Route of Administration
19.3.4. By Source
19.3.5. By Application
19.3.6. By End User
19.4. Market Attractiveness Analysis
19.5. Key Market Participants - Intensity Mapping
19.6. Drivers and Restraints - Impact Analysis
20. Key and Emerging Countries Microbial Therapeutic Products Market Analysis 2015-2021 and Forecast 2022-2030
20.1. Introduction
20.1.1. Market Value Proportion Analysis, By Key Countries
20.1.2. Global Vs. Country Growth Comparison
20.2. U.S. Microbial Therapeutic Products Market Analysis
20.2.1. By Product
20.2.2. By Route of Administration
20.2.3. By Source
20.2.4. By Application
20.2.5. By End User
20.3. Canada Microbial Therapeutic Products Market Analysis
20.3.1. By Product
20.3.2. By Route of Administration
20.3.3. By Source
20.3.4. By Application
20.3.5. By End User
20.4. Mexico Microbial Therapeutic Products Market Analysis
20.4.1. By Product
20.4.2. By Route of Administration
20.4.3. By Source
20.4.4. By Application
20.4.5. By End User
20.5. Brazil Microbial Therapeutic Products Market Analysis
20.5.1. By Product
20.5.2. By Route of Administration
20.5.3. By Source
20.5.4. By Application
20.5.5. By End User
20.6. U.K. Microbial Therapeutic Products Market Analysis
20.6.1. By Product
20.6.2. By Route of Administration
20.6.3. By Source
20.6.4. By Application
20.6.5. By End User
20.7. Germany Microbial Therapeutic Products Market Analysis
20.7.1. By Product
20.7.2. By Route of Administration
20.7.3. By Source
20.7.4. By Application
20.7.5. By End User
20.8. France Microbial Therapeutic Products Market Analysis
20.8.1. By Product
20.8.2. By Route of Administration
20.8.3. By Source
20.8.4. By Application
20.8.5. By End User
20.9. Italy Microbial Therapeutic Products Market Analysis
20.9.1. By Product
20.9.2. By Route of Administration
20.9.3. By Source
20.9.4. By Application
20.9.5. By End User
20.10. Spain Microbial Therapeutic Products Market Analysis
20.10.1. By Product
20.10.2. By Route of Administration
20.10.3. By Source
20.10.4. By Application
20.10.5. By End User
20.11. Russia Microbial Therapeutic Products Market Analysis
20.11.1. By Product
20.11.2. By Route of Administration
20.11.3. By Source
20.11.4. By Application
20.11.5. By End User
20.12. China Microbial Therapeutic Products Market Analysis
20.12.1. By Product
20.12.2. By Route of Administration
20.12.3. By Source
20.12.4. By Application
20.12.5. By End User
20.13. Japan Microbial Therapeutic Products Market Analysis
20.13.1. By Product
20.13.2. By Route of Administration
20.13.3. By Source
20.13.4. By Application
20.13.5. By End User
20.14. South Korea Microbial Therapeutic Products Market Analysis
20.14.1. By Product
20.14.2. By Route of Administration
20.14.3. By Source
20.14.4. By Application
20.14.5. By End User
20.15. India Microbial Therapeutic Products Market Analysis
20.15.1. By Product Type
20.15.2. By Ergonomics
20.15.3. By Channel
20.15.4. By Application
20.15.5. By End User
20.16. ASEAN Microbial Therapeutic Products Market Analysis
20.16.1. By Product
20.16.2. By Route of Administration
20.16.3. By Source
20.16.4. By Application
20.16.5. By End User
20.17. Australia Microbial Therapeutic Products Market Analysis
20.17.1. By Product
20.17.2. By Route of Administration
20.17.3. By Source
20.17.4. By Application
20.17.5. By End User
20.18. New Zealand Microbial Therapeutic Products Market Analysis
20.18.1. By Product
20.18.2. By Route of Administration
20.18.3. By Source
20.18.4. By Application
20.18.5. By End User
20.19. GCC Countries Microbial Therapeutic Products Market Analysis
20.19.1. By Product
20.19.2. By Route of Administration
20.19.3. By Source
20.19.4. By Application
20.19.5. By End User
20.20. Turkey Microbial Therapeutic Products Market Analysis
20.20.1. By Product
20.20.2. By Route of Administration
20.20.3. By Source
20.20.4. By Application
20.20.5. By End User
20.21. South Africa Microbial Therapeutic Products Market Analysis
20.21.1. By Product
20.21.2. By Route of Administration
20.21.3. By Source
20.21.4. By Application
20.21.5. By End User
21. Market Structure Analysis
21.1. Market Analysis by Tier of Companies
21.2. Market Share Analysis of Top Players
21.3. Market Share Analysis by Top Brands
21.4. Market Presence Analysis
21.4.1. Regional Footprint by Players
21.4.2. Product Foot print by Players
21.4.3. Channel Foot Print by Players
22. Competition Analysis
22.1. Competition Dashboard
22.2. Competition Deep Dive (Tentative List)
22.2.1. Mylan N.V.
22.2.1.1. Overview
22.2.1.2. Product Portfolio
22.2.1.3. Profitability by Market Segments (Product/Source/Application/Region)
22.2.1.4. Sales Footprint
22.2.1.5. Strategy Overview
22.2.1.5.1. Marketing Strategy
22.2.1.5.2. Product Strategy
22.2.1.5.3. Channel Strategy
22.2.2. F. Hoffmann-La Roche Ltd.
22.2.2.1. Overview
22.2.2.2. Product Portfolio
22.2.2.3. Profitability by Market Segments (Product/Source/Application/Region)
22.2.2.4. Sales Footprint
22.2.2.5. Strategy Overview
22.2.2.5.1. Marketing Strategy
22.2.2.5.2. Product Strategy
22.2.2.5.3. Channel Strategy
22.2.3. Novartis AG
22.2.3.1. Overview
22.2.3.2. Product Portfolio
22.2.3.3. Profitability by Market Segments (Product/Source/Application/Region)
22.2.3.4. Sales Footprint
22.2.3.5. Strategy Overview
22.2.3.5.1. Marketing Strategy
22.2.3.5.2. Product Strategy
22.2.3.5.3. Channel Strategy
22.2.4. Amgen Inc.
22.2.4.1. Overview
22.2.4.2. Product Portfolio
22.2.4.3. Profitability by Market Segments (Product/Source/Application/Region)
22.2.4.4. Sales Footprint
22.2.4.5. Strategy Overview
22.2.4.5.1. Marketing Strategy
22.2.4.5.2. Product Strategy
22.2.4.5.3. Channel Strategy
22.2.5. Merck & Co. Inc.
22.2.5.1. Overview
22.2.5.2. Product Portfolio
22.2.5.3. Profitability by Market Segments (Product/Source/Application/Region)
22.2.5.4. Sales Footprint
22.2.5.5. Strategy Overview
22.2.5.5.1. Marketing Strategy
22.2.5.5.2. Product Strategy
22.2.5.5.3. Channel Strategy
22.2.6. Biocon
22.2.6.1. Overview
22.2.6.2. Product Portfolio
22.2.6.3. Profitability by Market Segments (Product/Source/Application/Region)
22.2.6.4. Sales Footprint
22.2.6.5. Strategy Overview
22.2.6.5.1. Marketing Strategy
22.2.6.5.2. Product Strategy
22.2.6.5.3. Channel Strategy
22.2.7. Pfizer Inc.
22.2.7.1. Overview
22.2.7.2. Product Portfolio
22.2.7.3. Profitability by Market Segments (Product/Source/Application/Region)
22.2.7.4. Sales Footprint
22.2.7.5. Strategy Overview
22.2.7.5.1. Marketing Strategy
22.2.7.5.2. Product Strategy
22.2.7.5.3. Channel Strategy
22.2.8. Dr. Reddy’s Laboratories Ltd.
22.2.8.1. Overview
22.2.8.2. Product Portfolio
22.2.8.3. Profitability by Market Segments (Product/Source/Application/Region)
22.2.8.4. Sales Footprint
22.2.8.5. Strategy Overview
22.2.8.5.1. Marketing Strategy
22.2.8.5.2. Product Strategy
22.2.8.5.3. Channel Strategy
22.2.9. Intas Pharmaceuticals Ltd.
22.2.9.1. Overview
22.2.9.2. Product Portfolio
22.2.9.3. Profitability by Market Segments (Product/Source/Application/Region)
22.2.9.4. Sales Footprint
22.2.9.5. Strategy Overview
22.2.9.5.1. Marketing Strategy
22.2.9.5.2. Product Strategy
22.2.9.5.3. Channel Strategy
22.2.10. Novo Nordisk A/S
22.2.10.1. Overview
22.2.10.2. Product Portfolio
22.2.10.3. Profitability by Market Segments (Product/Source/Application/Region)
22.2.10.4. Sales Footprint
22.2.10.5. Strategy Overview
22.2.10.5.1. Marketing Strategy
22.2.10.5.2. Product Strategy
22.2.10.5.3. Channel Strategy
22.2.11. Eli Lilly and Company
22.2.11.1. Overview
22.2.11.2. Product Portfolio
22.2.11.3. Profitability by Market Segments (Product/Source/Application/Region)
22.2.11.4. Sales Footprint
22.2.11.5. Strategy Overview
22.2.11.5.1. Marketing Strategy
22.2.11.5.2. Product Strategy
22.2.11.5.3. Channel Strategy
22.2.12. Sanofi S.A.
22.2.12.1. Overview
22.2.12.2. Product Portfolio
22.2.12.3. Profitability by Market Segments (Product/Source/Application/Region)
22.2.12.4. Sales Footprint
22.2.12.5. Strategy Overview
22.2.12.5.1. Marketing Strategy
22.2.12.5.2. Product Strategy
22.2.12.5.3. Channel Strategy
22.2.13. Boehringer Ingelheim
22.2.13.1. Overview
22.2.13.2. Product Portfolio
22.2.13.3. Profitability by Market Segments (Product/Source/Application/Region)
22.2.13.4. Sales Footprint
22.2.13.5. Strategy Overview
22.2.13.5.1. Marketing Strategy
22.2.13.5.2. Product Strategy
22.2.13.5.3. Channel Strategy
22.2.14. Bristol-Myers Squibb Company
22.2.14.1. Overview
22.2.14.2. Product Portfolio
22.2.14.3. Profitability by Market Segments (Product/Source/Application/Region)
22.2.14.4. Sales Footprint
22.2.14.5. Strategy Overview
22.2.14.5.1. Marketing Strategy
22.2.14.5.2. Product Strategy
22.2.14.5.3. Channel Strategy
22.2.15. Abbott Laboratories
22.2.15.1. Overview
22.2.15.2. Product Portfolio
22.2.15.3. Profitability by Market Segments (Product/Source/Application/Region)
22.2.15.4. Sales Footprint
22.2.15.5. Strategy Overview
22.2.15.5.1. Marketing Strategy
22.2.15.5.2. Product Strategy
22.2.15.5.3. Channel Strategy
23. Assumptions and Acronyms Used
24. Research Methodology
Let us know your requirement to get
100% FREE customization
List of Tables
Table 01: Global Microbial Therapeutic Products Market Value (US$ Mn) Analysis and Opportunity Assessment 2015–2030, By Product
Table 02: Global Microbial Therapeutic Products Market Value (US$ Mn) Analysis and Opportunity Assessment 2015–2030, By Route of Administration
Table 03: Global Microbial Therapeutic Products Market Value (US$ Mn) Analysis and Opportunity Assessment 2015–2030, By Source
Table 04: Global Microbial Therapeutic Products Market Value (US$ Mn) Analysis and Opportunity Assessment 2015–2030, By Application
Table 05: Global Microbial Therapeutic Products Market Value (US$ Mn) Analysis and Opportunity Assessment 2015–2030, By End User
Table 06: Global Microbial Therapeutic Products Market Value (US$ Mn) Analysis 2015–2021 and Forecast 2022–2030 By Region
Table 07: North America Microbial Therapeutic Products Market Size (US$ Mn) Analysis 2015–2021 and Forecast 2022–2030, By Country
Table 08: North America Microbial Therapeutic Products Market Value (US$ Mn) Analysis and Opportunity Assessment 2015–2030, By Product
Table 09: North America Microbial Therapeutic Products Market Value (US$ Mn) Analysis and Opportunity Assessment 2015–2030, By Route of Administration
Table 10: North America Microbial Therapeutic Products Market Value (US$ Mn) Analysis and Opportunity Assessment 2015–2030, By Source
Table 11: North America Microbial Therapeutic Products Market Value (US$ Mn) Analysis and Opportunity Assessment 2015–2030, By Application
Table 12: North America Microbial Therapeutic Products Market Value (US$ Mn) Analysis and Opportunity Assessment 2015–2030, By End User
Table 13: Latin America Microbial Therapeutic Products Market Size (US$ Mn) Analysis 2015–2021 and Forecast 2022–2030, By Country
Table 14: Latin America Microbial Therapeutic Products Market Value (US$ Mn) Analysis and Opportunity Assessment 2015–2030, By Product
Table 15: Latin America Microbial Therapeutic Products Market Value (US$ Mn) Analysis and Opportunity Assessment 2015–2030, By Route of Administration
Table 16: Latin America Microbial Therapeutic Products Market Value (US$ Mn) Analysis and Opportunity Assessment 2015–2030, By Source
Table 17: Latin America Microbial Therapeutic Products Market Value (US$ Mn) Analysis and Opportunity Assessment 2015–2030, By Application
Table 18: Latin America Microbial Therapeutic Products Market Value (US$ Mn) Analysis and Opportunity Assessment 2015–2030, By End User
Table 19: Europe Microbial Therapeutic Products Market Size (US$ Mn) Analysis 2015–2021 and Forecast 2022–2030, By Country
Table 20: Europe Microbial Therapeutic Products Market Value (US$ Mn) Analysis and Opportunity Assessment 2015–2030, By Product
Table 21: Europe America Microbial Therapeutic Products Market Value (US$ Mn) Analysis and Opportunity Assessment 2015–2030, By Route of Administration
Table 22: Europe Microbial Therapeutic Products Market Value (US$ Mn) Analysis and Opportunity Assessment 2015–2030, By Source
Table 23: Europe Microbial Therapeutic Products Market Value (US$ Mn) Analysis and Opportunity Assessment 2015–2030, By Application
Table 24: Europe Microbial Therapeutic Products Market Value (US$ Mn) Analysis and Opportunity Assessment 2015–2030, By End User
Table 25: East Asia Microbial Therapeutic Products Market Size (US$ Mn) Analysis 2015–2021 and Forecast 2022–2030, By Country
Table 26: East Asia Microbial Therapeutic Products Market Value (US$ Mn) Analysis and Opportunity Assessment 2015–2030, By Product
Table 27: East Asia America Microbial Therapeutic Products Market Value (US$ Mn) Analysis and Opportunity Assessment 2015–2030, By Route of Administration
Table 28: East Asia Microbial Therapeutic Products Market Value (US$ Mn) Analysis and Opportunity Assessment 2015–2030, By Source
Table 29: East Asia Microbial Therapeutic Products Market Value (US$ Mn) Analysis and Opportunity Assessment 2015–2030, By Application
Table 30: East Asia Microbial Therapeutic Products Market Value (US$ Mn) Analysis and Opportunity Assessment 2015–2030, By End User
Table 31: South Asia Microbial Therapeutic Products Market Size (US$ Mn) Analysis 2015–2021 and Forecast 2022–2030, By Country
Table 32: South Asia Microbial Therapeutic Products Market Value (US$ Mn) Analysis and Opportunity Assessment 2015–2030, By Product
Table 33: South Asia America Microbial Therapeutic Products Market Value (US$ Mn) Analysis and Opportunity Assessment 2015–2030, By Route of Administration
Table 34: South Asia Microbial Therapeutic Products Market Value (US$ Mn) Analysis and Opportunity Assessment 2015–2030, By Source
Table 35: South Asia Microbial Therapeutic Products Market Value (US$ Mn) Analysis and Opportunity Assessment 2015–2030, By Application
Table 36: South Asia Microbial Therapeutic Products Market Value (US$ Mn) Analysis and Opportunity Assessment 2015–2030, By End User
Table 37: Oceania Microbial Therapeutic Products Market Size (US$ Mn) Analysis 2015–2021 and Forecast 2022–2030, By Country
Table 38: Oceania Microbial Therapeutic Products Market Value (US$ Mn) Analysis and Opportunity Assessment 2015–2030, By Product
Table 39: Oceania America Microbial Therapeutic Products Market Value (US$ Mn) Analysis and Opportunity Assessment 2015–2030, By Route of Administration
Table 40: Oceania Microbial Therapeutic Products Market Value (US$ Mn) Analysis and Opportunity Assessment 2015–2030, By Source
Table 41: Oceania Microbial Therapeutic Products Market Value (US$ Mn) Analysis and Opportunity Assessment 2015–2030, By Application
Table 42: Oceania Microbial Therapeutic Products Market Value (US$ Mn) Analysis and Opportunity Assessment 2015–2030, By End User
Table 43: MEA Microbial Therapeutic Products Market Size (US$ Mn) Analysis 2015–2021 and Forecast 2022–2030, By Country
Table 44: MEA Microbial Therapeutic Products Market Value (US$ Mn) Analysis and Opportunity Assessment 2015–2030, By Product
Table 45: MEA America Microbial Therapeutic Products Market Value (US$ Mn) Analysis and Opportunity Assessment 2015–2030, By Route of Administration
Table 46: MEA Microbial Therapeutic Products Market Value (US$ Mn) Analysis and Opportunity Assessment 2015–2030, By Source
Table 47: MEA Microbial Therapeutic Products Market Value (US$ Mn) Analysis and Opportunity Assessment 2015–2030, By Application
Table 48: MEA Microbial Therapeutic Products Market Value (US$ Mn) Analysis and Opportunity Assessment 2015–2030, By End User
Find your sweet spots for generating winning opportunities in this market.
Talk to AnalystList of Charts
Figure 01: Global Microbial Therapeutic Products Market Value Analysis (US$ Mn), 2015-2021
Figure 02: Global Microbial Therapeutic Products Market Value Forecast (US$ Mn), 2022-2030
Figure 03: Global Microbial Therapeutic Products Market Absolute $ Opportunity, 2021 - 2030
Figure 04: Global Microbial Therapeutic Products Market Share Analysis (%), By Product, 2022 & 2030
Figure 05: Global Microbial Therapeutic Products Market Y-o-Y Analysis (%), By Product, 2022-2030
Figure 06: Global Microbial Therapeutic Products Market Attractiveness Analysis by Product Type, 2022-2030
Figure 07: Global Microbial Therapeutic Products Market Share Analysis (%), By Route of Administration, 2022 & 2030
Figure 08: Global Microbial Therapeutic Products Market Y-o-Y Analysis (%), By Route of Administration, 2022-2030
Figure 09: Global Microbial Therapeutic Products Market Attractiveness Analysis by Route of Administration, 2022-2030
Figure 10: Global Microbial Therapeutic Products Market Share Analysis (%), By Source, 2022 & 2030
Figure 11: Global Microbial Therapeutic Products Market Y-o-Y Analysis (%), By Source, 2022-2030
Figure 12: Global Microbial Therapeutic Products Market Attractiveness Analysis by Source, 2022-2030
Figure 13: Global Microbial Therapeutic Products Market Share Analysis (%), By Application, 2022 & 2030
Figure 14: Global Microbial Therapeutic Products Market Y-o-Y Analysis (%), By Application, 2022-2030
Figure 15: Global Microbial Therapeutic Products Market Attractiveness Analysis by Application, 2022-2030
Figure 16: Global Microbial Therapeutic Products Market Share Analysis (%), By End User, 2022 & 2030
Figure 17: Global Microbial Therapeutic Products Market Y-o-Y Analysis (%), By End User, 2022-2030
Figure 18: Global Microbial Therapeutic Products Market Attractiveness Analysis by End User, 2022-2030
Figure 19: Global Microbial Therapeutic Products Market Share Analysis (%) By Region, 2022 & 2030
Figure 20: Global Microbial Therapeutic Products Market Y-o-Y Growth (%) By Region, 2022–2030
Figure 21: Global Microbial Therapeutic Products Market Attractiveness Analysis by Region, 2022–2030
Figure 22: North America Microbial Therapeutic Products Market Value Share, By Country (2021)
Figure 23: North America Microbial Therapeutic Products Market Value Share, By Product Type (2021)
Figure 24: North America Microbial Therapeutic Products Market Value Share, By Route of Administration (2021)
Figure 25: North America Microbial Therapeutic Products Market Value Share, By Source
Figure 26: North America Microbial Therapeutic Products Market Value Share, By Application
Figure 27: North America Microbial Therapeutic Products Market Value Share, By End User
Figure 28: North America Microbial Therapeutic Products Market Value Analysis (US$ Mn), 2015–2021
Figure 29: North America Microbial Therapeutic Products Market Value Forecast (US$ Mn), 2022–2030
Figure 30: North America Microbial Therapeutic Products Market Attractiveness Analysis by Country, 2022–2030
Figure 31: North America Microbial Therapeutic Products Market Attractiveness Analysis by Product, 2022–2030
Figure 32: North America Microbial Therapeutic Products Market Attractiveness Analysis by Route of Administration, 2022–2030
Figure 33: North America Microbial Therapeutic Products Market Attractiveness Analysis by Source, 2022–2030
Figure 34: North America Microbial Therapeutic Products Market Attractiveness Analysis by Application, 2022–2030
Figure 35: North America Microbial Therapeutic Products Market Attractiveness Analysis by End User, 2022–2030
Figure 36: Latin America Microbial Therapeutic Products Market Value Share, By Country (2021)
Figure 37: Latin America Microbial Therapeutic Products Market Value Share, By Product Type (2021)
Figure 38: Latin America Microbial Therapeutic Products Market Value Share, By Route of Administration (2021)
Figure 39: Latin America Microbial Therapeutic Products Market Value Share, By Source
Figure 40: Latin America Microbial Therapeutic Products Market Value Share, By Application
Figure 41: Latin America Microbial Therapeutic Products Market Value Share, By End User
Figure 42: Latin America Microbial Therapeutic Products Market Value Analysis (US$ Mn), 2015–2021
Figure 43: Latin America Microbial Therapeutic Products Market Value Forecast (US$ Mn), 2022–2030
Figure 44: Latin America Microbial Therapeutic Products Market Attractiveness Analysis by Country, 2022–2030
Figure 45: Latin America Microbial Therapeutic Products Market Attractiveness Analysis by Product, 2022–2030
Figure 46: Latin America Microbial Therapeutic Products Market Attractiveness Analysis by Route of Administration, 2022–2030
Figure 47: Latin America Microbial Therapeutic Products Market Attractiveness Analysis by Source, 2022–2030
Figure 48: Latin America Microbial Therapeutic Products Market Attractiveness Analysis by Application, 2022–2030
Figure 49: Latin America Microbial Therapeutic Products Market Attractiveness Analysis by End User, 2022–2030
Figure 50: Europe Microbial Therapeutic Products Market Value Share, By Country (2021)
Figure 51: Europe Microbial Therapeutic Products Market Value Share, By Product Type (2021)
Figure 52: Europe Microbial Therapeutic Products Market Value Share, By Route of Administration (2021)
Figure 53: Europe Microbial Therapeutic Products Market Value Share, By Source
Figure 54: Europe Microbial Therapeutic Products Market Value Share, By Application
Figure 55: Europe Microbial Therapeutic Products Market Value Share, By End User
Figure 56: Europe Microbial Therapeutic Products Market Value Analysis (US$ Mn), 2015–2021
Figure 57: Europe Microbial Therapeutic Products Market Value Forecast (US$ Mn), 2022–2030
Figure 58: Europe Microbial Therapeutic Products Market Attractiveness Analysis by Country, 2022–2030
Figure 59: Europe Microbial Therapeutic Products Market Attractiveness Analysis by Product, 2022–2030
Figure 60: Europe Microbial Therapeutic Products Market Attractiveness Analysis by Route of Administration, 2022–2030
Figure 61: Europe Microbial Therapeutic Products Market Attractiveness Analysis by Source, 2022–2030
Figure 62: Europe Microbial Therapeutic Products Market Attractiveness Analysis by Application, 2022–2030
Figure 63: Europe Microbial Therapeutic Products Market Attractiveness Analysis by End User, 2022–2030
Figure 64: East Asia Microbial Therapeutic Products Market Value Share, By Country (2021)
Figure 65: East Asia Microbial Therapeutic Products Market Value Share, By Product Type (2021)
Figure 66: East Asia Microbial Therapeutic Products Market Value Share, By Route of Administration (2021)
Figure 67: East Asia Microbial Therapeutic Products Market Value Share, By Source
Figure 68: East Asia Microbial Therapeutic Products Market Value Share, By Application
Figure 69: East Asia Microbial Therapeutic Products Market Value Share, By End User
Figure 70: East Asia Microbial Therapeutic Products Market Value Analysis (US$ Mn), 2015–2021
Figure 71: East Asia Microbial Therapeutic Products Market Value Forecast (US$ Mn), 2022–2030
Figure 72: East Asia Microbial Therapeutic Products Market Attractiveness Analysis by Country, 2022–2030
Figure 73: East Asia Microbial Therapeutic Products Market Attractiveness Analysis by Product, 2022–2030
Figure 74: East Asia Microbial Therapeutic Products Market Attractiveness Analysis by Route of Administration, 2022–2030
Figure 75: East Asia Microbial Therapeutic Products Market Attractiveness Analysis by Source, 2022–2030
Figure 76: East Asia Microbial Therapeutic Products Market Attractiveness Analysis by Application, 2022–2030
Figure 77: East Asia Microbial Therapeutic Products Market Attractiveness Analysis by End User, 2022–2030
Figure 78: South Asia Microbial Therapeutic Products Market Value Share, By Country (2021)
Figure 79: South Asia Microbial Therapeutic Products Market Value Share, By Product Type (2021)
Figure 80: South Asia Microbial Therapeutic Products Market Value Share, By Route of Administration (2021)
Figure 81: South Asia Microbial Therapeutic Products Market Value Share, By Source
Figure 82: South Asia Microbial Therapeutic Products Market Value Share, By Application
Figure 83: South Asia Microbial Therapeutic Products Market Value Share, By End User
Figure 84: South Asia Microbial Therapeutic Products Market Value Analysis (US$ Mn), 2015–2021
Figure 85: South Asia Microbial Therapeutic Products Market Value Forecast (US$ Mn), 2022–2030
Figure 86: South Asia Microbial Therapeutic Products Market Attractiveness Analysis by Country, 2022–2030
Figure 87: South Asia Microbial Therapeutic Products Market Attractiveness Analysis by Product, 2022–2030
Figure 88: South Asia Microbial Therapeutic Products Market Attractiveness Analysis by Route of Administration, 2022–2030
Figure 89: South Asia Microbial Therapeutic Products Market Attractiveness Analysis by Source, 2022–2030
Figure 90: South Asia Microbial Therapeutic Products Market Attractiveness Analysis by Application, 2022–2030
Figure 91: South Asia Microbial Therapeutic Products Market Attractiveness Analysis by End User, 2022–2030
Figure 92: Oceania Microbial Therapeutic Products Market Value Share, By Country (2021)
Figure 93: Oceania Microbial Therapeutic Products Market Value Share, By Product Type (2021)
Figure 94: Oceania Microbial Therapeutic Products Market Value Share, By Route of Administration (2021)
Figure 95: Oceania Microbial Therapeutic Products Market Value Share, By Source
Figure 96: Oceania Microbial Therapeutic Products Market Value Share, By Application
Figure 97: Oceania Microbial Therapeutic Products Market Value Share, By End User
Figure 98: Oceania Microbial Therapeutic Products Market Value Analysis (US$ Mn), 2015–2021
Figure 99: Oceania Microbial Therapeutic Products Market Value Forecast (US$ Mn), 2022–2030
Figure 100: Oceania Microbial Therapeutic Products Market Attractiveness Analysis by Country, 2022–2030
Figure 101: Oceania Microbial Therapeutic Products Market Attractiveness Analysis by Product, 2022–2030
Figure 102: Oceania Microbial Therapeutic Products Market Attractiveness Analysis by Route of Administration, 2022–2030
Figure 103: Oceania Microbial Therapeutic Products Market Attractiveness Analysis by Source, 2022–2030
Figure 104: Oceania Microbial Therapeutic Products Market Attractiveness Analysis by Application, 2022–2030
Figure 105: Oceania Microbial Therapeutic Products Market Attractiveness Analysis by End User, 2022–2030
Figure 106: MEA Microbial Therapeutic Products Market Value Share, By Country (2021)
Figure 107: MEA Microbial Therapeutic Products Market Value Share, By Product Type (2021)
Figure 108: MEA Microbial Therapeutic Products Market Value Share, By Route of Administration (2021)
Figure 109: MEA Microbial Therapeutic Products Market Value Share, By Source
Figure 110: MEA Microbial Therapeutic Products Market Value Share, By Application
Figure 111: MEA Microbial Therapeutic Products Market Value Share, By End User
Figure 112: MEA Microbial Therapeutic Products Market Value Analysis (US$ Mn), 2015–2021
Figure 113: MEA Microbial Therapeutic Products Market Value Forecast (US$ Mn), 2022–2030
Figure 114: MEA Microbial Therapeutic Products Market Attractiveness Analysis by Country, 2022–2030
Figure 115: MEA Microbial Therapeutic Products Market Attractiveness Analysis by Product, 2022–2030
Figure 116: MEA Microbial Therapeutic Products Market Attractiveness Analysis by Route of Administration, 2022–2030
Figure 117: MEA Microbial Therapeutic Products Market Attractiveness Analysis by Source, 2022–2030
Figure 118: MEA Microbial Therapeutic Products Market Attractiveness Analysis by Application, 2022–2030
Figure 119: MEA Microbial Therapeutic Products Market Attractiveness Analysis by End User, 2022–2030
Figure 120: U.S Microbial Therapeutic Products Market Share Analysis (%), By Product Type, 2022 &2030
Figure 121: U.S Microbial Therapeutic Products Market Share Analysis (%), By Route of Administration, 2022 &2030
Figure 122: U.S Microbial Therapeutic Products Market Share Analysis (%), By Source, 2022 &2030
Figure 123: U.S Microbial Therapeutic Products Market Share Analysis (%), By Application, 2022 &2030
Figure 124: U.S Microbial Therapeutic Products Market Share Analysis (%), By End User, 2022 &2030
Figure 125: Global Vs. U.S Growth Comparison
Figure 126: Canada Microbial Therapeutic Products Market Share Analysis (%), By Product Type, 2022 &2030
Figure 127: Canada Microbial Therapeutic Products Market Share Analysis (%), By Route of Administration, 2022 &2030
Figure 128: Canada Microbial Therapeutic Products Market Share Analysis (%), By Source, 2022 &2030
Figure 129: Canada Microbial Therapeutic Products Market Share Analysis (%), By Application, 2022 &2030
Figure 130: Canada Microbial Therapeutic Products Market Share Analysis (%), By End User, 2022 &2030
Figure 131: Global Vs. Canada Growth Comparison
Figure 132: Mexico Microbial Therapeutic Products Market Share Analysis (%), By Product Type, 2022 &2030
Figure 133: Mexico Microbial Therapeutic Products Market Share Analysis (%), By Route of Administration, 2022 &2030
Figure 134: Mexico Microbial Therapeutic Products Market Share Analysis (%), By Source, 2022 &2030
Figure 135: Mexico Microbial Therapeutic Products Market Share Analysis (%), By Application, 2022 &2030
Figure 136: Mexico Microbial Therapeutic Products Market Share Analysis (%), By End User, 2022 &2030
Figure 137: Global Vs. Mexico Growth Comparison
Figure 138: Brazil Microbial Therapeutic Products Market Share Analysis (%), By Product Type, 2022 &2030
Figure 139: Brazil Microbial Therapeutic Products Market Share Analysis (%), By Route of Administration, 2022 &2030
Figure 140: Brazil Microbial Therapeutic Products Market Share Analysis (%), By Source, 2022 &2030
Figure 141: Brazil Microbial Therapeutic Products Market Share Analysis (%), By Application, 2022 &2030
Figure 142: Brazil Microbial Therapeutic Products Market Share Analysis (%), By End User, 2022 &2030
Figure 143: Global Vs. Brazil Growth Comparison
Figure 144: U.K. Microbial Therapeutic Products Market Share Analysis (%), By Product Type, 2022 &2030
Figure 145: U.K. Microbial Therapeutic Products Market Share Analysis (%), By Route of Administration, 2022 &2030
Figure 146: U.K. Microbial Therapeutic Products Market Share Analysis (%), By Source, 2022 &2030
Figure 147: U.K. Microbial Therapeutic Products Market Share Analysis (%), By Application, 2022 &2030
Figure 148: U.K. Microbial Therapeutic Products Market Share Analysis (%), By End User, 2022 &2030
Figure 149: Global Vs. U.K. Growth Comparison
Figure 150: Germany Microbial Therapeutic Products Market Share Analysis (%), By Product Type, 2022 &2030
Figure 151: Germany Microbial Therapeutic Products Market Share Analysis (%), By Route of Administration, 2022 &2030
Figure 152: Germany Microbial Therapeutic Products Market Share Analysis (%), By Source, 2022 &2030
Figure 153: Germany Microbial Therapeutic Products Market Share Analysis (%), By Application, 2022 &2030
Figure 154: Germany Microbial Therapeutic Products Market Share Analysis (%), By End User, 2022 &2030
Figure 155: Global Vs Germany Growth Comparison
Figure 156: France Microbial Therapeutic Products Market Share Analysis (%), By Product Type, 2022 &2030
Figure 157: France Microbial Therapeutic Products Market Share Analysis (%), By Route of Administration, 2022 &2030
Figure 158: France Microbial Therapeutic Products Market Share Analysis (%), By Source, 2022 &2030
Figure 159: France Microbial Therapeutic Products Market Share Analysis (%), By Application, 2022 &2030
Figure 160: France Microbial Therapeutic Products Market Share Analysis (%), By End User, 2022 &2030
Figure 161: Global Vs France Growth Comparison
Figure 162: Italy Microbial Therapeutic Products Market Share Analysis (%), By Product Type, 2022 &2030
Figure 163: Italy Microbial Therapeutic Products Market Share Analysis (%), By Route of Administration, 2022 &2030
Figure 164: Italy Microbial Therapeutic Products Market Share Analysis (%), By Source, 2022 &2030
Figure 165: Italy Microbial Therapeutic Products Market Share Analysis (%), By Application, 2022 &2030
Figure 166: Italy Microbial Therapeutic Products Market Share Analysis (%), By End User, 2022 &2030
Figure 167: Global Vs Italy Growth Comparison
Figure 168: Spain Microbial Therapeutic Products Market Share Analysis (%), By Product Type, 2022 &2030
Figure 169: Spain Microbial Therapeutic Products Market Share Analysis (%), By Route of Administration, 2022 &2030
Figure 170: Spain Microbial Therapeutic Products Market Share Analysis (%), By Source, 2022 &2030
Figure 171: Spain Microbial Therapeutic Products Market Share Analysis (%), By Application, 2022 &2030
Figure 172: Spain Microbial Therapeutic Products Market Share Analysis (%), By End User, 2022 &2030
Figure 173: Global Vs Spain Growth Comparison
Figure 174: Russia Microbial Therapeutic Products Market Share Analysis (%), By Product Type, 2022 &2030
Figure 175: Russia Microbial Therapeutic Products Market Share Analysis (%), By Route of Administration, 2022 &2030
Figure 176: Russia Microbial Therapeutic Products Market Share Analysis (%), By Source, 2022 &2030
Figure 177: Russia Microbial Therapeutic Products Market Share Analysis (%), By Application, 2022 &2030
Figure 178: Russia Microbial Therapeutic Products Market Share Analysis (%), By End User, 2022 &2030
Figure 179: Global Vs Russia Growth Comparison
Figure 180: China Microbial Therapeutic Products Market Share Analysis (%), By Product Type, 2022 &2030
Figure 181: China Microbial Therapeutic Products Market Share Analysis (%), By Route of Administration, 2022 &2030
Figure 182: China Microbial Therapeutic Products Market Share Analysis (%), By Source, 2022 &2030
Figure 183: China Microbial Therapeutic Products Market Share Analysis (%), By Application, 2022 &2030
Figure 184: China Microbial Therapeutic Products Market Share Analysis (%), By End User, 2022 &2030
Figure 185: Global Vs China Growth Comparison
Figure 186: Japan Microbial Therapeutic Products Market Share Analysis (%), By Product Type, 2022 &2030
Figure 187: Japan Microbial Therapeutic Products Market Share Analysis (%), By Route of Administration, 2022 &2030
Figure 188: Japan Microbial Therapeutic Products Market Share Analysis (%), By Source, 2022 &2030
Figure 189: Japan Microbial Therapeutic Products Market Share Analysis (%), By Application, 2022 &2030
Figure 190: Japan Microbial Therapeutic Products Market Share Analysis (%), By End User, 2022 &2030
Figure 191: Global Vs Japan Growth Comparison
Figure 192: South Korea Microbial Therapeutic Products Market Share Analysis (%), By Product Type, 2022 &2030
Figure 193: South Korea Microbial Therapeutic Products Market Share Analysis (%), By Route of Administration, 2022 &2030
Figure 194: South Korea Microbial Therapeutic Products Market Share Analysis (%), By Source, 2022 &2030
Figure 195: South Korea Microbial Therapeutic Products Market Share Analysis (%), By Application, 2022 &2030
Figure 196: South Korea Microbial Therapeutic Products Market Share Analysis (%), By End User, 2022 &2030
Figure 197: Global Vs South Korea Growth Comparison
Figure 198: India Microbial Therapeutic Products Market Share Analysis (%), By Product Type, 2022 &2030
Figure 199: India Microbial Therapeutic Products Market Share Analysis (%), By Route of Administration, 2022 &2030
Figure 200: India Microbial Therapeutic Products Market Share Analysis (%), By Source, 2022 &2030
Figure 201: India Microbial Therapeutic Products Market Share Analysis (%), By Application, 2022 &2030
Figure 202: India Microbial Therapeutic Products Market Share Analysis (%), By End User, 2022 &2030
Figure 203: Global Vs India Growth Comparison
Figure 204: Thailand Microbial Therapeutic Products Market Share Analysis (%), By Product Type, 2022 &2030
Figure 205: Thailand Microbial Therapeutic Products Market Share Analysis (%), By Route of Administration, 2022 &2030
Figure 206: Thailand Microbial Therapeutic Products Market Share Analysis (%), By Source, 2022 &2030
Figure 207: Thailand Microbial Therapeutic Products Market Share Analysis (%), By Application, 2022 &2030
Figure 208: Thailand Microbial Therapeutic Products Market Share Analysis (%), By End User, 2022 &2030
Figure 209: Global Vs Thailand Growth Comparison
Figure 210: Malaysia Microbial Therapeutic Products Market Share Analysis (%), By Product Type, 2022 &2030
Figure 211: Malaysia Microbial Therapeutic Products Market Share Analysis (%), By Route of Administration, 2022 &2030
Figure 212: Malaysia Microbial Therapeutic Products Market Share Analysis (%), By Source, 2022 &2030
Figure 213: Malaysia Microbial Therapeutic Products Market Share Analysis (%), By Application, 2022 &2030
Figure 214: Malaysia Microbial Therapeutic Products Market Share Analysis (%), By End User, 2022 &2030
Figure 215: Global Vs Malaysia Growth Comparison
Figure 216: Indonesia Microbial Therapeutic Products Market Share Analysis (%), By Product Type, 2022 &2030
Figure 217: Indonesia Microbial Therapeutic Products Market Share Analysis (%), By Route of Administration, 2022 &2030
Figure 218: Indonesia Microbial Therapeutic Products Market Share Analysis (%), By Source, 2022 &2030
Figure 219: Indonesia Microbial Therapeutic Products Market Share Analysis (%), By Application, 2022 &2030
Figure 220: Indonesia Microbial Therapeutic Products Market Share Analysis (%), By End User, 2022 &2030
Figure 221: Global Vs Indonesia Growth Comparison
Figure 222: Australia Microbial Therapeutic Products Market Share Analysis (%), By Product Type, 2022 &2030
Figure 223: Australia Microbial Therapeutic Products Market Share Analysis (%), By Route of Administration, 2022 &2030
Figure 224: Australia Microbial Therapeutic Products Market Share Analysis (%), By Source, 2022 &2030
Figure 225: Australia Microbial Therapeutic Products Market Share Analysis (%), By Application, 2022 &2030
Figure 226: Australia Microbial Therapeutic Products Market Share Analysis (%), By End User, 2022 &2030
Figure 227: Global Vs Australia Growth Comparison
Figure 228: New Zealand Microbial Therapeutic Products Market Share Analysis (%), By Product Type, 2022 &2030
Figure 229: New Zealand Microbial Therapeutic Products Market Share Analysis (%), By Route of Administration, 2022 &2030
Figure 230: New Zealand Microbial Therapeutic Products Market Share Analysis (%), By Source, 2022 &2030
Figure 231: New Zealand Microbial Therapeutic Products Market Share Analysis (%), By Application, 2022 &2030
Figure 232: New Zealand Microbial Therapeutic Products Market Share Analysis (%), By End User, 2022 &2030
Figure 233: Global Vs New Zealand Growth Comparison
Figure 234: GCC Countries Microbial Therapeutic Products Market Share Analysis (%), By Product Type, 2022 &2030
Figure 235: GCC Countries Microbial Therapeutic Products Market Share Analysis (%), By Route of Administration, 2022 &2030
Figure 236: GCC Countries Microbial Therapeutic Products Market Share Analysis (%), By Source, 2022 &2030
Figure 237: GCC Countries Microbial Therapeutic Products Market Share Analysis (%), By Application, 2022 &2030
Figure 238: GCC Countries Microbial Therapeutic Products Market Share Analysis (%), By End User, 2022 &2030
Figure 239: Global Vs GCC Countries Growth Comparison
Figure 240: Turkey Microbial Therapeutic Products Market Share Analysis (%), By Product Type, 2022 &2030
Figure 241: Turkey Microbial Therapeutic Products Market Share Analysis (%), By Route of Administration, 2022 &2030
Figure 242: Turkey Microbial Therapeutic Products Market Share Analysis (%), By Source, 2022 &2030
Figure 243: Turkey Microbial Therapeutic Products Market Share Analysis (%), By Application, 2022 &2030
Figure 244: Turkey Microbial Therapeutic Products Market Share Analysis (%), By End User, 2022 &2030
Figure 245: Global Vs Turkey Growth Comparison
Figure 246: South Africa Microbial Therapeutic Products Market Share Analysis (%), By Product Type, 2022 &2030
Figure 247: South Africa Microbial Therapeutic Products Market Share Analysis (%), By Route of Administration, 2022 &2030
Figure 248: South Africa Microbial Therapeutic Products Market Share Analysis (%), By Source, 2022 &2030
Figure 249: South Africa Microbial Therapeutic Products Market Share Analysis (%), By Application, 2022 &2030
Figure 250: South Africa Microbial Therapeutic Products Market Share Analysis (%), By End User, 2022 &2030
Figure 251: Global Vs South Africa Growth Comparison
Need specific information?
Request CustomizationExplore Healthcare Insights
View Reports