Reports

- Global Locations -

Headquarters

Future Market Insights, Inc.

Christiana Corporate, 200
Continental Drive, Suite 401,
Newark, Delaware - 19713,
United States

T: +1-845-579-5705

Americas

Future Market Insights, Inc.

616 Corporate Way, Suite 2-9018,
Valley Cottage, NY 10989, United States

T: +1-347-918-3531

MEA

Future Market Insights

1602-6 Jumeirah Bay X2 Tower, Plot No: JLT-PH2-X2A,
Jumeirah Lakes Towers, Dubai,
United Arab Emirates

Europe

Future Market Insights

3rd Floor, 207 Regent Street,
W1B 3HH London
United Kingdom

T: + 44 (0) 20 8123 9659
D: +44 (0) 20 3287 4268

Asia Pacific

Future Market Insights

IndiaLand Global Tech Park, Unit UG-1, Behind Grand HighStreet, Phase 1, Hinjawadi, MH, Pune – 411057, India

Hematology Diagnostics Market Outlook (2023 to 2033)

The hematology diagnostic market is estimated to be valued at US$ 780.0 million in 2023 and is rising to US$ 2.0 billion by 2033. The market is estimated to register a CAGR of 9.9% during the forecast period. Various factors influencing the market include:

  • The rising number of blood disorders and cancer is expected to increase the adoption of hematology diagnostics during the forecast period.
  • The increasing prevalence of chronic, acute, and infectious diseases is accelerating the demand for hematology diagnostics.
  • Rising advanced technology and research & development activities are surging the hematology diagnostics market opportunities.
  • The increasing adoption of artificial intelligence integrated with flow cytometry and telehealth propels the market growth.
  • Rising healthcare infrastructure and growing patient population for several blood disorders such as thalassemia, anemia, and sickle cell.
  • The growing awareness, improved efficiency, and standardized diagnostics drive market opportunities during the forecast period.
  • Increasing adoption of point-of-care diagnostics in the medical diagnostic sector to reduce time and provide accurate results drives market share.
  • Increasing adoption of high-tech and non-invasive hematology devices.
Attributes Details
Market CAGR (2023 to 2033) 9.9%
Market Valuation (2023) US$ 780 million
Market Valuation (2033) US$ 2.0 billion

Don't pay for what you don't need

Customize your report by selecting specific countries or regions and save 30%!

Factors Limiting the Market Growth

The rising costs of hematology diagnostic and novel diagnostic procedures are limiting the market growth as people in low and middle-income countries find it difficult to receive expensive treatment, whereas lack of awareness may also restrict the market growth.

The rapidly growing blood diseases, related disorders, and infections such as blood clots, anemia, cancer, and hemophilia are driving market expansion. A report published by Bristol-Myers Squibb stated that nearly one million cases of blood cancer were recorded globally in 2020. Additionally, rising hemoglobinopathies disorder may increase the market growth during the forecast period.

Increased Automation Surge the Market Opportunities

The adoption of automation in hematology diagnostics to improve efficiency and standardize processes are rising market opportunity. Various diagnostic laboratories accept automation processes to collect samples, avail quick results, and recognition tests, and reduce administrative errors. These factors are estimated to increase the demand for automated hematology diagnostics during the forecast period.

Sabyasachi Ghosh
Sabyasachi Ghosh

Principal Consultant

Talk to Analyst

Find your sweet spots for generating winning opportunities in this market.

Hematology Diagnostics Market, 2017 to 2022 Historical Sales, Compared from 2023 to 2033 Future Outlook

According to Future Market Insights, the global hematology diagnostics market is projected at a healthy CAGR of 9.9% during the forecast period. Historically, the market registered a CAGR of 11.8% between 2017 and 2022.

The market changes as per the product adoption rates and device regulations under the macro and industrial dynamics. The key developments in the market include complete lab automation for hematology diagnostics. With the fourth wave of technology and automation around the globe, the market has been positively influenced by total laboratory automation strategies.

  • Short-term (2023 to 2026): The rising prevalence of blood diseases such as cancer, blood clot, infections, and others are increasing the demand for hematology diagnostics.
  • Med-term (2026 to 2029): The increasing advanced technology, government initiatives, and healthcare infrastructure propelling market growth.
  • Long-term (2029 to 2033): Growing novel technology and automation in hematology diagnostics to improve the efficiency of testing and treatment, driving market opportunities.

The market is estimated to reach US$ 2.0 billion during the forecast period. In the historical period, the market stood at a valuation of US$ 700 million from 2017 to 2022.

Comparative Analysis of Adjacent Markets

Hematology Diagnostics Market:

Attributes Hematology Diagnostics Market
CAGR (2023 to 2033) 9.9%
Value (2023) US$ 780 million
Value (2033) US$ 2.0 billion
Trends Increasing chronic, blood disorders, acute, and infectious diseases
Opportunities Growing awareness, improved efficiency, standardized diagnostics, and government initiatives

Molecular Diagnostics Market:

Attributes Molecular Diagnostics Market
CAGR (2023 to 2033) 9.8%
Value (2023) US$ 12.18 billion
Value (2033) US$ 31.02 billion
Trends Rising demand for (Polymerase chain reaction) PCR-based techniques and monitoring response
Opportunities The stringent regulations, rising awareness, and innovative techniques

Clinical Diagnostics Market:

Attributes Clinical Diagnostics Market
CAGR (2023 to 2033) 7%
Value (2023) US$ 80.27 billion
Value (2033) US$ 157.90 billion
Trends Rising bacteria, fungal and viral diseases increase the adoption of clinical diagnostics
Opportunities Increasing product approval, research & development activities, and adoption of point-of-care clinical diagnostics

Get the data you need at a Fraction of the cost

Personalize your report by choosing insights you need
and save 40%!

Top Two Segment in the Market

Segments Kit Type
Top Category Blood Typing Kits
Historic CAGR 11.2%
Forecast CAGR 9.4%
Segments Modality
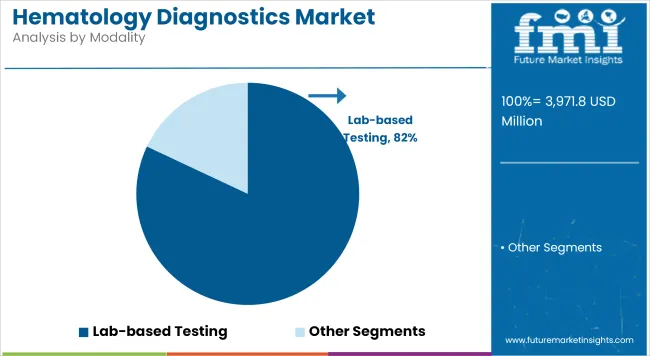
Top Category Lab-based Testing
Historic CAGR 11%
Forecast CAGR 9.1%

Which Distribution Channel is Expected to be Lucrative?

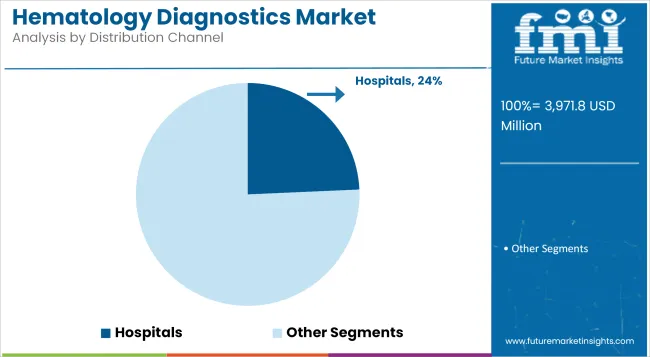
The hospital segment holds a dominant market share and is predicted to maintain this stance during the forecast period. However, the diagnostic laboratories segment is expected to experience rapid growth over the forecast period owing to an increase in diagnostic centers. The increasing availability of advanced diagnostic instruments and devices and the demand for hospitals propel market growth.

Blood Typing Kits are the Preferred Category in the Kit Type Segment

Based on kit type, blood typing kits lead the global market by securing a CAGR of 9.4% during the forecast period. The rising demand for blood typing kits to perform blood tests easier and quicker and identify blood types. This segment contributes a huge revenue in the general healthcare routine and in discovering diseases which may drive market expansion.

The blood typing kits check various tests such as iron deficiency, allergy, vitamins, and anemia propel market opportunities. Historically, the blood typing kits captured a CAGR of 11.2% between 2017 and 2022.

Top Countries Data Table Mentioned Below

Country United States
AGR (2017 to 2022) 11.5%
AGR (2023 to 2023) 9.7%
Valuation (2023 to 2033) US$ 708.6 million
Country United Kingdom
AGR (2017 to 2022) 10.5%
AGR (2023 to 2023) 8.9%
Valuation (2023 to 2033) US$ 84.2 million
Country China
AGR (2017 to 2022) 11.1%
AGR (2023 to 2023) 9.3%
Valuation (2023 to 2033) US$ 143.5 million
Country Japan
AGR (2017 to 2022) 10.0%
AGR (2023 to 2023) 8.4%
Valuation (2023 to 2033) US$ 117.3 million
Country South Korea
AGR (2017 to 2022) 8.6%
AGR (2023 to 2023) 7.6%
Valuation (2023 to 2033) US$ 69 million

How is the Market Expected to Perform in the USA?

Rising Incidence of Blood Cancer to Boost Hematology Diagnostics Demand!

The USA is securing a CAGR of 9.7% with a valuation of US$ 708.6 million during the forecast period. The USA has seen a spike in the incidence of blood cancer in recent years, and it is expected to increase in the coming years. Due to high technological proliferation, the USA hematology diagnostics market is expected to provide lucrative opportunities.

The presence of developed healthcare infrastructure and high research and development activity is predicted to flourish the USA market during the forecast period. Historically, the USA market captured a CAGR of 11.5% between 2017 and 2022.

Increasing Focus on Healthcare to Positively Impact South Korea Hematology Diagnostics Market

South Korea registers a CAGR of 7.6% with a valuation of US$ 69 million during the forecast period. Focus on healthcare has bolstered in recent years in South Korea, creating many opportunities for healthcare diagnostic providers. The nation is also experiencing a surge in blood disorders and incidences of blood cancer. These factors are propelling the South Korean market during the forecast period. Historically, the market secured a CAGR of 8.6% between 2017 and 2022.

Growing Research and Development Activities Boost United Kingdom Market Growth

The United Kingdom's hematology diagnostics market is anticipated to hold a CAGR of 8.9%, with a valuation of US$ 84.2 million during the forecast period. The rising prevalence of blood cancer and the presence of key hematology diagnostics companies are expected to be key factors propelling the market growth.

The rising research & development and government initiatives to boost awareness for hematology diagnostics are driving the United Kingdom market. The increasing prevalence of blood disorders, healthcare, and rising instances of genetic blood disorders are expected to propel the United Kingdom market.

Rising investments in healthcare infrastructure and new market entrance are anticipated to promote the market potential in this region. Historically, the United Kingdom market secured a CAGR of 10.5% between 2017 and 2022.

Improvement in Therapy Products Enhance the Performance of China Market

The China hematology diagnostics market is anticipated to hold a CAGR of 9.3% with a valuation of US$ 143.5 million during the forecast period. Increasing healthcare infrastructure, urbanization, and improvement in diagnostic therapy products are driving the China market.

Rising government regulations and increasing initiatives to generate awareness are anticipated to boost market growth during the forecast period. Historically, China secured a CAGR of 11.1% between 2017 and 2022.

Competitive Landscape

Hematology diagnostic providers are investing in the research & development of novel diagnostic solutions to enhance their market presence and boost revenue. Hematology diagnostic companies also focus on establishing new centers to deploy novel diagnostic solutions.

Healthcare manufacturers are developing various automation devices to reduce the workload and provide efficient results. Key players are conducting extensive research on the market and carrying out several marketing strategies to upsurge the market. Moreover, market players are involved in innovating new products and expanding distribution networks in the coming years.

Other Prominent Players in the Market are

  • Meyland Smith A/S
  • Abbot Laboratories
  • Bio-Rad Laboratories
  • Sysmex Corporation
  • Mindray Medical International Limited
  • Siemens Healthlineers
  • F. Hoffman-La Roche Ltd.
  • HORIBA Ltd.
  • HemoCue AB
  • Danaher (Beckman Coulter Inc.)
  • Nihon Kohden Corporation
  • EKF Diagnostics
  • Ortho Clinical Diagnostics
  • Drew Scientific

Recent Development in the Market

  • In October 2021, Suburban Diagnostics, a leading medical diagnostics industry, announced the launch of the Centre of Excellence in Hematology. The new establishment provides research support and training in diagnostic procedures for multiple common and uncommon hematological disorders.
  • In Apr 2022, Sysmex Corporation launched its new systems, including XQ-320 and XQ-Series. These systems are automated and equipped with a multi-feature to meet the requirement of healthcare laboratories.
  • In Mar 2022, Mindray, a healthcare device developer, launched its latest BC-700 series. This hematology analyzer series can incorporate erythrocyte sedimentation rate and complete blood count tests.

Scope of Report

Attribute Details
Forecast Period 2023 to 2033
Historical Data 2017 to 2022
Market Analysis US$ billion for Value
Key Countries Covered United States, Canada, Germany, United Kingdom, France, Italy, Spain, Russia, China, Japan, South Korea, India, Thailand, Malaysia, Indonesia, Australia, New Zealand, GCC Countries, Northern Africa, and South Africa, Türkiye
Key Segments Covered
  • Kit Type
  • Modality
  • Distribution Channel
  • Region
Key Companies Profiled
  • Meyland Smith A/S
  • Abbot Laboratories
  • Bio-Rad Laboratories
  • Sysmex Corporation
  • Mindray Medical International Limited
  • Siemens Healthlineers
  • F. Hoffman-La Roche Ltd.
  • HORIBA Ltd.
  • HemoCue AB
  • Danaher (Beckman Coulter Inc.)
  • Nihon Kohden Corporation
  • EKF Diagnostics
  • Ortho Clinical Diagnostics
  • Drew Scientific
Report Coverage Market Forecast, Company Share Analysis, Competition Intelligence, Drivers, Restraints, Opportunities and Threats Analysis, Market Dynamics and Challenges, and Strategic Growth Initiatives
Customization & Pricing Available upon Request

Hematology Diagnostics Market by Category

By Kit Type:

  • Anemia and Iron Test Kits
  • Folic Acid Testing Kits
  • Sickle Cell Screening Kits
  • PT/INR Testing Kits
  • D-dimer Testing Kits
  • Blood Typing Kits
  • Leukemia Testing Kits
  • Sepsis Testing Kits
  • Antibiotics Resistance Panels
  • Bacterial & Fungal Panels

By Modality:

  • Point of Care
  • Lab-based Testing

By Distribution Channel:

  • Hospitals
  • Diagnostic Laboratories
  • Cancer Research Institutes
  • Retail Pharmacies
  • Drug Store
  • Online Sales Channels

By Region:

  • North America
  • Latin America
  • Europe
  • South Asia & Pacific
  • East Asia
  • Middle East & Africa (MEA)

Frequently Asked Questions

What is the Revenue generating Capacity of the Global Hematology Diagnostics Market?

The global hematology diagnostics market might create a revenue of around US$ 780 million in 2023.

Which is the Leading Regional Market for Adoption of Hematology Diagnostics Services?

In the United States the net worth of the total hematology diagnostics adopted by 2033 could be US$ 708.6 million.

Which is the Largest Regional Market for Hematology Diagnostics in Asia Pacific Region?

China is the leading market and the regional demand is expected to grow at 9.3% CAGR until 2033.

Based on Kit Type, Which Segment Dominates the Overall Hematology Diagnostics Market?

The blood typing kits segment dominated and is forecasted to register 9.4% CAGR through 2033.

What was the Historical Growth Rate in Global Adoption of Hematology Diagnostics Services?

Between 2017 and 2022, the global demand for hematology diagnostics services surged at 11.8%.

Table of Content

1. Executive Summary | Hematology Diagnostics Market

    1.1. Global Market Outlook

    1.2. Demand-side Trends

    1.3. Supply-side Trends

    1.4. Technology Roadmap Analysis

    1.5. Analysis and Recommendations

2. Market Overview

    2.1. Market Coverage / Taxonomy

    2.2. Market Definition / Scope / Limitations

3. Market Background

    3.1. Market Dynamics

        3.1.1. Drivers

        3.1.2. Restraints

        3.1.3. Opportunity

        3.1.4. Trends

    3.2. Scenario Forecast

        3.2.1. Demand in Optimistic Scenario

        3.2.2. Demand in Likely Scenario

        3.2.3. Demand in Conservative Scenario

    3.3. Opportunity Map Analysis

    3.4. Product Life Cycle Analysis

    3.5. Supply Chain Analysis

        3.5.1. Supply Side Participants and their Roles

            3.5.1.1. Producers

            3.5.1.2. Mid-Level Participants (Traders/ Agents/ Brokers)

            3.5.1.3. Wholesalers and Distributors

        3.5.2. Value Added and Value Created at Node in the Supply Chain

        3.5.3. List of Raw Material Suppliers

        3.5.4. List of Existing and Potential Buyers

    3.6. Investment Feasibility Matrix

    3.7. Value Chain Analysis

        3.7.1. Profit Margin Analysis

        3.7.2. Wholesalers and Distributors

        3.7.3. Retailers

    3.8. PESTLE and Porter’s Analysis

    3.9. Regulatory Landscape

        3.9.1. By Key Regions

        3.9.2. By Key Countries

    3.10. Regional Parent Market Outlook

    3.11. Production and Consumption Statistics

    3.12. Import and Export Statistics

4. Global Market Analysis 2017 to 2022 and Forecast, 2023 to 2033

    4.1. Historical Market Size Value (US$ million) & Volume (Units) Analysis, 2017 to 2022

    4.2. Current and Future Market Size Value (US$ million) & Volume (Units) Projections, 2023 to 2033

        4.2.1. Y-o-Y Growth Trend Analysis

        4.2.2. Absolute $ Opportunity Analysis

5. Global Market Analysis 2017 to 2022 and Forecast 2023 to 2033, By Kit Type

    5.1. Introduction / Key Findings

    5.2. Historical Market Size Value (US$ million) & Volume (Units) Analysis By Kit Type, 2017 to 2022

    5.3. Current and Future Market Size Value (US$ million) & Volume (Units) Analysis and Forecast By Kit Type, 2023 to 2033

        5.3.1. Anemia and Iron Test Kits

        5.3.2. Folic Acid Testing Kits

        5.3.3. Sickle Cell Screening Kits

        5.3.4. PT/INR Testing Kits

        5.3.5. D-dimer Testing Kits

        5.3.6. Blood Typing Kits

        5.3.7. Leukemia Testing Kits

        5.3.8. Sepsis Testing Kits

        5.3.9. Antibiotic Resistance Panels

        5.3.10. Bacterial & Fungal Panels

    5.4. Y-o-Y Growth Trend Analysis By Kit Type, 2017 to 2022

    5.5. Absolute $ Opportunity Analysis By Kit Type, 2023 to 2033

6. Global Market Analysis 2017 to 2022 and Forecast 2023 to 2033, By Modality

    6.1. Introduction / Key Findings

    6.2. Historical Market Size Value (US$ million) & Volume (Units) Analysis By Modality, 2017 to 2022

    6.3. Current and Future Market Size Value (US$ million) & Volume (Units) Analysis and Forecast By Modality, 2023 to 2033

        6.3.1. Point of Care

        6.3.2. Lab-based Testing

    6.4. Y-o-Y Growth Trend Analysis By Modality, 2017 to 2022

    6.5. Absolute $ Opportunity Analysis By Modality, 2023 to 2033

7. Global Market Analysis 2017 to 2022 and Forecast 2023 to 2033, By Distribution Channel

    7.1. Introduction / Key Findings

    7.2. Historical Market Size Value (US$ million) & Volume (Units) Analysis By Distribution Channel, 2017 to 2022

    7.3. Current and Future Market Size Value (US$ million) & Volume (Units) Analysis and Forecast By Distribution Channel, 2023 to 2033

        7.3.1. Hospitals

        7.3.2. Diagnostic Laboratories

        7.3.3. Cancer Research Institutes

        7.3.4. Retail Pharmacies

        7.3.5. Drug Store

        7.3.6. Online Sales Channels

    7.4. Y-o-Y Growth Trend Analysis By Distribution Channel, 2017 to 2022

    7.5. Absolute $ Opportunity Analysis By Distribution Channel, 2023 to 2033

8. Global Market Analysis 2017 to 2022 and Forecast 2023 to 2033, By Region

    8.1. Introduction

    8.2. Historical Market Size Value (US$ million) & Volume (Units) Analysis By Region, 2017 to 2022

    8.3. Current Market Size Value (US$ million) & Volume (Units) Analysis and Forecast By Region, 2023 to 2033

        8.3.1. North America

        8.3.2. Latin America

        8.3.3. Europe

        8.3.4. East Asia

        8.3.5. South Asia & Pacific

        8.3.6. Middle East and Africa (MEA)

    8.4. Market Attractiveness Analysis By Region

9. North America Market Analysis 2017 to 2022 and Forecast 2023 to 2033, By Country

    9.1. Historical Market Size Value (US$ million) & Volume (Units) Trend Analysis By Market Taxonomy, 2017 to 2022

    9.2. Market Size Value (US$ million) & Volume (Units) Forecast By Market Taxonomy, 2023 to 2033

        9.2.1. By Country

            9.2.1.1. United States of America

            9.2.1.2. Canada

        9.2.2. By Kit Type

        9.2.3. By Modality

        9.2.4. By Distribution Channel

    9.3. Market Attractiveness Analysis

        9.3.1. By Country

        9.3.2. By Kit Type

        9.3.3. By Modality

        9.3.4. By Distribution Channel

    9.4. Key Takeaways

10. Latin America Market Analysis 2017 to 2022 and Forecast 2023 to 2033, By Country

    10.1. Historical Market Size Value (US$ million) & Volume (Units) Trend Analysis By Market Taxonomy, 2017 to 2022

    10.2. Market Size Value (US$ million) & Volume (Units) Forecast By Market Taxonomy, 2023 to 2033

        10.2.1. By Country

            10.2.1.1. Brazil

            10.2.1.2. Mexico

            10.2.1.3. Rest of Latin America

        10.2.2. By Kit Type

        10.2.3. By Modality

        10.2.4. By Distribution Channel

    10.3. Market Attractiveness Analysis

        10.3.1. By Country

        10.3.2. By Kit Type

        10.3.3. By Modality

        10.3.4. By Distribution Channel

    10.4. Key Takeaways

11. Europe Market Analysis 2017 to 2022 and Forecast 2023 to 2033, By Country

    11.1. Historical Market Size Value (US$ million) & Volume (Units) Trend Analysis By Market Taxonomy, 2017 to 2022

    11.2. Market Size Value (US$ million) & Volume (Units) Forecast By Market Taxonomy, 2023 to 2033

        11.2.1. By Country

            11.2.1.1. Germany

            11.2.1.2. United Kingdom

            11.2.1.3. Spain

            11.2.1.4. France

            11.2.1.5. Italy

            11.2.1.6. Rest Of Europe

        11.2.2. By Kit Type

        11.2.3. By Modality

        11.2.4. By Distribution Channel

    11.3. Market Attractiveness Analysis

        11.3.1. By Country

        11.3.2. By Kit Type

        11.3.3. By Modality

        11.3.4. By Distribution Channel

    11.4. Key Takeaways

12. East Asia Market Analysis 2017 to 2022 and Forecast 2023 to 2033, By Country

    12.1. Historical Market Size Value (US$ million) & Volume (Units) Trend Analysis By Market Taxonomy, 2017 to 2022

    12.2. Market Size Value (US$ million) & Volume (Units) Forecast By Market Taxonomy, 2023 to 2033

        12.2.1. By Country

            12.2.1.1. China

            12.2.1.2. Japan

            12.2.1.3. South Korea

        12.2.2. By Kit Type

        12.2.3. By Modality

        12.2.4. By Distribution Channel

    12.3. Market Attractiveness Analysis

        12.3.1. By Country

        12.3.2. By Kit Type

        12.3.3. By Modality

        12.3.4. By Distribution Channel

    12.4. Key Takeaways

13. South Asia & Pacific Market Analysis 2017 to 2022 and Forecast 2023 to 2033, By Country

    13.1. Historical Market Size Value (US$ million) & Volume (Units) Trend Analysis By Market Taxonomy, 2017 to 2022

    13.2. Market Size Value (US$ million) & Volume (Units) Forecast By Market Taxonomy, 2023 to 2033

        13.2.1. By Country

            13.2.1.1. Malaysia

            13.2.1.2. Singapore

            13.2.1.3. Philipinnes

            13.2.1.4. Indonesia

            13.2.1.5. Australia

            13.2.1.6. New Zealand

            13.2.1.7. Rest of South Asia & Pacific

        13.2.2. By Kit Type

        13.2.3. By Modality

        13.2.4. By Distribution Channel

    13.3. Market Attractiveness Analysis

        13.3.1. By Country

        13.3.2. By Kit Type

        13.3.3. By Modality

        13.3.4. By Distribution Channel

    13.4. Key Takeaways

14. MEA Market Analysis 2017 to 2022 and Forecast 2023 to 2033, By Country

    14.1. Historical Market Size Value (US$ million) & Volume (Units) Trend Analysis By Market Taxonomy, 2017 to 2022

    14.2. Market Size Value (US$ million) & Volume (Units) Forecast By Market Taxonomy, 2023 to 2033

        14.2.1. By Country

            14.2.1.1. GCC Countries

            14.2.1.2. Turkey

            14.2.1.3. South Africa

            14.2.1.4. Rest of MEA

        14.2.2. By Kit Type

        14.2.3. By Modality

        14.2.4. By Distribution Channel

    14.3. Market Attractiveness Analysis

        14.3.1. By Country

        14.3.2. By Kit Type

        14.3.3. By Modality

        14.3.4. By Distribution Channel

    14.4. Key Takeaways

15. Key Countries Market Analysis

    15.1. United States of America

        15.1.1. Pricing Analysis

        15.1.2. Market Share Analysis, 2022

            15.1.2.1. By Kit Type

            15.1.2.2. By Modality

            15.1.2.3. By Distribution Channel

    15.2. Canada

        15.2.1. Pricing Analysis

        15.2.2. Market Share Analysis, 2022

            15.2.2.1. By Kit Type

            15.2.2.2. By Modality

            15.2.2.3. By Distribution Channel

    15.3. Brazil

        15.3.1. Pricing Analysis

        15.3.2. Market Share Analysis, 2022

            15.3.2.1. By Kit Type

            15.3.2.2. By Modality

            15.3.2.3. By Distribution Channel

    15.4. Mexico

        15.4.1. Pricing Analysis

        15.4.2. Market Share Analysis, 2022

            15.4.2.1. By Kit Type

            15.4.2.2. By Modality

            15.4.2.3. By Distribution Channel

    15.5. Germany

        15.5.1. Pricing Analysis

        15.5.2. Market Share Analysis, 2022

            15.5.2.1. By Kit Type

            15.5.2.2. By Modality

            15.5.2.3. By Distribution Channel

    15.6. United Kingdom

        15.6.1. Pricing Analysis

        15.6.2. Market Share Analysis, 2022

            15.6.2.1. By Kit Type

            15.6.2.2. By Modality

            15.6.2.3. By Distribution Channel

    15.7. Spain

        15.7.1. Pricing Analysis

        15.7.2. Market Share Analysis, 2022

            15.7.2.1. By Kit Type

            15.7.2.2. By Modality

            15.7.2.3. By Distribution Channel

    15.8. France

        15.8.1. Pricing Analysis

        15.8.2. Market Share Analysis, 2022

            15.8.2.1. By Kit Type

            15.8.2.2. By Modality

            15.8.2.3. By Distribution Channel

    15.9. Italy

        15.9.1. Pricing Analysis

        15.9.2. Market Share Analysis, 2022

            15.9.2.1. By Kit Type

            15.9.2.2. By Modality

            15.9.2.3. By Distribution Channel

    15.10. China

        15.10.1. Pricing Analysis

        15.10.2. Market Share Analysis, 2022

            15.10.2.1. By Kit Type

            15.10.2.2. By Modality

            15.10.2.3. By Distribution Channel

    15.11. Japan

        15.11.1. Pricing Analysis

        15.11.2. Market Share Analysis, 2022

            15.11.2.1. By Kit Type

            15.11.2.2. By Modality

            15.11.2.3. By Distribution Channel

    15.12. South Korea

        15.12.1. Pricing Analysis

        15.12.2. Market Share Analysis, 2022

            15.12.2.1. By Kit Type

            15.12.2.2. By Modality

            15.12.2.3. By Distribution Channel

    15.13. Malaysia

        15.13.1. Pricing Analysis

        15.13.2. Market Share Analysis, 2022

            15.13.2.1. By Kit Type

            15.13.2.2. By Modality

            15.13.2.3. By Distribution Channel

    15.14. Singapore

        15.14.1. Pricing Analysis

        15.14.2. Market Share Analysis, 2022

            15.14.2.1. By Kit Type

            15.14.2.2. By Modality

            15.14.2.3. By Distribution Channel

    15.15. Philipinnes

        15.15.1. Pricing Analysis

        15.15.2. Market Share Analysis, 2022

            15.15.2.1. By Kit Type

            15.15.2.2. By Modality

            15.15.2.3. By Distribution Channel

    15.16. Indonesia

        15.16.1. Pricing Analysis

        15.16.2. Market Share Analysis, 2022

            15.16.2.1. By Kit Type

            15.16.2.2. By Modality

            15.16.2.3. By Distribution Channel

    15.17. Australia

        15.17.1. Pricing Analysis

        15.17.2. Market Share Analysis, 2022

            15.17.2.1. By Kit Type

            15.17.2.2. By Modality

            15.17.2.3. By Distribution Channel

    15.18. New Zealand

        15.18.1. Pricing Analysis

        15.18.2. Market Share Analysis, 2022

            15.18.2.1. By Kit Type

            15.18.2.2. By Modality

            15.18.2.3. By Distribution Channel

    15.19. GCC Countries

        15.19.1. Pricing Analysis

        15.19.2. Market Share Analysis, 2022

            15.19.2.1. By Kit Type

            15.19.2.2. By Modality

            15.19.2.3. By Distribution Channel

    15.20. Turkey

        15.20.1. Pricing Analysis

        15.20.2. Market Share Analysis, 2022

            15.20.2.1. By Kit Type

            15.20.2.2. By Modality

            15.20.2.3. By Distribution Channel

    15.21. South Africa

        15.21.1. Pricing Analysis

        15.21.2. Market Share Analysis, 2022

            15.21.2.1. By Kit Type

            15.21.2.2. By Modality

            15.21.2.3. By Distribution Channel

16. Market Structure Analysis

    16.1. Competition Dashboard

    16.2. Competition Benchmarking

    16.3. Market Share Analysis of Top Players

        16.3.1. By Regional

        16.3.2. By Kit Type

        16.3.3. By Modality

        16.3.4. By Distribution Channel

17. Competition Analysis

    17.1. Competition Deep Dive

        17.1.1. Meyland Smith A/S

            17.1.1.1. Overview

            17.1.1.2. Product Portfolio

            17.1.1.3. Profitability by Market Segments

            17.1.1.4. Sales Footprint

            17.1.1.5. Strategy Overview

                17.1.1.5.1. Marketing Strategy

                17.1.1.5.2. Product Strategy

                17.1.1.5.3. Channel Strategy

        17.1.2. Abbot Laboratories

            17.1.2.1. Overview

            17.1.2.2. Product Portfolio

            17.1.2.3. Profitability by Market Segments

            17.1.2.4. Sales Footprint

            17.1.2.5. Strategy Overview

                17.1.2.5.1. Marketing Strategy

                17.1.2.5.2. Product Strategy

                17.1.2.5.3. Channel Strategy

        17.1.3. Bio-Rad Laboratories

            17.1.3.1. Overview

            17.1.3.2. Product Portfolio

            17.1.3.3. Profitability by Market Segments

            17.1.3.4. Sales Footprint

            17.1.3.5. Strategy Overview

                17.1.3.5.1. Marketing Strategy

                17.1.3.5.2. Product Strategy

                17.1.3.5.3. Channel Strategy

        17.1.4. Sysmex Corporation

            17.1.4.1. Overview

            17.1.4.2. Product Portfolio

            17.1.4.3. Profitability by Market Segments

            17.1.4.4. Sales Footprint

            17.1.4.5. Strategy Overview

                17.1.4.5.1. Marketing Strategy

                17.1.4.5.2. Product Strategy

                17.1.4.5.3. Channel Strategy

        17.1.5. Mindray Medical International Limited

            17.1.5.1. Overview

            17.1.5.2. Product Portfolio

            17.1.5.3. Profitability by Market Segments

            17.1.5.4. Sales Footprint

            17.1.5.5. Strategy Overview

                17.1.5.5.1. Marketing Strategy

                17.1.5.5.2. Product Strategy

                17.1.5.5.3. Channel Strategy

        17.1.6. Siemens Healthlineers

            17.1.6.1. Overview

            17.1.6.2. Product Portfolio

            17.1.6.3. Profitability by Market Segments

            17.1.6.4. Sales Footprint

            17.1.6.5. Strategy Overview

                17.1.6.5.1. Marketing Strategy

                17.1.6.5.2. Product Strategy

                17.1.6.5.3. Channel Strategy

        17.1.7. F. Hoffman-La Roche Ltd.

            17.1.7.1. Overview

            17.1.7.2. Product Portfolio

            17.1.7.3. Profitability by Market Segments

            17.1.7.4. Sales Footprint

            17.1.7.5. Strategy Overview

                17.1.7.5.1. Marketing Strategy

                17.1.7.5.2. Product Strategy

                17.1.7.5.3. Channel Strategy

        17.1.8. HORIBA Ltd.

            17.1.8.1. Overview

            17.1.8.2. Product Portfolio

            17.1.8.3. Profitability by Market Segments

            17.1.8.4. Sales Footprint

            17.1.8.5. Strategy Overview

                17.1.8.5.1. Marketing Strategy

                17.1.8.5.2. Product Strategy

                17.1.8.5.3. Channel Strategy

        17.1.9. HemoCue AB

            17.1.9.1. Overview

            17.1.9.2. Product Portfolio

            17.1.9.3. Profitability by Market Segments

            17.1.9.4. Sales Footprint

            17.1.9.5. Strategy Overview

                17.1.9.5.1. Marketing Strategy

                17.1.9.5.2. Product Strategy

                17.1.9.5.3. Channel Strategy

        17.1.10. Danaher (Beckman Coulter Inc.)

            17.1.10.1. Overview

            17.1.10.2. Product Portfolio

            17.1.10.3. Profitability by Market Segments

            17.1.10.4. Sales Footprint

            17.1.10.5. Strategy Overview

                17.1.10.5.1. Marketing Strategy

                17.1.10.5.2. Product Strategy

                17.1.10.5.3. Channel Strategy

        17.1.11. Nihon Kohden Corporation

            17.1.11.1. Overview

            17.1.11.2. Product Portfolio

            17.1.11.3. Profitability by Market Segments

            17.1.11.4. Sales Footprint

            17.1.11.5. Strategy Overview

                17.1.11.5.1. Marketing Strategy

                17.1.11.5.2. Product Strategy

                17.1.11.5.3. Channel Strategy

        17.1.12. EKF Diagnostics

            17.1.12.1. Overview

            17.1.12.2. Product Portfolio

            17.1.12.3. Profitability by Market Segments

            17.1.12.4. Sales Footprint

            17.1.12.5. Strategy Overview

                17.1.12.5.1. Marketing Strategy

                17.1.12.5.2. Product Strategy

                17.1.12.5.3. Channel Strategy

        17.1.13. Ortho Clinical Diagnostics

            17.1.13.1. Overview

            17.1.13.2. Product Portfolio

            17.1.13.3. Profitability by Market Segments

            17.1.13.4. Sales Footprint

            17.1.13.5. Strategy Overview

                17.1.13.5.1. Marketing Strategy

                17.1.13.5.2. Product Strategy

                17.1.13.5.3. Channel Strategy

        17.1.14. Drew Scientific

            17.1.14.1. Overview

            17.1.14.2. Product Portfolio

            17.1.14.3. Profitability by Market Segments

            17.1.14.4. Sales Footprint

            17.1.14.5. Strategy Overview

                17.1.14.5.1. Marketing Strategy

                17.1.14.5.2. Product Strategy

                17.1.14.5.3. Channel Strategy

18. Assumptions & Acronyms Used

19. Research Methodology

Don't pay for what you don't need

Customize your report by selecting specific countries or regions and save 30%!

List of Tables

Table 1: Global Market Value (US$ million) Forecast by Region, 2017 to 2033

Table 2: Global Market Volume (Units) Forecast by Region, 2017 to 2033

Table 3: Global Market Value (US$ million) Forecast by Kit Type, 2017 to 2033

Table 4: Global Market Volume (Units) Forecast by Kit Type, 2017 to 2033

Table 5: Global Market Value (US$ million) Forecast by Modality, 2017 to 2033

Table 6: Global Market Volume (Units) Forecast by Modality, 2017 to 2033

Table 7: Global Market Value (US$ million) Forecast by Distribution Channel, 2017 to 2033

Table 8: Global Market Volume (Units) Forecast by Distribution Channel, 2017 to 2033

Table 9: North America Market Value (US$ million) Forecast by Country, 2017 to 2033

Table 10: North America Market Volume (Units) Forecast by Country, 2017 to 2033

Table 11: North America Market Value (US$ million) Forecast by Kit Type, 2017 to 2033

Table 12: North America Market Volume (Units) Forecast by Kit Type, 2017 to 2033

Table 13: North America Market Value (US$ million) Forecast by Modality, 2017 to 2033

Table 14: North America Market Volume (Units) Forecast by Modality, 2017 to 2033

Table 15: North America Market Value (US$ million) Forecast by Distribution Channel, 2017 to 2033

Table 16: North America Market Volume (Units) Forecast by Distribution Channel, 2017 to 2033

Table 17: Latin America Market Value (US$ million) Forecast by Country, 2017 to 2033

Table 18: Latin America Market Volume (Units) Forecast by Country, 2017 to 2033

Table 19: Latin America Market Value (US$ million) Forecast by Kit Type, 2017 to 2033

Table 20: Latin America Market Volume (Units) Forecast by Kit Type, 2017 to 2033

Table 21: Latin America Market Value (US$ million) Forecast by Modality, 2017 to 2033

Table 22: Latin America Market Volume (Units) Forecast by Modality, 2017 to 2033

Table 23: Latin America Market Value (US$ million) Forecast by Distribution Channel, 2017 to 2033

Table 24: Latin America Market Volume (Units) Forecast by Distribution Channel, 2017 to 2033

Table 25: Europe Market Value (US$ million) Forecast by Country, 2017 to 2033

Table 26: Europe Market Volume (Units) Forecast by Country, 2017 to 2033

Table 27: Europe Market Value (US$ million) Forecast by Kit Type, 2017 to 2033

Table 28: Europe Market Volume (Units) Forecast by Kit Type, 2017 to 2033

Table 29: Europe Market Value (US$ million) Forecast by Modality, 2017 to 2033

Table 30: Europe Market Volume (Units) Forecast by Modality, 2017 to 2033

Table 31: Europe Market Value (US$ million) Forecast by Distribution Channel, 2017 to 2033

Table 32: Europe Market Volume (Units) Forecast by Distribution Channel, 2017 to 2033

Table 33: East Asia Market Value (US$ million) Forecast by Country, 2017 to 2033

Table 34: East Asia Market Volume (Units) Forecast by Country, 2017 to 2033

Table 35: East Asia Market Value (US$ million) Forecast by Kit Type, 2017 to 2033

Table 36: East Asia Market Volume (Units) Forecast by Kit Type, 2017 to 2033

Table 37: East Asia Market Value (US$ million) Forecast by Modality, 2017 to 2033

Table 38: East Asia Market Volume (Units) Forecast by Modality, 2017 to 2033

Table 39: East Asia Market Value (US$ million) Forecast by Distribution Channel, 2017 to 2033

Table 40: East Asia Market Volume (Units) Forecast by Distribution Channel, 2017 to 2033

Table 41: South Asia & Pacific Market Value (US$ million) Forecast by Country, 2017 to 2033

Table 42: South Asia & Pacific Market Volume (Units) Forecast by Country, 2017 to 2033

Table 43: South Asia & Pacific Market Value (US$ million) Forecast by Kit Type, 2017 to 2033

Table 44: South Asia & Pacific Market Volume (Units) Forecast by Kit Type, 2017 to 2033

Table 45: South Asia & Pacific Market Value (US$ million) Forecast by Modality, 2017 to 2033

Table 46: South Asia & Pacific Market Volume (Units) Forecast by Modality, 2017 to 2033

Table 47: South Asia & Pacific Market Value (US$ million) Forecast by Distribution Channel, 2017 to 2033

Table 48: South Asia & Pacific Market Volume (Units) Forecast by Distribution Channel, 2017 to 2033

Table 49: MEA Market Value (US$ million) Forecast by Country, 2017 to 2033

Table 50: MEA Market Volume (Units) Forecast by Country, 2017 to 2033

Table 51: MEA Market Value (US$ million) Forecast by Kit Type, 2017 to 2033

Table 52: MEA Market Volume (Units) Forecast by Kit Type, 2017 to 2033

Table 53: MEA Market Value (US$ million) Forecast by Modality, 2017 to 2033

Table 54: MEA Market Volume (Units) Forecast by Modality, 2017 to 2033

Table 55: MEA Market Value (US$ million) Forecast by Distribution Channel, 2017 to 2033

Table 56: MEA Market Volume (Units) Forecast by Distribution Channel, 2017 to 2033
Sabyasachi Ghosh
Sabyasachi Ghosh

Principal Consultant

Talk to Analyst

Find your sweet spots for generating winning opportunities in this market.

List of Charts

Figure 1: Global Market Value (US$ million) by Kit Type, 2023 to 2033

Figure 2: Global Market Value (US$ million) by Modality, 2023 to 2033

Figure 3: Global Market Value (US$ million) by Distribution Channel, 2023 to 2033

Figure 4: Global Market Value (US$ million) by Region, 2023 to 2033

Figure 5: Global Market Value (US$ million) Analysis by Region, 2017 to 2033

Figure 6: Global Market Volume (Units) Analysis by Region, 2017 to 2033

Figure 7: Global Market Value Share (%) and BPS Analysis by Region, 2023 to 2033

Figure 8: Global Market Y-o-Y Growth (%) Projections by Region, 2023 to 2033

Figure 9: Global Market Value (US$ million) Analysis by Kit Type, 2017 to 2033

Figure 10: Global Market Volume (Units) Analysis by Kit Type, 2017 to 2033

Figure 11: Global Market Value Share (%) and BPS Analysis by Kit Type, 2023 to 2033

Figure 12: Global Market Y-o-Y Growth (%) Projections by Kit Type, 2023 to 2033

Figure 13: Global Market Value (US$ million) Analysis by Modality, 2017 to 2033

Figure 14: Global Market Volume (Units) Analysis by Modality, 2017 to 2033

Figure 15: Global Market Value Share (%) and BPS Analysis by Modality, 2023 to 2033

Figure 16: Global Market Y-o-Y Growth (%) Projections by Modality, 2023 to 2033

Figure 17: Global Market Value (US$ million) Analysis by Distribution Channel, 2017 to 2033

Figure 18: Global Market Volume (Units) Analysis by Distribution Channel, 2017 to 2033

Figure 19: Global Market Value Share (%) and BPS Analysis by Distribution Channel, 2023 to 2033

Figure 20: Global Market Y-o-Y Growth (%) Projections by Distribution Channel, 2023 to 2033

Figure 21: Global Market Attractiveness by Kit Type, 2023 to 2033

Figure 22: Global Market Attractiveness by Modality, 2023 to 2033

Figure 23: Global Market Attractiveness by Distribution Channel, 2023 to 2033

Figure 24: Global Market Attractiveness by Region, 2023 to 2033

Figure 25: North America Market Value (US$ million) by Kit Type, 2023 to 2033

Figure 26: North America Market Value (US$ million) by Modality, 2023 to 2033

Figure 27: North America Market Value (US$ million) by Distribution Channel, 2023 to 2033

Figure 28: North America Market Value (US$ million) by Country, 2023 to 2033

Figure 29: North America Market Value (US$ million) Analysis by Country, 2017 to 2033

Figure 30: North America Market Volume (Units) Analysis by Country, 2017 to 2033

Figure 31: North America Market Value Share (%) and BPS Analysis by Country, 2023 to 2033

Figure 32: North America Market Y-o-Y Growth (%) Projections by Country, 2023 to 2033

Figure 33: North America Market Value (US$ million) Analysis by Kit Type, 2017 to 2033

Figure 34: North America Market Volume (Units) Analysis by Kit Type, 2017 to 2033

Figure 35: North America Market Value Share (%) and BPS Analysis by Kit Type, 2023 to 2033

Figure 36: North America Market Y-o-Y Growth (%) Projections by Kit Type, 2023 to 2033

Figure 37: North America Market Value (US$ million) Analysis by Modality, 2017 to 2033

Figure 38: North America Market Volume (Units) Analysis by Modality, 2017 to 2033

Figure 39: North America Market Value Share (%) and BPS Analysis by Modality, 2023 to 2033

Figure 40: North America Market Y-o-Y Growth (%) Projections by Modality, 2023 to 2033

Figure 41: North America Market Value (US$ million) Analysis by Distribution Channel, 2017 to 2033

Figure 42: North America Market Volume (Units) Analysis by Distribution Channel, 2017 to 2033

Figure 43: North America Market Value Share (%) and BPS Analysis by Distribution Channel, 2023 to 2033

Figure 44: North America Market Y-o-Y Growth (%) Projections by Distribution Channel, 2023 to 2033

Figure 45: North America Market Attractiveness by Kit Type, 2023 to 2033

Figure 46: North America Market Attractiveness by Modality, 2023 to 2033

Figure 47: North America Market Attractiveness by Distribution Channel, 2023 to 2033

Figure 48: North America Market Attractiveness by Country, 2023 to 2033

Figure 49: Latin America Market Value (US$ million) by Kit Type, 2023 to 2033

Figure 50: Latin America Market Value (US$ million) by Modality, 2023 to 2033

Figure 51: Latin America Market Value (US$ million) by Distribution Channel, 2023 to 2033

Figure 52: Latin America Market Value (US$ million) by Country, 2023 to 2033

Figure 53: Latin America Market Value (US$ million) Analysis by Country, 2017 to 2033

Figure 54: Latin America Market Volume (Units) Analysis by Country, 2017 to 2033

Figure 55: Latin America Market Value Share (%) and BPS Analysis by Country, 2023 to 2033

Figure 56: Latin America Market Y-o-Y Growth (%) Projections by Country, 2023 to 2033

Figure 57: Latin America Market Value (US$ million) Analysis by Kit Type, 2017 to 2033

Figure 58: Latin America Market Volume (Units) Analysis by Kit Type, 2017 to 2033

Figure 59: Latin America Market Value Share (%) and BPS Analysis by Kit Type, 2023 to 2033

Figure 60: Latin America Market Y-o-Y Growth (%) Projections by Kit Type, 2023 to 2033

Figure 61: Latin America Market Value (US$ million) Analysis by Modality, 2017 to 2033

Figure 62: Latin America Market Volume (Units) Analysis by Modality, 2017 to 2033

Figure 63: Latin America Market Value Share (%) and BPS Analysis by Modality, 2023 to 2033

Figure 64: Latin America Market Y-o-Y Growth (%) Projections by Modality, 2023 to 2033

Figure 65: Latin America Market Value (US$ million) Analysis by Distribution Channel, 2017 to 2033

Figure 66: Latin America Market Volume (Units) Analysis by Distribution Channel, 2017 to 2033

Figure 67: Latin America Market Value Share (%) and BPS Analysis by Distribution Channel, 2023 to 2033

Figure 68: Latin America Market Y-o-Y Growth (%) Projections by Distribution Channel, 2023 to 2033

Figure 69: Latin America Market Attractiveness by Kit Type, 2023 to 2033

Figure 70: Latin America Market Attractiveness by Modality, 2023 to 2033

Figure 71: Latin America Market Attractiveness by Distribution Channel, 2023 to 2033

Figure 72: Latin America Market Attractiveness by Country, 2023 to 2033

Figure 73: Europe Market Value (US$ million) by Kit Type, 2023 to 2033

Figure 74: Europe Market Value (US$ million) by Modality, 2023 to 2033

Figure 75: Europe Market Value (US$ million) by Distribution Channel, 2023 to 2033

Figure 76: Europe Market Value (US$ million) by Country, 2023 to 2033

Figure 77: Europe Market Value (US$ million) Analysis by Country, 2017 to 2033

Figure 78: Europe Market Volume (Units) Analysis by Country, 2017 to 2033

Figure 79: Europe Market Value Share (%) and BPS Analysis by Country, 2023 to 2033

Figure 80: Europe Market Y-o-Y Growth (%) Projections by Country, 2023 to 2033

Figure 81: Europe Market Value (US$ million) Analysis by Kit Type, 2017 to 2033

Figure 82: Europe Market Volume (Units) Analysis by Kit Type, 2017 to 2033

Figure 83: Europe Market Value Share (%) and BPS Analysis by Kit Type, 2023 to 2033

Figure 84: Europe Market Y-o-Y Growth (%) Projections by Kit Type, 2023 to 2033

Figure 85: Europe Market Value (US$ million) Analysis by Modality, 2017 to 2033

Figure 86: Europe Market Volume (Units) Analysis by Modality, 2017 to 2033

Figure 87: Europe Market Value Share (%) and BPS Analysis by Modality, 2023 to 2033

Figure 88: Europe Market Y-o-Y Growth (%) Projections by Modality, 2023 to 2033

Figure 89: Europe Market Value (US$ million) Analysis by Distribution Channel, 2017 to 2033

Figure 90: Europe Market Volume (Units) Analysis by Distribution Channel, 2017 to 2033

Figure 91: Europe Market Value Share (%) and BPS Analysis by Distribution Channel, 2023 to 2033

Figure 92: Europe Market Y-o-Y Growth (%) Projections by Distribution Channel, 2023 to 2033

Figure 93: Europe Market Attractiveness by Kit Type, 2023 to 2033

Figure 94: Europe Market Attractiveness by Modality, 2023 to 2033

Figure 95: Europe Market Attractiveness by Distribution Channel, 2023 to 2033

Figure 96: Europe Market Attractiveness by Country, 2023 to 2033

Figure 97: East Asia Market Value (US$ million) by Kit Type, 2023 to 2033

Figure 98: East Asia Market Value (US$ million) by Modality, 2023 to 2033

Figure 99: East Asia Market Value (US$ million) by Distribution Channel, 2023 to 2033

Figure 100: East Asia Market Value (US$ million) by Country, 2023 to 2033

Figure 101: East Asia Market Value (US$ million) Analysis by Country, 2017 to 2033

Figure 102: East Asia Market Volume (Units) Analysis by Country, 2017 to 2033

Figure 103: East Asia Market Value Share (%) and BPS Analysis by Country, 2023 to 2033

Figure 104: East Asia Market Y-o-Y Growth (%) Projections by Country, 2023 to 2033

Figure 105: East Asia Market Value (US$ million) Analysis by Kit Type, 2017 to 2033

Figure 106: East Asia Market Volume (Units) Analysis by Kit Type, 2017 to 2033

Figure 107: East Asia Market Value Share (%) and BPS Analysis by Kit Type, 2023 to 2033

Figure 108: East Asia Market Y-o-Y Growth (%) Projections by Kit Type, 2023 to 2033

Figure 109: East Asia Market Value (US$ million) Analysis by Modality, 2017 to 2033

Figure 110: East Asia Market Volume (Units) Analysis by Modality, 2017 to 2033

Figure 111: East Asia Market Value Share (%) and BPS Analysis by Modality, 2023 to 2033

Figure 112: East Asia Market Y-o-Y Growth (%) Projections by Modality, 2023 to 2033

Figure 113: East Asia Market Value (US$ million) Analysis by Distribution Channel, 2017 to 2033

Figure 114: East Asia Market Volume (Units) Analysis by Distribution Channel, 2017 to 2033

Figure 115: East Asia Market Value Share (%) and BPS Analysis by Distribution Channel, 2023 to 2033

Figure 116: East Asia Market Y-o-Y Growth (%) Projections by Distribution Channel, 2023 to 2033

Figure 117: East Asia Market Attractiveness by Kit Type, 2023 to 2033

Figure 118: East Asia Market Attractiveness by Modality, 2023 to 2033

Figure 119: East Asia Market Attractiveness by Distribution Channel, 2023 to 2033

Figure 120: East Asia Market Attractiveness by Country, 2023 to 2033

Figure 121: South Asia & Pacific Market Value (US$ million) by Kit Type, 2023 to 2033

Figure 122: South Asia & Pacific Market Value (US$ million) by Modality, 2023 to 2033

Figure 123: South Asia & Pacific Market Value (US$ million) by Distribution Channel, 2023 to 2033

Figure 124: South Asia & Pacific Market Value (US$ million) by Country, 2023 to 2033

Figure 125: South Asia & Pacific Market Value (US$ million) Analysis by Country, 2017 to 2033

Figure 126: South Asia & Pacific Market Volume (Units) Analysis by Country, 2017 to 2033

Figure 127: South Asia & Pacific Market Value Share (%) and BPS Analysis by Country, 2023 to 2033

Figure 128: South Asia & Pacific Market Y-o-Y Growth (%) Projections by Country, 2023 to 2033

Figure 129: South Asia & Pacific Market Value (US$ million) Analysis by Kit Type, 2017 to 2033

Figure 130: South Asia & Pacific Market Volume (Units) Analysis by Kit Type, 2017 to 2033

Figure 131: South Asia & Pacific Market Value Share (%) and BPS Analysis by Kit Type, 2023 to 2033

Figure 132: South Asia & Pacific Market Y-o-Y Growth (%) Projections by Kit Type, 2023 to 2033

Figure 133: South Asia & Pacific Market Value (US$ million) Analysis by Modality, 2017 to 2033

Figure 134: South Asia & Pacific Market Volume (Units) Analysis by Modality, 2017 to 2033

Figure 135: South Asia & Pacific Market Value Share (%) and BPS Analysis by Modality, 2023 to 2033

Figure 136: South Asia & Pacific Market Y-o-Y Growth (%) Projections by Modality, 2023 to 2033

Figure 137: South Asia & Pacific Market Value (US$ million) Analysis by Distribution Channel, 2017 to 2033

Figure 138: South Asia & Pacific Market Volume (Units) Analysis by Distribution Channel, 2017 to 2033

Figure 139: South Asia & Pacific Market Value Share (%) and BPS Analysis by Distribution Channel, 2023 to 2033

Figure 140: South Asia & Pacific Market Y-o-Y Growth (%) Projections by Distribution Channel, 2023 to 2033

Figure 141: South Asia & Pacific Market Attractiveness by Kit Type, 2023 to 2033

Figure 142: South Asia & Pacific Market Attractiveness by Modality, 2023 to 2033

Figure 143: South Asia & Pacific Market Attractiveness by Distribution Channel, 2023 to 2033

Figure 144: South Asia & Pacific Market Attractiveness by Country, 2023 to 2033

Figure 145: MEA Market Value (US$ million) by Kit Type, 2023 to 2033

Figure 146: MEA Market Value (US$ million) by Modality, 2023 to 2033

Figure 147: MEA Market Value (US$ million) by Distribution Channel, 2023 to 2033

Figure 148: MEA Market Value (US$ million) by Country, 2023 to 2033

Figure 149: MEA Market Value (US$ million) Analysis by Country, 2017 to 2033

Figure 150: MEA Market Volume (Units) Analysis by Country, 2017 to 2033

Figure 151: MEA Market Value Share (%) and BPS Analysis by Country, 2023 to 2033

Figure 152: MEA Market Y-o-Y Growth (%) Projections by Country, 2023 to 2033

Figure 153: MEA Market Value (US$ million) Analysis by Kit Type, 2017 to 2033

Figure 154: MEA Market Volume (Units) Analysis by Kit Type, 2017 to 2033

Figure 155: MEA Market Value Share (%) and BPS Analysis by Kit Type, 2023 to 2033

Figure 156: MEA Market Y-o-Y Growth (%) Projections by Kit Type, 2023 to 2033

Figure 157: MEA Market Value (US$ million) Analysis by Modality, 2017 to 2033

Figure 158: MEA Market Volume (Units) Analysis by Modality, 2017 to 2033

Figure 159: MEA Market Value Share (%) and BPS Analysis by Modality, 2023 to 2033

Figure 160: MEA Market Y-o-Y Growth (%) Projections by Modality, 2023 to 2033

Figure 161: MEA Market Value (US$ million) Analysis by Distribution Channel, 2017 to 2033

Figure 162: MEA Market Volume (Units) Analysis by Distribution Channel, 2017 to 2033

Figure 163: MEA Market Value Share (%) and BPS Analysis by Distribution Channel, 2023 to 2033

Figure 164: MEA Market Y-o-Y Growth (%) Projections by Distribution Channel, 2023 to 2033

Figure 165: MEA Market Attractiveness by Kit Type, 2023 to 2033

Figure 166: MEA Market Attractiveness by Modality, 2023 to 2033

Figure 167: MEA Market Attractiveness by Distribution Channel, 2023 to 2033

Figure 168: MEA Market Attractiveness by Country, 2023 to 2033

Recommendations

Consumer Product

Therapeutic Contact Lenses Market

Published : January 2023

Testing Equipment

Hematology Analyzer Market

Published : April 2022

Explore Healthcare Insights

View Reports

Hematology Diagnostics Market