Pneumonia Diagnostics Market
Market Insights on Pneumonia Diagnostics covering sales outlook, demand forecast & up-to-date key trends
Pneumonia Diagnostics Market By Product Type (Streptococcus-based, Legionella-based, Chlamydophila-based, Viral Pneumonia-based, Mycoplasma Pneumonia-based) & Region - Forecast 2017 - 2027
Greater Adoption of Pneumonia Diagnostics Equipment Worldwide
A paradigm shift has been observed from traditional culture diagnosis to rapid pneumonia identification - a game-changer in the pneumonia diagnostics market. In the traditional method, cultures are used to detect pneumonia causative organisms. This is a time-consuming process with a higher error rate when compared to rapid diagnostics. In a few cases such as legionella, culture identification is not readily available and this increases the mortality rate of pneumonia cases caused by it.
The rapid rate of technological advancement has made pneumonia diagnosis much quicker and more cost-effective with a greater degree of sensitivity and specificity. The urinary antigen is an extremely-effective rapid test that allows targeted therapy foe legionnaire at the point-of-care itself.
Let us know your requirement to get
100% FREE customization
Diagnostic Difficulties Pose a Challenge in Pneumonia Diagnostics Market
It is typically not difficult to diagnose and manage pneumonia in a community seating. Clinical decisions are mainly used in diagnosis information. Nonetheless, there have been some cases with fake positive results that have led to serious patient mismanagement. The patients were prescribed antibiotics and reported super infections and complications because of the former.
Immunoassay techniques seem to be fairly promising for pneumonia diagnostics but are inadequate currently to screen a diverse array of organisms. All of these factors can restrict the growth of the pneumonia diagnostics market and can even decrease adoption in certain situations.
Demand for Rapid Diagnostics Tests Trending the Pneumonia Diagnostics Market
On account of a rising number of patients contracting pneumonia, the demand for high-quality rapid test kits has seen a noticeable spike. Kits that are fast-acting, have high sensitivity, and specificity is quite high from physicians, hospitals, and diagnostics labs across the world. In addition to this, there is also demand for cost-effective diagnostic kits, particularly in European nations that demand cheaper kits, affluence and higher disposable income notwithstanding.
Find your sweet spots for generating winning opportunities in this market.
Talk to AnalystNorth America Largest Region in the Global Pneumonia Diagnostics Market
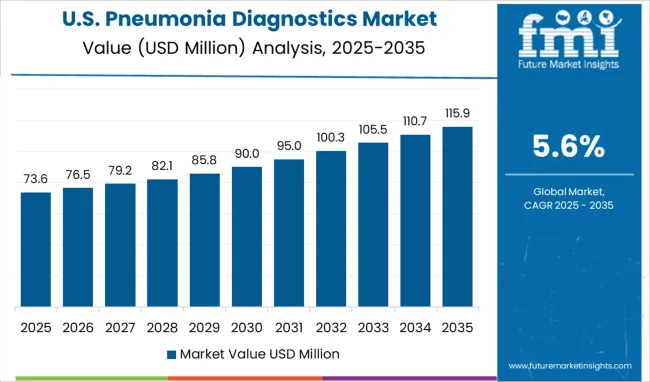
North America has the largest market share in the pneumonia diagnostics market and should remain so for the duration of the forecast period. The US accounts for more than 4/5th of the North America pneumonia diagnostics market and represents a much larger opportunity than its larger neighbour.
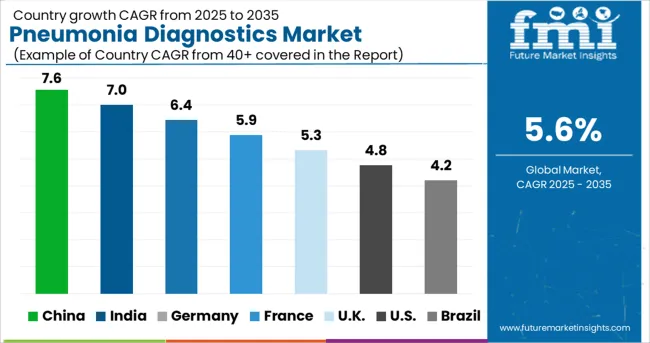
However, it would be unwise to ignore Canada entirely as it is poised to witness a higher CAGR of 6.4% for the decade. The intense competition in the North America pneumonia diagnostics market is predicted to cause pricing pressure and key stakeholders will have to take this into account.
UK and Germany Critical in Western Europe Pneumonia Diagnostics Market
The UK and Germany accounted for more than 2/5th of the Western Europe pneumonia diagnostics market primarily because of their robust, well-developed healthcare infrastructure and a greater awareness of a geriatric population likely to develop such health issues.
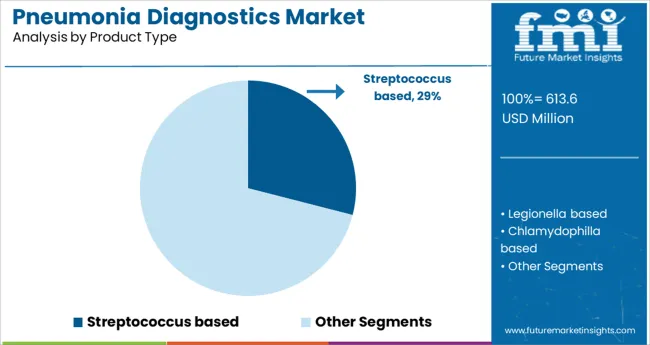
The streptococcus-based product type holds the key to success in the Western Europe pneumonia diagnostics market and companies are recommended to devise their market strategies accordingly. The Western Europe pneumonia diagnostics market is on track to be worth almost US$ 147 million by end 2027.

An unified Market Research Subscription Platform, built for today’s disparate research needs.
APEJ Closely Follows Western Europe in Global Pneumonia Diagnostics Market
APEJ is the third largest region in the pneumonia diagnostics market behind North America and Europe but is unlikely to cross the latter for the foreseeable future. China and India are the countries to keep an eye out for in the APEJ pneumonia diagnostics market. The China pneumonia diagnostics market has a value of approx. US$ 16 million in 2017 itself.
Pneumonia Diagnostics Market Taxonomy
Product Type:
- Streptococcus-based
- Legionella-based
- Chlamydophila-based
- Viral Pneumonia-based
- Mycoplasma Pneumonia-based
Region:
- North America
- Western Europe
- Eastern Europe
- Latin America
- Asia Pacific Excluding Japan
- Japan
- Middle East & Africa
Frequently Asked Questions
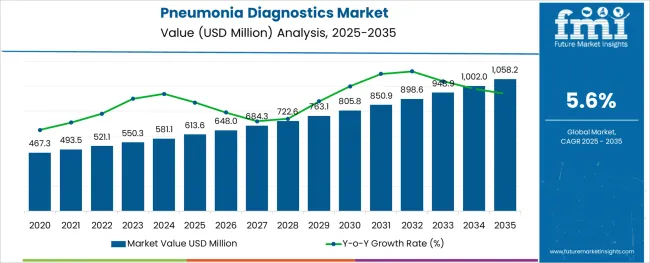
From 2022-2032, the pneumonia diagnostics market is expected to register a CAGR of 6%
By 2022-end, the market for pneumonia diagnostics is expected to reach US$ 1.8 Billion
U.K and Germany will collectively account for over 40% of the pneumonia diagnostics market
By 2032, the pneumonia diagnostics market is expected to reach US$ 3.22 Billion
Table of Content
1. Executive Summary
1.1. Market Overview
1.2. Market Analysis
1.3. FMI Analysis and Recommendations
1.4. Wheel of Fortune
2. Market Introduction
2.1. Market Taxonomy
2.2. Market Definition
3. Pneumonia Diagnostics Market View Point
3.1. Macro-Economic Factors
3.2. Market Dynamics
3.2.1. Drivers
3.2.2. Restraints
3.2.3. Trends
3.3. Opportunity Analysis
3.4. Epidemiology of Pneumonia & Leading Causes of Pneumonia
4. North America Pneumonia Diagnostics Market Analysis 2012–2016 and Forecast 2017–2027
4.1. Introduction
4.2. Historical Market Size (US$ Mn) Analysis By Country, 2012-2016
4.2.1. U.S.
4.2.2. Canada
4.3. Market Size (US$ Mn) Forecast By Country, 2017-2027
4.3.1. U.S.
4.3.2. Canada
4.4. Historical Market Size (US$ Mn) Analysis By Product Type, 2012-2016
4.4.1. Streptococcus based
4.4.2. Legionella based
4.4.3. Chlamydophila based
4.4.4. Mycoplasma Pneumonia based
4.4.5. Viral Pneumonia based
4.5. Market Size (US$ Mn) Forecast By Product Type, 2017-2027
4.5.1. Streptococcus based
4.5.2. Legionella based
4.5.3. Chlamydophila based
4.5.4. Mycoplasma Pneumonia based
4.5.5. Viral Pneumonia based
4.6. Drivers and Restraints: Impact Analysis
4.7. Market Attractiveness Analysis
4.7.1. By Country
4.7.2. By Product Type
4.8. Key Representative Market Participants
4.9. Key Participants Market Presence (Intensity Map)
5. Western Europe Pneumonia Diagnostics Market Analysis 2012–2016 and Forecast 2017–2027
5.1. Introduction
5.2. Historical Market Size (US$ Mn) and Volume Analysis By Country, 2012-2016
5.2.1. Germany
5.2.2. United Kingdom
5.2.3. France
5.2.4. Italy
5.2.5. Spain
5.2.6. Nordics
5.2.7. Rest of Western Europe
5.3. Market Size (US$ Mn) and Volume Forecast By Country, 2017-2027
5.3.1. Germany
5.3.2. United Kingdom
5.3.3. France
5.3.4. Italy
5.3.5. Spain
5.3.6. Nordics
5.3.7. Rest of Western Europe
5.4. Historical Market Size (US$ Mn) Analysis By Product Type, 2012-2016
5.4.1. Streptococcus based
5.4.2. Legionella based
5.4.3. Chlamydophila based
5.4.4. Mycoplasma Pneumonia based
5.4.5. Viral Pneumonia based
5.5. Market Size (US$ Mn) Forecast By Product Type, 2017-2027
5.5.1. Streptococcus based
5.5.2. Legionella based
5.5.3. Chlamydophila based
5.5.4. Mycoplasma Pneumonia based
5.5.5. Viral Pneumonia based
5.6. Drivers and Restraints: Impact Analysis
5.7. Market Attractiveness Analysis
5.7.1. By Country
5.7.2. By Product Type
5.8. Key Representative Market Participants
5.9. Key Participants Market Presence (Intensity Map)
6. Eastern Europe Pneumonia Diagnostics Market Analysis 2012–2016 and Forecast 2017–2027
6.1. Introduction
6.2. Historical Market Size (US$ Mn) Analysis By Country, 2012-2016
6.2.1. Russia
6.2.2. Poland
6.2.3. Rest of Eastern Europe
6.3. Market Size (US$ Mn) Forecast By Country, 2017-2027
6.3.1. Russia
6.3.2. Poland
6.3.3. Rest of Eastern Europe
6.4. Historical Market Size (US$ Mn) Analysis By Product Type, 2012-2016
6.4.1. Streptococcus based
6.4.2. Legionella based
6.4.3. Chlamydophila based
6.4.4. Mycoplasma Pneumonia based
6.4.5. Viral Pneumonia based
6.5. Market Size (US$ Mn) Forecast By Product Type, 2017-2027
6.5.1. Streptococcus based
6.5.2. Legionella based
6.5.3. Chlamydophila based
6.5.4. Mycoplasma Pneumonia based
6.5.5. Viral Pneumonia based
6.6. Drivers and Restraints: Impact Analysis
6.7. Market Attractiveness Analysis
6.7.1. By Country
6.7.2. By Product Type
6.8. Key Representative Market Participants
6.9. Key Participants Market Presence (Intensity Map)
7. Latin America Pneumonia Diagnostics Market Analysis 2012–2016 and Forecast 2017–2027
7.1. Introduction
7.2. Historical Market Size (US$ Mn) Analysis By Country, 2012-2016
7.2.1. Brazil
7.2.2. Mexico
7.2.3. Rest of Latin America
7.3. Market Size (US$ Mn) Forecast By Country, 2017-2027
7.3.1. Brazil
7.3.2. Mexico
7.3.3. Rest of Latin America
7.4. Historical Market Size (US$ Mn) Analysis By Product Type, 2012-2016
7.4.1. Streptococcus based
7.4.2. Legionella based
7.4.3. Chlamydophila based
7.4.4. Mycoplasma Pneumonia based
7.4.5. Viral Pneumonia based
7.5. Market Size (US$ Mn) Forecast By Product Type, 2017-2027
7.5.1. Streptococcus based
7.5.2. Legionella based
7.5.3. Chlamydophila based
7.5.4. Mycoplasma Pneumonia based
7.5.5. Viral Pneumonia based
7.6. Drivers and Restraints: Impact Analysis
7.7. Market Attractiveness Analysis
7.7.1. By Country
7.7.2. By Product Type
7.8. Key Representative Market Participants
7.9. Key Participants Market Presence (Intensity Map)
8. Japan Pneumonia Diagnostics Market Analysis 2012–2016 and Forecast 2017–2027
8.1. Introduction
8.2. Regional Market Dynamics
8.2.1. Drivers
8.2.2. Restraints
8.2.3. Trends
8.3. Historical Market Size (US$ Mn) Analysis By Product Type, 2012-2016
8.3.1. Streptococcus based
8.3.2. Legionella based
8.3.3. Chlamydophila based
8.3.4. Mycoplasma Pneumonia based
8.3.5. Viral Pneumonia based
8.4. Market Size (US$ Mn) Forecast By Product Type, 2017-2027
8.4.1. Streptococcus based
8.4.2. Legionella based
8.4.3. Chlamydophila based
8.4.4. Mycoplasma Pneumonia based
8.4.5. Viral Pneumonia based
8.5. Drivers and Restraints: Impact Analysis
8.6. Market Attractiveness Analysis
8.6.1. By Product Type
8.7. Key Representative Market Participants
8.8. Key Participants Market Presence (Intensity Map)
9. Asia Pacific Excluding Japan Pneumonia Diagnostics Market Analysis 2012–2016 and Forecast 2017–2027
9.1. Introduction
9.2. Historical Market Size (US$ Mn) Analysis By Country, 2012-2016
9.2.1. China
9.2.2. India
9.2.3. Australia and New Zealand
9.2.4. ASEAN
9.2.5. Rest of APEJ
9.3. Market Size (US$ Mn) Forecast By Country, 2017-2027
9.3.1. China
9.3.2. India
9.3.3. Australia and New Zealand
9.3.4. ASEAN
9.3.5. Rest of APEJ
9.4. Historical Market Size (US$ Mn) Analysis By Product Type, 2012-2016
9.4.1. Streptococcus based
9.4.2. Legionella based
9.4.3. Chlamydophila based
9.4.4. Mycoplasma Pneumonia based
9.4.5. Viral Pneumonia based
9.5. Market Size (US$ Mn) Forecast By Product Type, 2017-2027
9.5.1. Streptococcus based
9.5.2. Legionella based
9.5.3. Chlamydophila based
9.5.4. Mycoplasma Pneumonia based
9.5.5. Viral Pneumonia based
9.6. Drivers and Restraints: Impact Analysis
9.7. Market Attractiveness Analysis
9.7.1. By Country
9.7.2. By Product Type
9.8. Key Representative Market Participants
9.9. Key Participants Market Presence (Intensity Map)
10. Middle East and Africa Pneumonia Diagnostics Market Analysis 2012–2016 and Forecast 2017–2027
10.1. Introduction
10.2. Historical Market Size (US$ Mn) Analysis By Country, 2012-2016
10.2.1. GCC Countries
10.2.2. South Africa
10.2.3. Rest of Middle East and Africa
10.3. Market Size (US$ Mn) Forecast By Country, 2017-2027
10.3.1. GCC Countries
10.3.2. South Africa
10.3.3. Rest of Middle East and Africa
10.4. Historical Market Size (US$ Mn) Analysis By Product Type, 2012-2016
10.4.1. Streptococcus based
10.4.2. Legionella based
10.4.3. Chlamydophila based
10.4.4. Mycoplasma Pneumonia based
10.4.5. Viral Pneumonia based
10.5. Market Size (US$ Mn) Forecast By Product Type, 2017-2027
10.5.1. Streptococcus based
10.5.2. Legionella based
10.5.3. Chlamydophila based
10.5.4. Mycoplasma Pneumonia based
10.5.5. Viral Pneumonia based
10.6. Drivers and Restraints: Impact Analysis
10.7. Market Attractiveness Analysis
10.7.1. By Country
10.7.2. By Product Type
10.8. Key Representative Market Participants
10.9. Key Participants Market Presence (Intensity Map)
11. Forecast Factors: Relevance and Impact
12. Forecast Assumptions
13. Competition Landscape
13.1. Market Share Analysis
13.2. Company Profiles (Details – Overview, Financials, Strategy, Recent Developments)
13.2.1. Thermo Fisher Scientific Inc.
13.2.2. Alere Inc.
13.2.3. Quidel Corporation
13.2.4. Becton, Dickinson and Company
13.2.5. Meridian Bioscience, Inc.
13.2.6. Qiagen N.V.
13.2.7. bioMérieux SA
13.2.8. Bio-Rad Laboratories Inc.
13.2.9. Cardinal Health Inc.
13.2.10. Beckman Coulter Inc (Danaher Corporation)
14. Global Pneumonia Diagnostics Market Analysis 2012–2016 and Forecast 2017–2027 By Region
14.1. Introduction / Key Findings
14.2. Historical Market Size (US$ Mn) Analysis By Region, 2012-2016
14.2.1. North America
14.2.2. Latin America
14.2.3. Western Europe
14.2.4. Eastern Europe
14.2.5. Japan
14.2.6. Asia Pacific Excluding Japan
14.2.7. Middle East and Africa
14.3. Market Size (US$ Mn) Forecast By Region, 2017-2027
14.3.1. North America
14.3.2. Latin America
14.3.3. Western Europe
14.3.4. Eastern Europe
14.3.5. Japan
14.3.6. Asia Pacific Excluding Japan
14.3.7. Middle East and Africa
14.4. Market Attractiveness Analysis By Region
15. Global Pneumonia Diagnostics Market Analysis 2012–2016 and Forecast 2017–2027, By Product Type
15.1. Introduction/Key Finding
15.2. Historical Market Size (US$ Mn) Analysis By Product Type, 2012-2016
15.2.1. Streptococcus based
15.2.2. Legionella based
15.2.3. Chlamydophila based
15.2.4. Mycoplasma Pneumonia based
15.2.5. Viral Pneumonia based
15.3. Market Size (US$ Mn) Forecast By Product Type, 2017-2027
15.3.1. Streptococcus based
15.3.2. Legionella based
15.3.3. Chlamydophila based
15.3.4. Mycoplasma Pneumonia based
15.3.5. Viral Pneumonia based
15.4. Market Attractiveness Analysis By Product Type
16. Global Pneumonia Diagnostics Market Analysis 2012–2016 and Forecast 2017–2027
16.1. Market Size and Y-o-Y Growth
16.2. Absolute $ Opportunity
17. Assumptions and Acronyms Used
18. Research Methodology
Let us know your requirement to get
100% FREE customization
List of Tables
Table 01: North America Pneumonia Diagnostics Market Size (US$ Mn) Analysis-2012–2016 and Forecast 2017–2027, By Country
Table 02: North America Pneumonia Diagnostics Market Size (US$ Mn) Analysis-2012–2016 and Forecast 2017–2027, By Product Type
Table 03: Western Europe Pneumonia Diagnostics Market Size (US$ Mn) Analysis-2012–2016 and Forecast 2017–2027, By Country
Table 04: Western Europe Pneumonia Diagnostics Market Size (US$ Mn) Analysis-2012–2016 and Forecast 2017–2027, By Product Type Segment
Table 05: Eastern Europe Pneumonia Diagnostics Market Size (US$ Mn) Analysis-2012–2016 and Forecast 2017–2027, By Country
Table 06: Eastern Europe Pneumonia Diagnostics Market Size (US$ Mn) Analysis-2012–2016 and Forecast 2017–2027, By Product Type Segment
Table 07: Latin America Pneumonia Diagnostics Market Size (US$ Mn) Analysis-2012–2016 and Forecast 2017–2027, By Country
Table 08: Latin America Pneumonia Diagnostics Market Size (US$ Mn) Analysis-2012–2016 and Forecast 2017–2027, By Product Type Segment
Table 09: Asia Pacific Excluding Japan Pneumonia Diagnostics Market Size (US$ Mn) Analysis-2012–2016 and Forecast 2017–2027, By Country
Table 10: Asia Pacific Excluding Japan Pneumonia Diagnostics Market Size (US$ Mn) Analysis-2012–2016 and Forecast 2017–2027, By Country
Table 11: Japan Pneumonia Diagnostics Market Size (US$ Mn) Analysis-2012–2016 and Forecast 2017–2027, By Product Type Segment
Table 12: Middle East & Africa Pneumonia Diagnostics Market Size (US$ Mn) Analysis-2012–2016 and Forecast 2017–2027, By Country
Table 13: Middle East & Africa Pneumonia Diagnostics Market Size (US$ Mn) Analysis-2012–2016 and Forecast 2017–2027, By Product Type Segment
Table 15: Global Pneumonia Diagnostics Market Size (US$ Mn) Forecast by Region, 2012–2017
Table 16: Global Pneumonia Diagnostics Market Size (US$ Mn) Analysis-2012–2016 and Forecast 2017–2027, By Product Type Segment
Find your sweet spots for generating winning opportunities in this market.
Talk to AnalystList of Charts
Figure 1: Global Pneumonia Diagnostics Market Value (US$ Mn), 2016-2027
Figure 2: Global Pneumonia Diagnostics Market Value Share By Product Type 2016 (A)
Figure 3: Global Pneumonia Diagnostics Market Value Share By Region 2016 (A)
Figure 4 : Leading Cause of Pneumonia based on Epidemiology
Figure 5: North America Pneumonia Diagnostics Market Value Share By Product Type (2017)
Figure 6: North America Pneumonia Diagnostics Market Value Share By Country (2017)
Figure 7: North America Pneumonia Diagnostics Market Value Share
Figure 8: North America Pneumonia Diagnostics Market Size (US$ Mn) Analysis, 2012–2016
Figure 9: North America Pneumonia Diagnostics Market Size (US$ Mn) & Y-o-Y Growth (%), 2017–2027
Figure 10: North America Pneumonia Diagnostics Market Size (US$ Mn) Analysis, 2012–2016, by Streptococcus-based Segment
Figure 11: North America Pneumonia Diagnostics Market Size (US$ Mn) & Y-o-Y Growth (%) (US$ Mn) Analysis, 2017–2027, by Streptococcus-based Segment
Figure 12: North America Pneumonia Diagnostics Market Size (US$ Mn) Analysis, 2012–2016, by Legionella-based Segment
Figure 13: North America Pneumonia Diagnostics Market Size (US$ Mn) & Y-o-Y Growth (%), 2017–2027, by Legionella-based Segment
Figure 14: North America Pneumonia Diagnostics Market Size (US$ Mn) Analysis, 2012–2016, by Chlamydophila-based Segment
Figure 15: North America Pneumonia Diagnostics Market Size (US$ Mn) & Y-o-Y Growth (%) (US$ Mn) Analysis, 2017–2027, by Chlamydophila-based Segment
Figure 16: North America Pneumonia Diagnostics Market Size (US$ Mn) Analysis, 2012–2016, by Mycoplasma Pneumonia-based Segment
Figure 17: North America Pneumonia Diagnostics Market Size (US$ Mn) & Y-o-Y Growth (%), 2017–2027, by Mycoplasma Pneumonia-based Segment
Figure 18: North America Pneumonia Diagnostics Market Size (US$ Mn) Analysis, 2012–2016, by Viral Pneumonia-based Segment
Figure 19: North America Pneumonia Diagnostics Market Size (US$ Mn) & Y-o-Y Growth (%), 2017–2027, by Viral Pneumonia-based Segment
Figure 20: North America Pneumonia Diagnostics Market Attractiveness Analysis, 2017–2027, by Country
Figure 21: North America Pneumonia Diagnostics Market Attractiveness Analysis, 2017–2027, by Country
Figure 22: Western Europe Pneumonia Diagnostics Market Value Share By Product Type (2017)
Figure 23: Western Europe Pneumonia Diagnostics Market Value Share By Country (2017)
Figure 24: Western Europe Pneumonia Diagnostics Market Value Share
Figure 25: Western Europe Pneumonia Diagnostics Market Size (US$ Mn) Analysis, 2012–2016
Figure 26: Western Europe Pneumonia Diagnostics Market Size (US$ Mn) & Y-o-Y Growth (%), 2017–2027
Figure 27: Western Europe Pneumonia Diagnostics Market Size (US$ Mn) Analysis, 2012–2016, by Streptococcus-based Segment
Figure 28: Western Europe Pneumonia Diagnostics Market Size (US$ Mn) & Y-o-Y Growth (%) (US$ Mn) Analysis, 2017–2027, by Streptococcus-based Segment
Figure 29: Western Europe Pneumonia Diagnostics Market Size (US$ Mn) Analysis, 2012–2016, by Legionella-based Segment
Figure 30: Western Europe Pneumonia Diagnostics Market Size (US$ Mn) & Y-o-Y Growth (%), 2017–2027, by Legionella-based Segment
Figure 31: Western Europe Pneumonia Diagnostics Market Size (US$ Mn) Analysis, 2012–2016, by Chlamydophila-based Segment
Figure 32: Western Europe Pneumonia Diagnostics Market Size (US$ Mn) & Y-o-Y Growth (%) (US$ Mn) Analysis, 2017–2027, by Chlamydophila-based Segment
Figure 33: Western Europe Pneumonia Diagnostics Market Size (US$ Mn) Analysis, 2012–2016, by Mycoplasma Pneumonia-based Segment
Figure 34: Western Europe Pneumonia Diagnostics Market Size (US$ Mn) & Y-o-Y Growth (%), 2017–2027, by Mycoplasma Pneumonia-based Segment
Figure 35: Western Europe Pneumonia Diagnostics Market Size (US$ Mn) Analysis, 2012–2016, by Viral Pneumonia-based Segment
Figure 36: Western Europe Pneumonia Diagnostics Market Size (US$ Mn) & Y-o-Y Growth (%), 2017–2027, by Viral Pneumonia-based Segment
Figure 37: Western Europe Pneumonia Diagnostics Market Attractiveness Analysis, 2017–2027, by Country
Figure 38: Western Europe Pneumonia Diagnostics Market Attractiveness Analysis, 2017–2027, by Country
Figure 39: Eastern Europe Pneumonia Diagnostics Market Value Share By Product Type (2017)
Figure 40: Eastern Europe Pneumonia Diagnostics Market Value Share By Country (2017)
Figure 41: Eastern Europe Pneumonia Diagnostics Market Value Share
Figure 42: Eastern Europe Pneumonia Diagnostics Market Size (US$ Mn) Analysis, 2012–2016
Figure 43: Eastern Europe Pneumonia Diagnostics Market Size (US$ Mn) & Y-o-Y Growth (%), 2017–2027
Figure 44: Eastern Europe Pneumonia Diagnostics Market Size (US$ Mn) Analysis, 2012–2016, by Streptococcus-based Segment
Figure 45: Eastern Europe Pneumonia Diagnostics Market Size (US$ Mn) & Y-o-Y Growth (%) (US$ Mn) Analysis, 2017–2027, by Streptococcus-based Segment
Figure 46: Eastern Europe Pneumonia Diagnostics Market Size (US$ Mn) Analysis, 2012–2016, by Legionella-based Segment
Figure 47: Eastern Europe Pneumonia Diagnostics Market Size (US$ Mn) & Y-o-Y Growth (%), 2017–2027, by Legionella-based Segment
Figure 48: Eastern Europe Pneumonia Diagnostics Market Size (US$ Mn) Analysis, 2012–2016, by Chlamydophila-based Segment
Figure 49: Eastern Europe Pneumonia Diagnostics Market Size (US$ Mn) & Y-o-Y Growth (%) (US$ Mn) Analysis, 2017–2027, by Chlamydophila-based Segment
Figure 50: Eastern Europe Pneumonia Diagnostics Market Size (US$ Mn) Analysis, 2012–2016, by Mycoplasma Pneumonia-based Segment
Figure 51: Eastern Europe Pneumonia Diagnostics Market Size (US$ Mn) & Y-o-Y Growth (%), 2017–2027, by Mycoplasma Pneumonia-based Segment
Figure 52: Eastern Europe Pneumonia Diagnostics Market Size (US$ Mn) Analysis, 2012–2016, by Viral Pneumonia-based Segment
Figure 53: Eastern Europe Pneumonia Diagnostics Market Size (US$ Mn) & Y-o-Y Growth (%), 2017–2027, by Viral Pneumonia-based Segment
Figure 54: Eastern Europe Pneumonia Diagnostics Market Attractiveness Analysis, 2017–2027, by Country
Figure 55: Eastern Europe Pneumonia Diagnostics Market Attractiveness Analysis, 2017–2027, by Country
Figure 56: Latin America Pneumonia Diagnostics Market Value Share By Product Type (2017)
Figure 57: Latin America Pneumonia Diagnostics Market Value Share By Country (2017)
Figure 58: Latin America Pneumonia Diagnostics Market Value Share
Figure 59: Latin America Pneumonia Diagnostics Market Size (US$ Mn) Analysis, 2012–2016
Figure 60: Latin America Pneumonia Diagnostics Market Size (US$ Mn) & Y-o-Y Growth (%), 2017–2027
Figure 61: Latin America Pneumonia Diagnostics Market Size (US$ Mn) Analysis, 2012–2016, by Streptococcus-based Segment
Figure 62: Latin America Pneumonia Diagnostics Market Size (US$ Mn) & Y-o-Y Growth (%) (US$ Mn) Analysis, 2017–2027, by Streptococcus-based Segment
Figure 63: Latin America Pneumonia Diagnostics Market Size (US$ Mn) Analysis, 2012–2016, by Legionella-based Segment
Figure 64: Latin America Pneumonia Diagnostics Market Size (US$ Mn) & Y-o-Y Growth (%), 2017–2027, by Legionella-based Segment
Figure 65: Latin America Pneumonia Diagnostics Market Size (US$ Mn) Analysis, 2012–2016, by Chlamydophila-based Segment
Figure 66: Latin America Pneumonia Diagnostics Market Size (US$ Mn) & Y-o-Y Growth (%) (US$ Mn) Analysis, 2017–2027, by Chlamydophila-based Segment
Figure 67: Latin America Pneumonia Diagnostics Market Size (US$ Mn) Analysis, 2012–2016, by Mycoplasma Pneumonia-based Segment
Figure 68: Latin America Pneumonia Diagnostics Market Size (US$ Mn) & Y-o-Y Growth (%), 2017–2027, by Mycoplasma Pneumonia-based Segment
Figure 69: Latin America Pneumonia Diagnostics Market Size (US$ Mn) Analysis, 2012–2016, by Viral Pneumonia-based Segment
Figure 70: Latin America Pneumonia Diagnostics Market Size (US$ Mn) & Y-o-Y Growth (%), 2017–2027, by Viral Pneumonia-based Segment
Figure 71: Latin America Pneumonia Diagnostics Market Attractiveness Analysis, 2017–2027, by Country
Figure 72: Latin America Pneumonia Diagnostics Market Attractiveness Analysis, 2017–2027, by Country
Figure 73: Asia Pacific Excluding Japan Pneumonia Diagnostics Market Value Share By Product Type (2017)
Figure 74: Asia Pacific Excluding Japan Pneumonia Diagnostics Market Value Share By Country (2017)
Figure 75: Asia Pacific Excluding Japan Pneumonia Diagnostics Market Value Share By End User (2017)
Figure 76: Asia Pacific Excluding Japan Pneumonia Diagnostics Market Size (US$ Mn) Analysis, 2012–2016
Figure 77: Asia Pacific Excluding Japan Pneumonia Diagnostics Market Size (US$ Mn) & Y-o-Y Growth (%), 2017–2027
Figure 78: Asia Pacific Excluding Japan Pneumonia Diagnostics Market Size (US$ Mn) Analysis, 2012–2016, by Streptococcus-based Segment
Figure 79: Asia Pacific Excluding Japan Pneumonia Diagnostics Market Size (US$ Mn) & Y-o-Y Growth (%) (US$ Mn) Analysis, 2017–2027, by Streptococcus-based Segment
Figure 80: Asia Pacific Excluding Japan Pneumonia Diagnostics Market Size (US$ Mn) Analysis, 2012–2016, by Legionella-based Segment
Figure 81: Asia Pacific Excluding Japan Pneumonia Diagnostics Market Size (US$ Mn) & Y-o-Y Growth (%), 2017–2027, by Legionella-based Segment
Figure 82: Asia Pacific Excluding Japan Pneumonia Diagnostics Market Size (US$ Mn) Analysis, 2012–2016, by Chlamydophila-based Segment
Figure 83: Asia Pacific Excluding Japan Pneumonia Diagnostics Market Size (US$ Mn) & Y-o-Y Growth (%) (US$ Mn) Analysis, 2017–2027, by Chlamydophila-based Segment
Figure 84: Asia Pacific Excluding Japan Pneumonia Diagnostics Market Size (US$ Mn) Analysis, 2012–2016, by Mycoplasma Pneumonia-based Segment
Figure 85: Asia Pacific Excluding Japan Pneumonia Diagnostics Market Size (US$ Mn) & Y-o-Y Growth (%), 2017–2027, by Mycoplasma Pneumonia-based Segment
Figure 86: Asia Pacific Excluding Japan Pneumonia Diagnostics Market Size (US$ Mn) Analysis, 2012–2016, by Viral Pneumonia-based Segment
Figure 87: Asia Pacific Excluding Japan Pneumonia Diagnostics Market Size (US$ Mn) & Y-o-Y Growth (%), 2017–2027, by Viral Pneumonia-based Segment
Figure 88: Asia Pacific Excluding Japan Pneumonia Diagnostics Market Attractiveness Analysis, 2017–2027, by Country
Figure 89: Asia Pacific Excluding Japan Pneumonia Diagnostics Market Attractiveness Analysis, 2017–2027, by Country
Figure 90: Japan Pneumonia Diagnostics Market Value Share By Product Type (2017)
Figure 91: Japan Pneumonia Diagnostics Market Value Share By End User (2017)
Figure 92: Japan Pneumonia Diagnostics Market Size (US$ Mn) Analysis, 2012–2016
Figure 93: Japan Pneumonia Diagnostics Market Size (US$ Mn) & Y-o-Y Growth (%), 2017–2027
Figure 94: Japan Pneumonia Diagnostics Market Size (US$ Mn) Analysis, 2012–2016, by Streptococcus-based Segment
Figure 95: Japan Pneumonia Diagnostics Market Size (US$ Mn) & Y-o-Y Growth (%) (US$ Mn) Analysis, 2017–2027, by Streptococcus-based Segment
Figure 96: Japan Pneumonia Diagnostics Market Size (US$ Mn) Analysis, 2012–2016, by Legionella-based Segment
Figure 97: Japan Pneumonia Diagnostics Market Size (US$ Mn) & Y-o-Y Growth (%), 2017–2027, by Legionella-based Segment
Figure 98: Japan Pneumonia Diagnostics Market Size (US$ Mn) Analysis, 2012–2016, by Chlamydophila-based Segment
Figure 99: Japan Pneumonia Diagnostics Market Size (US$ Mn) & Y-o-Y Growth (%) (US$ Mn) Analysis, 2017–2027, by Chlamydophila-based Segment
Figure 100: Japan Pneumonia Diagnostics Market Size (US$ Mn) Analysis, 2012–2016, by Mycoplasma Pneumonia-based Segment
Figure 101: Japan Pneumonia Diagnostics Market Size (US$ Mn) & Y-o-Y Growth (%), 2017–2027, by Mycoplasma Pneumonia-based Segment
Figure 102: Japan Pneumonia Diagnostics Market Size (US$ Mn) Analysis, 2012–2016, by Viral Pneumonia-based Segment
Figure 103: Japan Pneumonia Diagnostics Market Size (US$ Mn) & Y-o-Y Growth (%), 2017–2027, by Viral Pneumonia-based Segment
Figure 104: Japan Pneumonia Diagnostics Market Attractiveness Analysis, 2017–2027, by Product Type
Figure 105: Middle East & Africa Pneumonia Diagnostics Market Value Share By Product Type (2017)
Figure 106: Middle East & Africa Pneumonia Diagnostics Market Value Share By Country (2017)
Figure 107: Middle East & Africa Pneumonia Diagnostics Market Value Share By End User (2017)
Figure 108: Middle East & Africa Pneumonia Diagnostics Market Size (US$ Mn) Analysis, 2012–2016
Figure 109: Middle East & Africa Pneumonia Diagnostics Market Size (US$ Mn) & Y-o-Y Growth (%), 2017–2027
Figure 110: Middle East & Africa Pneumonia Diagnostics Market Size (US$ Mn) Analysis, 2012–2016, by Streptococcus-based Segment
Figure 111: Middle East & Africa Pneumonia Diagnostics Market Size (US$ Mn) & Y-o-Y Growth (%) (US$ Mn) Analysis, 2017–2027, by Streptococcus-based Segment
Figure 112: Middle East & Africa Pneumonia Diagnostics Market Size (US$ Mn) Analysis, 2012–2016, by Legionella-based Segment
Figure 113: Middle East & Africa Pneumonia Diagnostics Market Size (US$ Mn) & Y-o-Y Growth (%), 2017–2027, by Legionella-based Segment
Figure 114: Middle East & Africa Pneumonia Diagnostics Market Size (US$ Mn) Analysis, 2012–2016, by Chlamydophila-based Segment
Figure 115: Middle East & Africa Pneumonia Diagnostics Market Size (US$ Mn) & Y-o-Y Growth (%) (US$ Mn) Analysis, 2017–2027, by Chlamydophila-based Segment
Figure 116: Middle East & Africa Pneumonia Diagnostics Market Size (US$ Mn) Analysis, 2012–2016, by Mycoplasma Pneumonia-based Segment
Figure 117: Middle East & Africa Pneumonia Diagnostics Market Size (US$ Mn) & Y-o-Y Growth (%), 2017–2027, by Mycoplasma Pneumonia-based Segment
Figure 118: Middle East & Africa Pneumonia Diagnostics Market Size (US$ Mn) Analysis, 2012–2016, by Viral Pneumonia-based Segment
Figure 119: Middle East & Africa Pneumonia Diagnostics Market Size (US$ Mn) & Y-o-Y Growth (%), 2017–2027, by Viral Pneumonia-based Segment
Figure 120: Middle East & Africa Pneumonia Diagnostics Market Attractiveness Analysis, 2017–2027, by Country
Figure 121: Middle East & Africa Pneumonia Diagnostics Market Attractiveness Analysis, 2017–2027, by Country
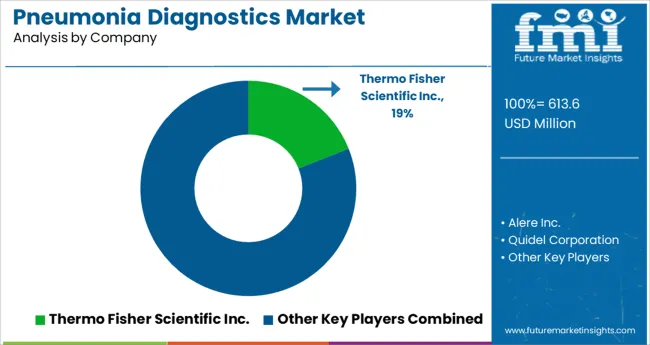
Figure 122: Global Pneumonia Diagnostic Market Share Analysis, 2016
Figure 123: Global Pneumonia Diagnostics Market Attractiveness Analysis by Region, 2017–2027
Figure 124: Global Pneumonia Diagnostics Market Attractiveness Analysis, 2017–2027, by Product Type
Figure 125: Global Pneumonia Diagnostics Market Value Analysis and Forecast, 2016–2027 (US$ Mn)
Figure 126: Global Pneumonia Diagnostics Market Absolute $ Opportunity (US$ Mn), 2012–2016
Figure 127: Global Pneumonia Diagnostics Market Absolute $ Opportunity (US$ Mn), 2016–2027
Need specific information?
Request CustomizationExplore Healthcare Insights
View Reports