Microbial Coagulants Market Forecast and Outlook 2025 to 2035

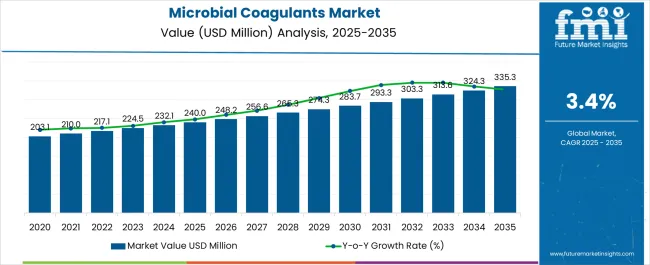
The microbial coagulants market is estimated to be valued at USD 240 million in 2025. It is projected to reach USD 335.3 million by 2035, registering a compound annual growth rate (CAGR) of 3.4% over the forecast period. An absolute dollar opportunity of USD 95.3 million is anticipated to be added during this time frame.
Quick Stats for Microbial Coagulants Market

  • Microbial Coagulants Market Value (2025): USD 240 million
  • Microbial Coagulants Market Forecast Value (2035): USD 335.3 million
  • Microbial Coagulants Market Forecast CAGR: 3.4%
  • Leading Segment in Microbial Coagulants Market in 2025: RhizomucorMiehei(45% market share)
  • Key Growth Regions in Microbial Coagulants Market: North America, Europe, Asia-Pacific
  • Top Key Players in Microbial Coagulants Market: DSM, Sacco System, DuPont Inc., Chr. Hansen, CSK Food Enrichment, Meito Sangyo Co., Ltd., BASF SE, SNF Group, Solenis, Kemira, Mitsubishi Chemical Holding Company

Microbial Coagulants Market

Metric Value
Estimated Size (2025E) USD 240 million
Projected Value (2035F) USD 335.3 million
CAGR (2025 to 2035) 3.4%

This growth reflects a 1.40times increase in market value. The microbial coagulants market expansion is expected to be driven by increasing demand for natural, safe, and effective coagulants in dairy and beverage industries, along with rising consumer preference for clean-label products.

By 2030, the market is expected to reach around USD 283.7 million, representing an incremental growth of USD 43.7million during the first half of the decade. The remaining increase of USD 51.6million is anticipated in the latter half, indicating a steady and balanced expansion pattern throughout the forecast period.

Companies such as Novozymes, DSM, and Chr. Hansen are strengthening their positions by investing heavily in research and development of novel microbial strains and scalable fermentation technologies. Strategic partnerships and expanded production capacities are enhancing supply chain resilience. These efforts enable compliance with rising industry standards, supporting the growing demand for sustainable, non-animal-derived microbial coagulants globally.

The market holds a significant yet specialized share within its parent markets. It represents approximately 10-12% of the broader dairy enzymes market, driven by its essential role in cheese production and fermented dairy products. Within the food enzymes market, microbial coagulants account for about 8-10%, reflecting growing demand for natural and sustainable processing aids. Their share in the industrial enzymes market is more niche, estimated at 5-7%, due to competition from other enzyme types used across industries. As part of the specialty food additives and biotechnological products markets, microbial coagulants contribute roughly 4-6%, benefiting from trends toward vegetarian and clean-label ingredients.

Recent developments in the microbial coagulants market include advancements in genetically engineered microbial strains offering enhanced coagulation efficiency and cost-effectiveness. Sustainability initiatives are promoting microbial coagulants as eco-friendly alternatives to animal-derived rennet. Rising consumer awareness regarding food safety and clean-label ingredients has accelerated innovation in fermentation technologies. Additionally, regulatory approvals in key regions are facilitating wider market adoption, while increasing dairy and beverage production further fuels demand.

Why is the Microbial Coagulants Market Growing?

The microbial coagulants market is being driven by increasing demand for natural and sustainable alternatives to animal-derived coagulants in the dairy and food industries. Growing consumer preference for clean-label and vegetarian-friendly products is further accelerating the adoption of microbial coagulants. Enhanced functional properties, such as improved coagulation efficiency and consistency, have made microbial coagulants a preferred choice for cheese production and other dairy applications.

Rising awareness about food safety and regulatory approvals for microbial enzymes is supporting market expansion globally. Additionally, technological advancements in fermentation and strain development are lowering production costs and increasing scalability. Market growth is also stimulated by expanding dairy and beverage sectors, especially in emerging economies, where demand for processed and specialty foods is growing rapidly.

Segmental Analysis

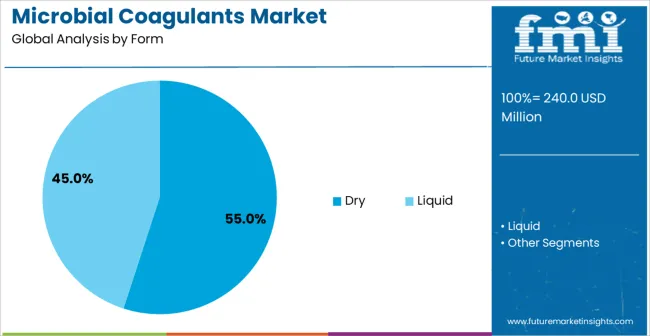
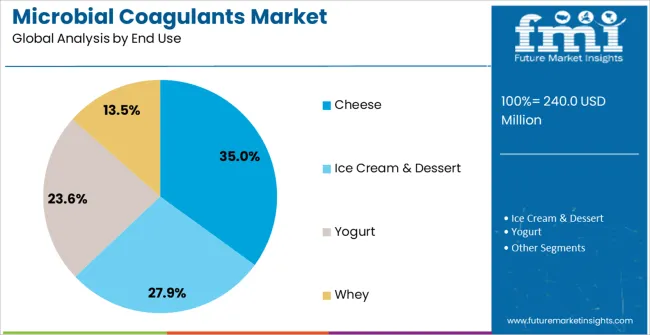
The market is segmented by form, source, end use, distribution channel, and region. By form, the market is bifurcated into dry and liquid. By source, the market is divided into Rhizophoromucormiehei, Cryphonectriaparasitica and Mucorpusillus. Based on end use, the market is classified into cheese, ice cream & dessert, yogurt, and whey. In terms of distribution channel, the market is divided into wholesale, and online retailers, supermarkets and specialty stores. Regionally, the market is categorized intoNorth America, Europe, Asia-Pacific, Latin America, Oceania and the Middle East & Africa.

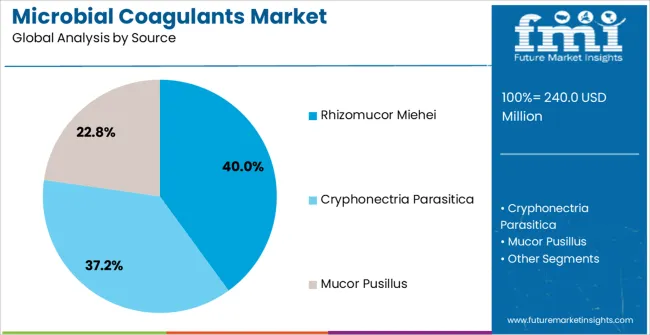
By Source, RhizomucorMiehei Segment Accounts for 45.0% of the Market Share

Microbial Coagulants Market By Source

Rhizomucormiehei remains the most lucrative microbial source, holding approximately 45.0% of the market share in 2025, driven by its proven efficacy and cost-effectiveness in coagulating milk proteins. Its enzymatic properties offer consistent coagulation performance, making it highly favored in cheese manufacturing and fermented dairy products. The microbial coagulants market growth is propelled by increased utilization of Rhizomucormiehei in premium and specialty cheeses, which require precise coagulation control to ensure product quality.

Advancements in fermentation processes and strain optimization have further enhanced yield and enzyme stability, lowering production costs and increasing adoption rates globally. Additionally, its vegetarian-friendly profile aligns with rising consumer preferences for plant-based and non-animal-derived ingredients, which supports market penetration across various dairy product categories.

By Distribution Channel, Wholesale Segment Accounts for 55.0% of the Market Share

Microbial Coagulants Market By Distribution

The wholesale distribution channel holds a dominant position in the microbial coagulants market, accounting for 55.0% of the market share in 2025. This dominance is attributed to bulk purchasing by large dairy manufacturers and food processors seeking cost efficiencies and consistent supply. Wholesale channels facilitate streamlined logistics and inventory management, supporting large-scale operations across key growth regions.

Growing industrial dairy production in emerging markets is fueling demand through wholesale channels, as manufacturers require high-volume supplies to meet escalating consumer demand for processed dairy and specialty food products. Wholesale distribution is also supported by strong partnerships between enzyme producers and dairy companies, enabling timely delivery and customized formulations. Technological integration in supply chain management is expected to further enhance the efficiency of wholesale channels in the coming years.

What are the Drivers, Restraints, and Key Trends of the Microbial Coagulants Market?

In 2024, the microbial coagulants market experienced robust growth driven by increasing demand from the dairy and specialty food industries. Microbial coagulants are widely adopted as sustainable and vegetarian-friendly alternatives to animal-derived rennet. Their application in cheese manufacturing and fermented dairy products supports the expansion of global dairy consumption, particularly in regions such as Asia-Pacific and Europe. Innovations in enzyme production, including fermentation technology improvements and strain optimization, have enhanced coagulation efficiency and lowered costs, making microbial coagulants more accessible for large-scale dairy processors. Rising consumer preference for clean-label and non-animal ingredients further bolsters market adoption.

Health and Sustainability Trends Drive Microbial Coagulants Adoption

Health and sustainability trends are key drivers encouraging microbial coagulant use. The shift toward plant-based diets and regulatory support for natural food processing aids has increased demand for microbial enzymes. Consumers increasingly prefer clean-label, vegetarian-friendly alternatives, reinforcing adoption in dairy and specialty food sectors. Advances in fermentation technology and strain development improve enzyme efficiency and cost-effectiveness, supporting wider industrial use. These factors together accelerate market growth amid rising global health consciousness and environmental awareness.

Production Complexity, Variability, and Regulatory Challenges Restrict Market Expansion

The microbial coagulants market faces restraints such as high production complexity, batch variability, and regulatory hurdles in certain regions. Variability in enzyme activity and stability can affect product consistency, requiring sophisticated quality controls that add to operational costs. Additionally, fluctuations in raw material availability for fermentation media may impact production scalability and pricing. Regulatory approvals can be time-consuming and region-specific, further limiting rapid market expansion. These constraints especially affect growth in price-sensitive markets and among smaller manufacturers.

Innovation in Genetic Engineering and Sustainable Production Drive Market Trends

Key trends shaping the microbial coagulants market include advancements in genetic engineering to develop superior microbial strains with enhanced yield and stability. Manufacturers are increasingly investing in sustainable production methods that reduce environmental footprints and improve process efficiencies. Strategic partnerships between enzyme producers and dairy manufacturers facilitate product innovation and faster market penetration. Furthermore, rising interest in artisanal and specialty cheeses offers new opportunities for tailored microbial coagulants delivering unique flavor and texture profiles, driving market diversification and growth.

Microbial Coagulants Market Analysis by Top Countries

Microbial Coagulants Market By Country

Countries CAGR (2025 to 2035)
Japan 7.8%
Germany 5.7%
France 5.2%
UK 4.8%
USA 4.4%

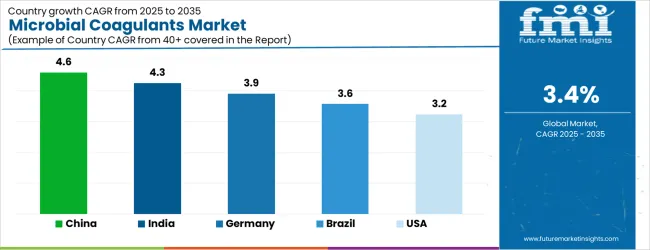
The microbial coagulants market growth rates vary across leading economies, with Japan showing the highest CAGR of 7.8% from 2025 to 2035, driven by innovation and demand for specialized dairy applications. Germany follows with a CAGR of 5.7%, supported by regulatory compliance and advanced enzyme technologies. France’s growth at 5.2% reflects rising artisanal cheese production and quality standards. The UK, at 4.8%, sees moderate expansion influenced by market access and supply chain factors. The USA demonstrates steady growth of 4.4%, backed by large-scale dairy processing and investment in enzyme research.

The report covers an in-depth analysis of 40+ countries; five top-performing OECD countries are highlighted below.

Market Expansion in the Microbial Coagulants Market in Japan

The microbial coagulants market in Japan is projected to grow at a CAGR of 7.8% from 2025 to 2035. This growth is fueled by rising demand for precision dairy fermentation, specialty cheeses, and clean-label enzymatic products. Urban centers such as Tokyo and Osaka are leading the adoption of advanced microbial coagulants in premium dairy and fermented food manufacturing. Aging demographics and health-conscious consumers are driving demand for high-quality, easily digestible dairy products enhanced by microbial enzymes.

Key Statistics

  • High adoption of genetically optimized strains for consistent coagulation
  • 35% of market value attributed to specialty dairy fermentation applications
  • Strong government support for enzyme innovation and food safety regulations

Innovation Leadership in the Microbial Coagulants Market in Germany

The sales of microbial coagulants are expected to witness a CAGR of 5.7% during 2025-2035. Growth is concentrated in regions such as Bavaria and North Rhine-Westphalia, driven by demand for functional dairy foods and compliance with stringent EU regulations. Investment in fermentation technology and microbial enzyme production capacity supports the development of clean-label and organic dairy products. Collaborative R&D efforts between industry and academia accelerate product innovation and quality enhancement.

Key Statistics

  • 42% of enzyme production is dedicated to cheese manufacturing applications
  • 68% compliance rate with EU organic certification standards
  • Approximately 500 R&D personnel focused on enzyme biotechnology

Market Development in the Microbial Coagulants Market in France

The demand for microbial coagulants in France is poised to flourish at a CAGR of 5.2% from 2025 to 2035. This is supported by increasing artisanal cheese production in regions like Normandy and Auvergne, which drives demand for specialized microbial enzymes. French dairy cooperatives emphasize product quality and natural processing aids to meet consumer expectations. Enhanced regulatory frameworks facilitate market access for microbial coagulants, fostering innovation in fermentation processes.

Key Statistics

  • 30% of microbial coagulants used in artisanal cheese production
  • 20% annual increase in microbial enzyme applications in dairy processing
  • 40 collaborative projects involving local producers and enzyme manufacturers

Growth Assessment for Microbial Coagulants Market in the United Kingdom

The revenue from microbial coagulants in the UK is forecasted to rise at a CAGR of 4.8% from 2025 to 2035. Growth drivers include demand for functional dairy products and increasing investments in enzyme-based food processing technologies. Challenges remain due to post-Brexit supply chain adjustments and higher costs of imported microbial enzymes. However, rising health trends and specialty cheese production offer market opportunities in London, Manchester, and Edinburgh.

Key Statistics

  • 55% of microbial coagulants are distributed via wholesale channels
  • 25% increase in enzyme use in premium dairy segments
  • £1.2 million invested in enzyme innovation hubs in 2024

Market Expansion in the Microbial Coagulants Market in the United States

The microbial coagulants market in the USA is estimated to grow at a CAGR of 4.4% from 2025 to 2035. This moderate growth is driven by demand from industrial dairy processing and innovation in enzyme technologies. Key production centers in California, Wisconsin, and New York focus on scaling microbial coagulant output for cheese and fermented product manufacturing. Strong export markets and regulatory support for non-animal coagulants further sustain growth momentum.

Key Statistics

  • 60% of microbial coagulants consumed in cheese manufacturing
  • $150 million invested in enzyme R&D facilities across five states in 2024
  • Increasing adoption of fermentation-derived coagulants in functional food sectors

Competitive Landscape of Microbial Coagulants Market

Microbial Coagulants Market By Company

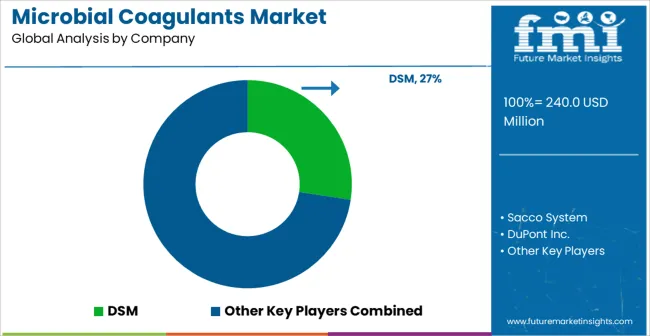
The microbial coagulants market is moderately consolidated, comprising leading global enzyme producers, specialized biotechnology firms, and regional manufacturers with varying expertise in fermentation technology, enzyme optimization, and application-specific solutions. Companies such as Novozymes, Chr. Hansen and DSM dominate the enzyme-based microbial coagulant segment by leveraging advanced microbial strain development and scalable production capabilities. Their strengths lie in robust R&D investments, extensive fermentation infrastructure, and well-established partnerships with major dairy producers worldwide, enabling supply chain resilience and product customization for diverse dairy and specialty food applications.

Mid-sized players like Amano Enzyme Inc. and Advanced Enzyme Technologies differentiate themselves through niche product offerings, proprietary fermentation processes, and regional market penetration strategies focused on Asia-Pacific and Europe. These companies emphasize sustainable enzyme production, regulatory compliance, and innovative formulations tailored to clean-label and vegetarian-friendly dairy products. Strategic collaborations with academic institutions and food manufacturers facilitate ongoing product development and quality assurance.

Significant entry barriers persist due to the complexity of microbial enzyme production, stringent regulatory frameworks, and the need for advanced quality control to ensure batch-to-batch consistency. Competitive advantage increasingly depends on enzymatic activity optimization, process scalability, and compliance with international food safety standards. Market players are prioritizing innovation in genetic engineering, sustainable bioprocessing, and expanding application scope to maintain leadership in this evolving landscape.

Scope of Report

Item Value
Quantitative Units USD 240 million
Form Dry, Liquid
Source Rhizomucor miehei, Cryphonectria parasitica, Mucor Pusillus
End Use Cheese, Ice Cream & Dessert, Yogurt, Whey
Distribution Channel Wholesale, Online Retailers, Supermarkets, Specialty Stores
Regions Covered North America, Europe, Asia-Pacific, Latin America, Oceania, Middle East & Africa
Countries Covered United States, Canada, United Kingdom, Germany, France, China, Japan, South Korea, Brazil, Australia and 40+ countries
Key Companies Profiled DSM, Sacco System, DuPont Inc., Chr. Hansen, CSK Food Enrichment, Meito Sangyo Co., Ltd., BASF SE, SNF Group, Solenis, Kemira, Mitsubishi Chemical Holding Company
Additional Attributes Dollar sales by application and purity grade, regional demand trends, competitive landscape, consumer preferences for natural versus synthetic alternatives, integration with responsible sourcing practices, innovations in extraction technology and quality standardization for diverse industrial applications

Key Segments

By Form:

  • Dry
  • Liquid

By Source:

  • Rhizomucor miehei
  • Cryphonectria parasitica
  • Mucor Pusillus

By End Use:

  • Cheese
  • Ice Cream & Dessert
  • Yogurt
  • Whey

By Distribution:

  • Wholesale
  • Online Retailers
  • Supermarkets
  • Specialty Stores

By Region:

  • North America
  • Latin America
  • Western Europe
  • Eastern Europe
  • East Asia
  • South Asia & Pacific
  • Middle East and Africa

Table of Content

  1. Executive Summary
    • Global Market Outlook
    • Demand-side Trends
    • Supply-side Trends
    • Technology Roadmap Analysis
    • Analysis and Recommendations
  2. Market Overview
    • Market Coverage / Taxonomy
    • Market Definition / Scope / Limitations
  3. Market Background
    • Market Dynamics
      • Drivers
      • Restraints
      • Opportunity
      • Trends
    • Scenario Forecast
      • Demand in Optimistic Scenario
      • Demand in Likely Scenario
      • Demand in Conservative Scenario
    • Opportunity Map Analysis
    • Product Life Cycle Analysis
    • Supply Chain Analysis
      • Supply Side Participants and their Roles
        • Producers
        • Mid-Level Participants (Traders/ Agents/ Brokers)
        • Wholesalers and Distributors
      • Value Added and Value Created at Node in the Supply Chain
      • List of Raw Material Suppliers
      • List of Existing and Potential Buyer’s
    • Investment Feasibility Matrix
    • Value Chain Analysis
      • Profit Margin Analysis
      • Wholesalers and Distributors
      • Retailers
    • PESTLE and Porter’s Analysis
    • Regulatory Landscape
      • By Key Regions
      • By Key Countries
    • Regional Parent Market Outlook
    • Production and Consumption Statistics
    • Import and Export Statistics
  4. Global Market Analysis 2020 to 2024 and Forecast, 2025 to 2035
    • Historical Market Size Value (USD Million) & Volume (Metric Tons) Analysis, 2020 to 2024
    • Current and Future Market Size Value (USD Million) & Volume (Metric Tons) Projections, 2025 to 2035
      • Y-o-Y Growth Trend Analysis
      • Absolute $ Opportunity Analysis
  5. Global Market Pricing Analysis 2020 to 2024 and Forecast 2025 to 2035
  6. Global Market Analysis 2020 to 2024 and Forecast 2025 to 2035, By Form
    • Introduction / Key Findings
    • Historical Market Size Value (USD Million) & Volume (Metric Tons) Analysis By Form, 2020 to 2024
    • Current and Future Market Size Value (USD Million) & Volume (Metric Tons) Analysis and Forecast By Form, 2025 to 2035
      • Dry
      • Liquid
    • Y-o-Y Growth Trend Analysis By Form, 2020 to 2024
    • Absolute $ Opportunity Analysis By Form, 2025 to 2035
  7. Global Market Analysis 2020 to 2024 and Forecast 2025 to 2035, By Source
    • Introduction / Key Findings
    • Historical Market Size Value (USD Million) & Volume (Metric Tons) Analysis By Source, 2020 to 2024
    • Current and Future Market Size Value (USD Million) & Volume (Metric Tons) Analysis and Forecast By Source, 2025 to 2035
      • Rhizomucor miehei
      • Cryphonectria parasitica
      • Mucor Pusillus
    • Y-o-Y Growth Trend Analysis By Source, 2020 to 2024
    • Absolute $ Opportunity Analysis By Source, 2025 to 2035
  8. Global Market Analysis 2020 to 2024 and Forecast 2025 to 2035, By End Use
    • Introduction / Key Findings
    • Historical Market Size Value (USD Million) & Volume (Metric Tons) Analysis By End Use, 2020 to 2024
    • Current and Future Market Size Value (USD Million) & Volume (Metric Tons) Analysis and Forecast By End Use, 2025 to 2035
      • Cheese
      • Ice Cream & Dessert
      • Yogurt
      • Whey
    • Y-o-Y Growth Trend Analysis By End Use, 2020 to 2024
    • Absolute $ Opportunity Analysis By End Use, 2025 to 2035
  9. Global Market Analysis 2020 to 2024 and Forecast 2025 to 2035, By Distribution
    • Introduction / Key Findings
    • Historical Market Size Value (USD Million) & Volume (Metric Tons) Analysis By Distribution, 2020 to 2024
    • Current and Future Market Size Value (USD Million) & Volume (Metric Tons) Analysis and Forecast By Distribution, 2025 to 2035
      • Wholesale
      • Online Retailers
      • Supermarkets
      • Specialty Stores
    • Y-o-Y Growth Trend Analysis By Distribution, 2020 to 2024
    • Absolute $ Opportunity Analysis By Distribution, 2025 to 2035
  10. Global Market Analysis 2020 to 2024 and Forecast 2025 to 2035, By Region
    • Introduction
    • Historical Market Size Value (USD Million) & Volume (Metric Tons) Analysis By Region, 2020 to 2024
    • Current Market Size Value (USD Million) & Volume (Metric Tons) Analysis and Forecast By Region, 2025 to 2035
      • North America
      • Latin America
      • Western Europe
      • Eastern Europe
      • East Asia
      • South Asia & Pacific
      • Middle East and Africa
    • Market Attractiveness Analysis By Region
  11. North America Market Analysis 2020 to 2024 and Forecast 2025 to 2035, By Country
    • Historical Market Size Value (USD Million) & Volume (Metric Tons) Trend Analysis By Market Taxonomy, 2020 to 2024
    • Market Size Value (USD Million) & Volume (Metric Tons) Forecast By Market Taxonomy, 2025 to 2035
      • By Country
        • USA
        • Canada
        • Mexico
      • By Form
      • By Source
      • By End Use
      • By Distribution
    • Market Attractiveness Analysis
      • By Country
      • By Form
      • By Source
      • By End Use
      • By Distribution
    • Key Takeaways
  12. Latin America Market Analysis 2020 to 2024 and Forecast 2025 to 2035, By Country
    • Historical Market Size Value (USD Million) & Volume (Metric Tons) Trend Analysis By Market Taxonomy, 2020 to 2024
    • Market Size Value (USD Million) & Volume (Metric Tons) Forecast By Market Taxonomy, 2025 to 2035
      • By Country
        • Brazil
        • Argentina
        • Rest of LATAM
      • By Form
      • By Source
      • By End Use
      • By Distribution
    • Market Attractiveness Analysis
      • By Country
      • By Form
      • By Source
      • By End Use
      • By Distribution
    • Key Takeaways
  13. Western Europe Market Analysis 2020 to 2024 and Forecast 2025 to 2035, By Country
    • Historical Market Size Value (USD Million) & Volume (Metric Tons) Trend Analysis By Market Taxonomy, 2020 to 2024
    • Market Size Value (USD Million) & Volume (Metric Tons) Forecast By Market Taxonomy, 2025 to 2035
      • By Country
        • Germany
        • Italy
        • France
        • UK
        • Spain
        • BENELUX
        • Nordic
        • Rest of W.Europe
      • By Form
      • By Source
      • By End Use
      • By Distribution
    • Market Attractiveness Analysis
      • By Country
      • By Form
      • By Source
      • By End Use
      • By Distribution
    • Key Takeaways
  14. Eastern Europe Market Analysis 2020 to 2024 and Forecast 2025 to 2035, By Country
    • Historical Market Size Value (USD Million) & Volume (Metric Tons) Trend Analysis By Market Taxonomy, 2020 to 2024
    • Market Size Value (USD Million) & Volume (Metric Tons) Forecast By Market Taxonomy, 2025 to 2035
      • By Country
        • Russia
        • Hungary
        • Poland
        • Balkan & Baltics
        • Rest of E. Europe
      • By Form
      • By Source
      • By End Use
      • By Distribution
    • Market Attractiveness Analysis
      • By Country
      • By Form
      • By Source
      • By End Use
      • By Distribution
    • Key Takeaways
  15. East Asia Market Analysis 2020 to 2024 and Forecast 2025 to 2035, By Country
    • Historical Market Size Value (USD Million) & Volume (Metric Tons) Trend Analysis By Market Taxonomy, 2020 to 2024
    • Market Size Value (USD Million) & Volume (Metric Tons) Forecast By Market Taxonomy, 2025 to 2035
      • By Country
        • China
        • Japan
        • South Korea
      • By Form
      • By Source
      • By End Use
      • By Distribution
    • Market Attractiveness Analysis
      • By Country
      • By Form
      • By Source
      • By End Use
      • By Distribution
    • Key Takeaways
  16. South Asia & Pacific Market Analysis 2020 to 2024 and Forecast 2025 to 2035, By Country
    • Historical Market Size Value (USD Million) & Volume (Metric Tons) Trend Analysis By Market Taxonomy, 2020 to 2024
    • Market Size Value (USD Million) & Volume (Metric Tons) Forecast By Market Taxonomy, 2025 to 2035
      • By Country
        • India
        • Australia & New Zealand
        • ASEAN
        • Rest of SAP
      • By Form
      • By Source
      • By End Use
      • By Distribution
    • Market Attractiveness Analysis
      • By Country
      • By Form
      • By Source
      • By End Use
      • By Distribution
    • Key Takeaways
  17. Middle East and Africa Market Analysis 2020 to 2024 and Forecast 2025 to 2035, By Country
    • Historical Market Size Value (USD Million) & Volume (Metric Tons) Trend Analysis By Market Taxonomy, 2020 to 2024
    • Market Size Value (USD Million) & Volume (Metric Tons) Forecast By Market Taxonomy, 2025 to 2035
      • By Country
        • GCC Countries
        • Northern Africa
        • South Africa
        • Turkiye
        • Rest of MEA
      • By Form
      • By Source
      • By End Use
      • By Distribution
    • Market Attractiveness Analysis
      • By Country
      • By Form
      • By Source
      • By End Use
      • By Distribution
    • Key Takeaways
  18. Key Countries Market Analysis
    • USA
      • Pricing Analysis
      • Market Share Analysis, 2024
        • By Form
        • By Source
        • By End Use
        • By Distribution
    • Canada
      • Pricing Analysis
      • Market Share Analysis, 2024
        • By Form
        • By Source
        • By End Use
        • By Distribution
    • Brazil
      • Pricing Analysis
      • Market Share Analysis, 2024
        • By Form
        • By Source
        • By End Use
        • By Distribution
    • Mexico
      • Pricing Analysis
      • Market Share Analysis, 2024
        • By Form
        • By Source
        • By End Use
        • By Distribution
    • Argentina
      • Pricing Analysis
      • Market Share Analysis, 2024
        • By Form
        • By Source
        • By End Use
        • By Distribution
  19. Market Structure Analysis
    • Competition Dashboard
    • Competition Benchmarking
    • Market Share Analysis of Top Players
      • By Regional
      • By Form
      • By Source
      • By End Use
      • By Distribution
  20. Competition Analysis
    • Competition Deep Dive
      • DSM
        • Overview
        • Product Portfolio
        • Profitability by Market Segments (Product/Age /Sales Channel/Region)
        • Sales Footprint
        • Strategy Overview
          • Marketing Strategy
          • Product Strategy
          • Channel Strategy
      • Sacco System
        • Overview
        • Product Portfolio
        • Profitability by Market Segments (Product/Age /Sales Channel/Region)
        • Sales Footprint
        • Strategy Overview
          • Marketing Strategy
          • Product Strategy
          • Channel Strategy
      • DuPont Inc.
        • Overview
        • Product Portfolio
        • Profitability by Market Segments (Product/Age /Sales Channel/Region)
        • Sales Footprint
        • Strategy Overview
          • Marketing Strategy
          • Product Strategy
          • Channel Strategy
      • Chr. Hansen
        • Overview
        • Product Portfolio
        • Profitability by Market Segments (Product/Age /Sales Channel/Region)
        • Sales Footprint
        • Strategy Overview
          • Marketing Strategy
          • Product Strategy
          • Channel Strategy
      • CSK Food Enrichment
        • Overview
        • Product Portfolio
        • Profitability by Market Segments (Product/Age /Sales Channel/Region)
        • Sales Footprint
        • Strategy Overview
          • Marketing Strategy
          • Product Strategy
          • Channel Strategy
      • Meito Sangyo Co. Ltd.
        • Overview
        • Product Portfolio
        • Profitability by Market Segments (Product/Age /Sales Channel/Region)
        • Sales Footprint
        • Strategy Overview
          • Marketing Strategy
          • Product Strategy
          • Channel Strategy
      • BASF SE
        • Overview
        • Product Portfolio
        • Profitability by Market Segments (Product/Age /Sales Channel/Region)
        • Sales Footprint
        • Strategy Overview
          • Marketing Strategy
          • Product Strategy
          • Channel Strategy
      • SNF Group
        • Overview
        • Product Portfolio
        • Profitability by Market Segments (Product/Age /Sales Channel/Region)
        • Sales Footprint
        • Strategy Overview
          • Marketing Strategy
          • Product Strategy
          • Channel Strategy
      • Solenis
        • Overview
        • Product Portfolio
        • Profitability by Market Segments (Product/Age /Sales Channel/Region)
        • Sales Footprint
        • Strategy Overview
          • Marketing Strategy
          • Product Strategy
          • Channel Strategy
      • Kemira
        • Overview
        • Product Portfolio
        • Profitability by Market Segments (Product/Age /Sales Channel/Region)
        • Sales Footprint
        • Strategy Overview
          • Marketing Strategy
          • Product Strategy
          • Channel Strategy
      • Mitsubishi Chemical Holding Company
        • Overview
        • Product Portfolio
        • Profitability by Market Segments (Product/Age /Sales Channel/Region)
        • Sales Footprint
        • Strategy Overview
          • Marketing Strategy
          • Product Strategy
          • Channel Strategy
  21. Assumptions & Acronyms Used
  22. Research Methodology

List of Tables

  • Table 1: Global Market Value (USD Million) Forecast by Region, 2020-2035
  • Table 2: Global Market Volume (Metric Tons) Forecast by Region, 2020-2035
  • Table 3: Global Market Value (USD Million) Forecast by Form, 2020-2035
  • Table 4: Global Market Volume (Metric Tons) Forecast by Form, 2020-2035
  • Table 5: Global Market Value (USD Million) Forecast by Source, 2020-2035
  • Table 6: Global Market Volume (Metric Tons) Forecast by Source, 2020-2035
  • Table 7: Global Market Value (USD Million) Forecast by End Use, 2020-2035
  • Table 8: Global Market Volume (Metric Tons) Forecast by End Use, 2020-2035
  • Table 9: Global Market Value (USD Million) Forecast by Distribution, 2020-2035
  • Table 10: Global Market Volume (Metric Tons) Forecast by Distribution, 2020-2035
  • Table 11: North America Market Value (USD Million) Forecast by Country, 2020-2035
  • Table 12: North America Market Volume (Metric Tons) Forecast by Country, 2020-2035
  • Table 13: North America Market Value (USD Million) Forecast by Form, 2020-2035
  • Table 14: North America Market Volume (Metric Tons) Forecast by Form, 2020-2035
  • Table 15: North America Market Value (USD Million) Forecast by Source, 2020-2035
  • Table 16: North America Market Volume (Metric Tons) Forecast by Source, 2020-2035
  • Table 17: North America Market Value (USD Million) Forecast by End Use, 2020-2035
  • Table 18: North America Market Volume (Metric Tons) Forecast by End Use, 2020-2035
  • Table 19: North America Market Value (USD Million) Forecast by Distribution, 2020-2035
  • Table 20: North America Market Volume (Metric Tons) Forecast by Distribution, 2020-2035
  • Table 21: Latin America Market Value (USD Million) Forecast by Country, 2020-2035
  • Table 22: Latin America Market Volume (Metric Tons) Forecast by Country, 2020-2035
  • Table 23: Latin America Market Value (USD Million) Forecast by Form, 2020-2035
  • Table 24: Latin America Market Volume (Metric Tons) Forecast by Form, 2020-2035
  • Table 25: Latin America Market Value (USD Million) Forecast by Source, 2020-2035
  • Table 26: Latin America Market Volume (Metric Tons) Forecast by Source, 2020-2035
  • Table 27: Latin America Market Value (USD Million) Forecast by End Use, 2020-2035
  • Table 28: Latin America Market Volume (Metric Tons) Forecast by End Use, 2020-2035
  • Table 29: Latin America Market Value (USD Million) Forecast by Distribution, 2020-2035
  • Table 30: Latin America Market Volume (Metric Tons) Forecast by Distribution, 2020-2035
  • Table 31: Western Europe Market Value (USD Million) Forecast by Country, 2020-2035
  • Table 32: Western Europe Market Volume (Metric Tons) Forecast by Country, 2020-2035
  • Table 33: Western Europe Market Value (USD Million) Forecast by Form, 2020-2035
  • Table 34: Western Europe Market Volume (Metric Tons) Forecast by Form, 2020-2035
  • Table 35: Western Europe Market Value (USD Million) Forecast by Source, 2020-2035
  • Table 36: Western Europe Market Volume (Metric Tons) Forecast by Source, 2020-2035
  • Table 37: Western Europe Market Value (USD Million) Forecast by End Use, 2020-2035
  • Table 38: Western Europe Market Volume (Metric Tons) Forecast by End Use, 2020-2035
  • Table 39: Western Europe Market Value (USD Million) Forecast by Distribution, 2020-2035
  • Table 40: Western Europe Market Volume (Metric Tons) Forecast by Distribution, 2020-2035
  • Table 41: Eastern Europe Market Value (USD Million) Forecast by Country, 2020-2035
  • Table 42: Eastern Europe Market Volume (Metric Tons) Forecast by Country, 2020-2035
  • Table 43: Eastern Europe Market Value (USD Million) Forecast by Form, 2020-2035
  • Table 44: Eastern Europe Market Volume (Metric Tons) Forecast by Form, 2020-2035
  • Table 45: Eastern Europe Market Value (USD Million) Forecast by Source, 2020-2035
  • Table 46: Eastern Europe Market Volume (Metric Tons) Forecast by Source, 2020-2035
  • Table 47: Eastern Europe Market Value (USD Million) Forecast by End Use, 2020-2035
  • Table 48: Eastern Europe Market Volume (Metric Tons) Forecast by End Use, 2020-2035
  • Table 49: Eastern Europe Market Value (USD Million) Forecast by Distribution, 2020-2035
  • Table 50: Eastern Europe Market Volume (Metric Tons) Forecast by Distribution, 2020-2035
  • Table 51: East Asia Market Value (USD Million) Forecast by Country, 2020-2035
  • Table 52: East Asia Market Volume (Metric Tons) Forecast by Country, 2020-2035
  • Table 53: East Asia Market Value (USD Million) Forecast by Form, 2020-2035
  • Table 54: East Asia Market Volume (Metric Tons) Forecast by Form, 2020-2035
  • Table 55: East Asia Market Value (USD Million) Forecast by Source, 2020-2035
  • Table 56: East Asia Market Volume (Metric Tons) Forecast by Source, 2020-2035
  • Table 57: East Asia Market Value (USD Million) Forecast by End Use, 2020-2035
  • Table 58: East Asia Market Volume (Metric Tons) Forecast by End Use, 2020-2035
  • Table 59: East Asia Market Value (USD Million) Forecast by Distribution, 2020-2035
  • Table 60: East Asia Market Volume (Metric Tons) Forecast by Distribution, 2020-2035
  • Table 61: South Asia & Pacific Market Value (USD Million) Forecast by Country, 2020-2035
  • Table 62: South Asia & Pacific Market Volume (Metric Tons) Forecast by Country, 2020-2035
  • Table 63: South Asia & Pacific Market Value (USD Million) Forecast by Form, 2020-2035
  • Table 64: South Asia & Pacific Market Volume (Metric Tons) Forecast by Form, 2020-2035
  • Table 65: South Asia & Pacific Market Value (USD Million) Forecast by Source, 2020-2035
  • Table 66: South Asia & Pacific Market Volume (Metric Tons) Forecast by Source, 2020-2035
  • Table 67: South Asia & Pacific Market Value (USD Million) Forecast by End Use, 2020-2035
  • Table 68: South Asia & Pacific Market Volume (Metric Tons) Forecast by End Use, 2020-2035
  • Table 69: South Asia & Pacific Market Value (USD Million) Forecast by Distribution, 2020-2035
  • Table 70: South Asia & Pacific Market Volume (Metric Tons) Forecast by Distribution, 2020-2035
  • Table 71: Middle East and Africa Market Value (USD Million) Forecast by Country, 2020-2035
  • Table 72: Middle East and Africa Market Volume (Metric Tons) Forecast by Country, 2020-2035
  • Table 73: Middle East and Africa Market Value (USD Million) Forecast by Form, 2020-2035
  • Table 74: Middle East and Africa Market Volume (Metric Tons) Forecast by Form, 2020-2035
  • Table 75: Middle East and Africa Market Value (USD Million) Forecast by Source, 2020-2035
  • Table 76: Middle East and Africa Market Volume (Metric Tons) Forecast by Source, 2020-2035
  • Table 77: Middle East and Africa Market Value (USD Million) Forecast by End Use, 2020-2035
  • Table 78: Middle East and Africa Market Volume (Metric Tons) Forecast by End Use, 2020-2035
  • Table 79: Middle East and Africa Market Value (USD Million) Forecast by Distribution, 2020-2035
  • Table 80: Middle East and Africa Market Volume (Metric Tons) Forecast by Distribution, 2020-2035

List of Figures

  • Figure 1: Global Market Volume (Metric Tons) Forecast 2020-2035
  • Figure 2: Global Market Pricing Analysis
  • Figure 3: Global Market Value (USD Million) Forecast 2020-2035
  • Figure 4: Global Market Value Share and BPS Analysis by Form, 2025 and 2035
  • Figure 5: Global Market Y-o-Y Growth Comparison by Form, 2025-2035
  • Figure 6: Global Market Attractiveness Analysis by Form
  • Figure 7: Global Market Value Share and BPS Analysis by Source, 2025 and 2035
  • Figure 8: Global Market Y-o-Y Growth Comparison by Source, 2025-2035
  • Figure 9: Global Market Attractiveness Analysis by Source
  • Figure 10: Global Market Value Share and BPS Analysis by End Use, 2025 and 2035
  • Figure 11: Global Market Y-o-Y Growth Comparison by End Use, 2025-2035
  • Figure 12: Global Market Attractiveness Analysis by End Use
  • Figure 13: Global Market Value Share and BPS Analysis by Distribution, 2025 and 2035
  • Figure 14: Global Market Y-o-Y Growth Comparison by Distribution, 2025-2035
  • Figure 15: Global Market Attractiveness Analysis by Distribution
  • Figure 16: Global Market Value (USD Million) Share and BPS Analysis by Region, 2025 and 2035
  • Figure 17: Global Market Y-o-Y Growth Comparison by Region, 2025-2035
  • Figure 18: Global Market Attractiveness Analysis by Region
  • Figure 19: North America Market Incremental $ Opportunity, 2025-2035
  • Figure 20: Latin America Market Incremental $ Opportunity, 2025-2035
  • Figure 21: Western Europe Market Incremental $ Opportunity, 2025-2035
  • Figure 22: Eastern Europe Market Incremental $ Opportunity, 2025-2035
  • Figure 23: East Asia Market Incremental $ Opportunity, 2025-2035
  • Figure 24: South Asia & Pacific Market Incremental $ Opportunity, 2025-2035
  • Figure 25: Middle East and Africa Market Incremental $ Opportunity, 2025-2035
  • Figure 26: North America Market Value Share and BPS Analysis by Country, 2025 and 2035
  • Figure 27: North America Market Value Share and BPS Analysis by Form, 2025 and 2035
  • Figure 28: North America Market Y-o-Y Growth Comparison by Form, 2025-2035
  • Figure 29: North America Market Attractiveness Analysis by Form
  • Figure 30: North America Market Value Share and BPS Analysis by Source, 2025 and 2035
  • Figure 31: North America Market Y-o-Y Growth Comparison by Source, 2025-2035
  • Figure 32: North America Market Attractiveness Analysis by Source
  • Figure 33: North America Market Value Share and BPS Analysis by End Use, 2025 and 2035
  • Figure 34: North America Market Y-o-Y Growth Comparison by End Use, 2025-2035
  • Figure 35: North America Market Attractiveness Analysis by End Use
  • Figure 36: North America Market Value Share and BPS Analysis by Distribution, 2025 and 2035
  • Figure 37: North America Market Y-o-Y Growth Comparison by Distribution, 2025-2035
  • Figure 38: North America Market Attractiveness Analysis by Distribution
  • Figure 39: Latin America Market Value Share and BPS Analysis by Country, 2025 and 2035
  • Figure 40: Latin America Market Value Share and BPS Analysis by Form, 2025 and 2035
  • Figure 41: Latin America Market Y-o-Y Growth Comparison by Form, 2025-2035
  • Figure 42: Latin America Market Attractiveness Analysis by Form
  • Figure 43: Latin America Market Value Share and BPS Analysis by Source, 2025 and 2035
  • Figure 44: Latin America Market Y-o-Y Growth Comparison by Source, 2025-2035
  • Figure 45: Latin America Market Attractiveness Analysis by Source
  • Figure 46: Latin America Market Value Share and BPS Analysis by End Use, 2025 and 2035
  • Figure 47: Latin America Market Y-o-Y Growth Comparison by End Use, 2025-2035
  • Figure 48: Latin America Market Attractiveness Analysis by End Use
  • Figure 49: Latin America Market Value Share and BPS Analysis by Distribution, 2025 and 2035
  • Figure 50: Latin America Market Y-o-Y Growth Comparison by Distribution, 2025-2035
  • Figure 51: Latin America Market Attractiveness Analysis by Distribution
  • Figure 52: Western Europe Market Value Share and BPS Analysis by Country, 2025 and 2035
  • Figure 53: Western Europe Market Value Share and BPS Analysis by Form, 2025 and 2035
  • Figure 54: Western Europe Market Y-o-Y Growth Comparison by Form, 2025-2035
  • Figure 55: Western Europe Market Attractiveness Analysis by Form
  • Figure 56: Western Europe Market Value Share and BPS Analysis by Source, 2025 and 2035
  • Figure 57: Western Europe Market Y-o-Y Growth Comparison by Source, 2025-2035
  • Figure 58: Western Europe Market Attractiveness Analysis by Source
  • Figure 59: Western Europe Market Value Share and BPS Analysis by End Use, 2025 and 2035
  • Figure 60: Western Europe Market Y-o-Y Growth Comparison by End Use, 2025-2035
  • Figure 61: Western Europe Market Attractiveness Analysis by End Use
  • Figure 62: Western Europe Market Value Share and BPS Analysis by Distribution, 2025 and 2035
  • Figure 63: Western Europe Market Y-o-Y Growth Comparison by Distribution, 2025-2035
  • Figure 64: Western Europe Market Attractiveness Analysis by Distribution
  • Figure 65: Eastern Europe Market Value Share and BPS Analysis by Country, 2025 and 2035
  • Figure 66: Eastern Europe Market Value Share and BPS Analysis by Form, 2025 and 2035
  • Figure 67: Eastern Europe Market Y-o-Y Growth Comparison by Form, 2025-2035
  • Figure 68: Eastern Europe Market Attractiveness Analysis by Form
  • Figure 69: Eastern Europe Market Value Share and BPS Analysis by Source, 2025 and 2035
  • Figure 70: Eastern Europe Market Y-o-Y Growth Comparison by Source, 2025-2035
  • Figure 71: Eastern Europe Market Attractiveness Analysis by Source
  • Figure 72: Eastern Europe Market Value Share and BPS Analysis by End Use, 2025 and 2035
  • Figure 73: Eastern Europe Market Y-o-Y Growth Comparison by End Use, 2025-2035
  • Figure 74: Eastern Europe Market Attractiveness Analysis by End Use
  • Figure 75: Eastern Europe Market Value Share and BPS Analysis by Distribution, 2025 and 2035
  • Figure 76: Eastern Europe Market Y-o-Y Growth Comparison by Distribution, 2025-2035
  • Figure 77: Eastern Europe Market Attractiveness Analysis by Distribution
  • Figure 78: East Asia Market Value Share and BPS Analysis by Country, 2025 and 2035
  • Figure 79: East Asia Market Value Share and BPS Analysis by Form, 2025 and 2035
  • Figure 80: East Asia Market Y-o-Y Growth Comparison by Form, 2025-2035
  • Figure 81: East Asia Market Attractiveness Analysis by Form
  • Figure 82: East Asia Market Value Share and BPS Analysis by Source, 2025 and 2035
  • Figure 83: East Asia Market Y-o-Y Growth Comparison by Source, 2025-2035
  • Figure 84: East Asia Market Attractiveness Analysis by Source
  • Figure 85: East Asia Market Value Share and BPS Analysis by End Use, 2025 and 2035
  • Figure 86: East Asia Market Y-o-Y Growth Comparison by End Use, 2025-2035
  • Figure 87: East Asia Market Attractiveness Analysis by End Use
  • Figure 88: East Asia Market Value Share and BPS Analysis by Distribution, 2025 and 2035
  • Figure 89: East Asia Market Y-o-Y Growth Comparison by Distribution, 2025-2035
  • Figure 90: East Asia Market Attractiveness Analysis by Distribution
  • Figure 91: South Asia & Pacific Market Value Share and BPS Analysis by Country, 2025 and 2035
  • Figure 92: South Asia & Pacific Market Value Share and BPS Analysis by Form, 2025 and 2035
  • Figure 93: South Asia & Pacific Market Y-o-Y Growth Comparison by Form, 2025-2035
  • Figure 94: South Asia & Pacific Market Attractiveness Analysis by Form
  • Figure 95: South Asia & Pacific Market Value Share and BPS Analysis by Source, 2025 and 2035
  • Figure 96: South Asia & Pacific Market Y-o-Y Growth Comparison by Source, 2025-2035
  • Figure 97: South Asia & Pacific Market Attractiveness Analysis by Source
  • Figure 98: South Asia & Pacific Market Value Share and BPS Analysis by End Use, 2025 and 2035
  • Figure 99: South Asia & Pacific Market Y-o-Y Growth Comparison by End Use, 2025-2035
  • Figure 100: South Asia & Pacific Market Attractiveness Analysis by End Use
  • Figure 101: South Asia & Pacific Market Value Share and BPS Analysis by Distribution, 2025 and 2035
  • Figure 102: South Asia & Pacific Market Y-o-Y Growth Comparison by Distribution, 2025-2035
  • Figure 103: South Asia & Pacific Market Attractiveness Analysis by Distribution
  • Figure 104: Middle East and Africa Market Value Share and BPS Analysis by Country, 2025 and 2035
  • Figure 105: Middle East and Africa Market Value Share and BPS Analysis by Form, 2025 and 2035
  • Figure 106: Middle East and Africa Market Y-o-Y Growth Comparison by Form, 2025-2035
  • Figure 107: Middle East and Africa Market Attractiveness Analysis by Form
  • Figure 108: Middle East and Africa Market Value Share and BPS Analysis by Source, 2025 and 2035
  • Figure 109: Middle East and Africa Market Y-o-Y Growth Comparison by Source, 2025-2035
  • Figure 110: Middle East and Africa Market Attractiveness Analysis by Source
  • Figure 111: Middle East and Africa Market Value Share and BPS Analysis by End Use, 2025 and 2035
  • Figure 112: Middle East and Africa Market Y-o-Y Growth Comparison by End Use, 2025-2035
  • Figure 113: Middle East and Africa Market Attractiveness Analysis by End Use
  • Figure 114: Middle East and Africa Market Value Share and BPS Analysis by Distribution, 2025 and 2035
  • Figure 115: Middle East and Africa Market Y-o-Y Growth Comparison by Distribution, 2025-2035
  • Figure 116: Middle East and Africa Market Attractiveness Analysis by Distribution
  • Figure 117: Global Market - Tier Structure Analysis
  • Figure 118: Global Market - Company Share Analysis

Frequently Asked Questions

How big is the microbial coagulants market in 2025?

The global microbial coagulants market is estimated to be valued at USD 240 million in 2025.

What will be the size of the microbial coagulants market in 2035?

The microbial coagulants market size is projected to reach USD 335.3 million by 2035.

How much will be the microbial coagulants market growth between 2025 and 2035?

The microbial coagulants market is expected to grow at a 3.4% CAGR between 2025 and 2035.

Which source segment is projected to lead in the microbial coagulants market in 2025?

The Rhizomucor miehei segment is projected to lead in the microbial coagulants market with 45% market share in 2025.

Which distribution channel is set to contribute significant share in the microbial coagulants market in 2025?

In terms of distribution channel, the wholesale segment is expected to command 55% share in the microbial coagulants market in 2025.

Explore Similar Insights

Future Market Insights

Microbial Coagulants Market