Reports

- Global Locations -

Headquarters

Future Market Insights, Inc.

Christiana Corporate, 200
Continental Drive, Suite 401,
Newark, Delaware - 19713,
United States

T: +1-845-579-5705

Americas

Future Market Insights, Inc.

616 Corporate Way, Suite 2-9018,
Valley Cottage, NY 10989, United States

T: +1-347-918-3531

MEA

Future Market Insights

1602-6 Jumeirah Bay X2 Tower, Plot No: JLT-PH2-X2A,
Jumeirah Lakes Towers, Dubai,
United Arab Emirates

Europe

Future Market Insights

3rd Floor, 207 Regent Street,
W1B 3HH London
United Kingdom

T: + 44 (0) 20 8123 9659
D: +44 (0) 20 3287 4268

Asia Pacific

Future Market Insights

IndiaLand Global Tech Park, Unit UG-1, Behind Grand HighStreet, Phase 1, Hinjawadi, MH, Pune – 411057, India

Antibiotic Susceptibility Testing Market Outlook (2022-2028)

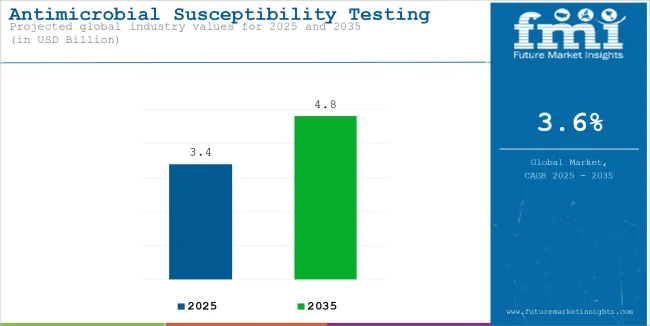
[188 Pages Report] Antibiotic susceptibility testing market revenue totaled US$ 2.82 Billion in 2021. The global market is expected to reach a valuation of US$ 4.05 Billion by 2028, expanding at a CAGR of 5.2%.

Antibiotic Susceptibility Testing Market Size (2022) US$ 3 Billion
Sales Forecast (2028) US$ 4.05 Billion
Global Market Growth Rate (2022 to 2028) 5.2% CAGR
Share of Top 5 Market Players 50%

Don't pay for what you don't need

Customize your report by selecting specific countries or regions and save 30%!

How The Market Progressed Till June 2022?

Particulars Details
H1, 2021 5.64%
H1, 2022 Projected 5.16%
H1, 2022 Outlook 4.66%
BPS Change - H1, 2022 (O) - H1, 2022 (P) (-) 50 ↓
BPS Change - H1, 2022 (O) - H1, 2021 (-) 98 ↓

The global antibiotic susceptibility testing market is subject to changes as per the macro and industrial dynamics associated with the drug and device regulations, product licensing, and product distribution.

Key developments in the market include the development of novel MALDI-TOF mass spectrometry for the rapid identification of disease pathogens or causative bacterial organisms.

H1-2022 outlook period in comparison to H1-2022 projected period showed a negative growth in terms of Basis Point Share by 50 BPS. However, In H1-2022, the market growth rate of antibiotic susceptibility testing is expected to fall by 98 basis point share (BPS), as per FMI analysis.

The drop in the BPS values is associated with the complicated pre-analytical process associated with antibiotic susceptibility testing thus presenting a high procedural cost. Moreover, the necessity for a comparatively vast quantity of viable organisms, and a limited database spectrum for micro-organisms has presented a hurdle in the growth of the market, thus resulting in the reduced BPS values.

However, the expected introduction of microfluidics and microdroplets for antibiotic susceptibility testing will present a positive growth outlook for the market over the forecasted years.

Demand Analysis Of Antibiotic Susceptibility Testing From 2013-2021 Vs Future Outlook 2022-2028

“Increasing Awareness Initiatives about Antibiotic Resistance to Boost Demand for Antibiotic Susceptibility Testing”

From 2013 to 2021, the global antibiotic susceptibility testing market progressed at a CAGR of around 5.5%.

Antibiotic susceptibility testing is performed as a routine to ensure the efficient use of antibiotics. It determines the lowest concentrations of new or existing antimicrobial agents and inhibits consistent and visible growth of the bacterium that is being investigated, under specific test conditions.

It is the detection of possible drug resistance in some of the most common pathogens and the discovery of susceptibility of the drugs of choice for particular infections.

Constant advancements in instruments used for antibiotic susceptibility testing have led to gaining FDA clearance for these systems.

Modifications in antibiotic susceptibility testing instruments include improvements in the computer software for either providing an extended incubation period for difficult organism-drug combinations or, by using expert software to edit susceptibility test results for prevention of unwanted results from being noted.

The global antibiotic susceptibility testing market is anticipated to expand at a 5.2% CAGR from 2022 to 2028.

Antibiotic Susceptibility Testing Market

What Are The Major Factors Driving Market Growth?

“Advancements in Rapid AST Methods & Instruments to Fuel Market Expansion”

Rapid AST methods enable targeted therapy for any treatment, as early as possible. Growing advancements in AST methods are expected to boost the market growth for antibiotic susceptibility testing during the forecast period.

Widespread usage of online channels is responsible for a consistent and rapid increase in the sales of antibiotic susceptibility testing systems in recent years. Vendors operating in the antibiotic susceptibility testing market are focusing on online marketing and promotional strategies to increase sales and ensure better access to their devices.

Online platforms enable vendors to offer information about the devices in their portfolios as well as gain access to local as well as global markets. In addition, online marketing websites offer a wide selection of branded AST methods at affordable costs and attractive discounts.

What Are The Key Roadblocks For The Growth Of The Antibiotic Susceptibility Testing Market?

“Complex Regulatory Framework Major Restraining Factor for Market Growth

Automated antibiotic susceptibility testing tools are costly as they come with several complex features and functions. Incubation and detection times are cut by 50% when automated AST methods are resorted to. This factor is a major hurdle to their widespread acceptance by end users, particularly smaller medical facilities.

Furthermore, scientific and regulatory challenges faced by businesses in the market extend the time to market and raise development costs, thereby compromising product marketability. The market is likely to be restrained by tight regulatory government policies and the hurdles involved with antimicrobial susceptibility testing.

Sabyasachi Ghosh
Sabyasachi Ghosh

Principal Consultant

Talk to Analyst

Find your sweet spots for generating winning opportunities in this market.

How Is North America Propelling The Demand For Antibiotic Susceptibility Testing?

“Ongoing Advancements in Antibiotic Resistance Testing Systems”

North America is expected to lead the global antibiotic susceptibility testing market in terms of market value, accounting for nearly 28.6% share in the global market.

Growing adoption of antibiotic susceptibility testing in a medical laboratory, rising research and development activities for antibiotic resistance testing systems, and increased demand for antibiotic susceptibility testing to support empiric treatment is driving market growth in North America.

Most well-known corporations are based in the region. Key players have concentrated on expansion to broaden their network and capacities. These factors are driving market expansion across the continent.

Country-Wise Analysis

Why is the Antibiotic Susceptibility Testing Market in the U.S. Growing at Rapid Pace?

“Increased Prevalence of Infectious Diseases to Augment Demand for Antimicrobial Susceptible Test Products”

The market in the U.S. is likely to expand at a rapid pace over the forecast period, because of the rising prevalence of drug-resistant contagious diseases, a very well healthcare system, a favorable government environment, and rising R&D expenditure.

The excellent technical ability of market players has a significant impact on technological advancements of antimicrobial susceptible test products. Public health, as the top priority, has been demonstrated to have a favorable impact on public-private partnerships in the United States.

This is also expected to be used as a tool to help market players improve the pace of antimicrobial susceptible test product development.

What is the Demand Outlook for Antibiotic Susceptibility Testing in China?

“Surge in Funding for Development of Antibiotic Sensitivity Testing”

Growing concerns among people about their wellness and increasing use of over-the-counter antibiotics are driving market expansion in China. Rise in funding for the advancement of antibiotic sensitivity testing procedures is another important aspect for market expansion.

Increasing adoption of minimum inhibitory concentration in antibiotic sensitivity testing performed in a clinical lab, as well as increased antibiotic-resistant awareness activities, are driving market growth in China.

Get the data you need at a Fraction of the cost

Personalize your report by choosing insights you need
and save 40%!

Category-Wise Insights

Which Antibiotic Susceptibility Testing Product is Projected to Gain Traction?

“Manual Broth Microdilution System Most Preferred Attributed to Low Cost & Easy Handling Techniques”

Susceptibility testing discs, MIC strips, and susceptibility testing plates are all manual broth microdilution systems. The demand for manual broth microdilution systems is being driven by an increase in antibiotic resistance, new product introductions, and the adoption of susceptibility testing discs.

Growing acceptance of the disc diffusion technique and improvements in susceptibility plates are driving the demand for manual broth microdilution systems. Moreover, manual products offer flexibility and cost savings through the use of technologies such as disc diffusion and gradient diffusion.

Due to an increase in demand for particular susceptibility testing systems to define the scope of targeted therapy, sales of manual broth microdilution system equipment will see healthy growth.

Which End User Dominates Demand for Antibiotic Susceptibility Testing Equipment?

“Hospitals to Remain Primary End User Due to Enhanced Health Coverage Plans”

Antibiotic testing is performed in hospitals to a large extent with the latest technologies available, therefore hospitals are projected to dominate the market. Antibiotic susceptibility testing aids in the assessment of hospital-based treatment services.

The need for antibiotic susceptibility testing kits is increasing as a result of the recent shift toward individualized treatments. The large share of this segment is mainly attributed to the presence of a well-equipped facility and qualified professionals, the increase in hospital-acquired infectious diseases, and key companies' initiatives to sell antibiotic susceptibility testing products through hospitals.

COVID-19 Impact On Antibiotic Susceptibility Testing Demand

The COVID-19 pandemic has had a negative impact on the market, lowering demand and sales. This was owing to the cancellation of antibiotic susceptibility testing, as well as delays in clinical studies, supply chain concerns, and decreased sales and marketing activities.

Because market players have limited access to present and potential clients, they have been unable to complete sales of new antibiotic susceptibility testing systems or install previously sold systems, limiting the expansion of consumable test kits.

Now, due to improved healthcare systems, rise in unfulfilled healthcare demands, and increase in the occurrence of antibiotic resistance in individuals, there are lucrative growth opportunities awaiting antibiotic susceptibility testing system manufacturers.

Competitive Landscape

Leading market players have upgraded their manufacturing facilities and are engaged in a variety of R&D activities. Regulatory approvals, high-tech products, introduction of new products, acquisitions, and collaborative partnerships with other companies are all priorities for key providers of antibiotic susceptibility testing systems.

For instance,

  • Alifax launched a ground-breaking proper system for rapid bacteria detection that gives antibiotic susceptibility and resistance testing in six hours and needs less manual labour, based on the rapid phenotyping method.

Antibiotic Susceptibility Testing Industry Report Scope

Attribute Details
Forecast Period 2022 to 2028
Historical Data Available for 2013 to 2021
Market Analysis Value in US$ Million
Key Regions Covered
  • North America
  • Latin America
  • Europe
  • East Asia
  • South Asia & Pacific
  • Middle East & Africa (MEA)
Key Countries Covered
  • U.S.
  • Canada
  • Mexico
  • Brazil
  • Mexico
  • Argentina
  • Germany
  • Italy
  • France
  • UK
  • Nordic
  • Spain
  • Japan
  • China
  • India
  • Malaysia
  • Thailand
  • Australia
  • GCC Countries
  • South Africa
  • Turkey
Key Market Segments Covered
  • Product
  • Application
  • End User
  • Region
Key Companies Profiled
  • BD
  • Danaher
  • Thermo Fisher Scientific
  • Bio-Rad
  • Creative Diagnostics
  • Accelerate Diagnostics
  • Alifax
  • Roche Diagnostics Limited
  • Merck Group
  • Synbiosis
  • MP Biomedicals
  • QuantaMatrix Inc.
  • Resistell AG
Pricing Available upon Request

Key Segments Of Antibiotic Susceptibility Testing Industry Survey

Antibiotic Susceptibility Testing Market by Product:

  • Instruments
    • Automated Broth Microdilution Systems
    • Manual Broth Microdilution Systems
    • Semi-automated Broth Microdilution Systems
  • Software & Services
    • Image & Analysis Software
    • Installation Services
  • Kits & Reagents

Antibiotic Susceptibility Testing Market by Application:

  • Sepsis
  • Respiratory Infections
  • Gastrointestinal Infections
  • Meningitis & Encephalitis
  • Endocarditis
  • Others

Antibiotic Susceptibility Testing Market by End User:

  • Diagnostic Laboratories
  • Hospitals
  • Research Laboratories

Antibiotic Susceptibility Testing Market by Region:

  • North America Antibiotic Susceptibility Testing Market
  • Latin America Antibiotic Susceptibility Testing Market
  • Europe Antibiotic Susceptibility Testing Market
  • East Asia Antibiotic Susceptibility Testing Market
  • South Asia & Pacific Antibiotic Susceptibility Testing Market
  • Middle East & Africa (MEA) Antibiotic Susceptibility Testing Market

Frequently Asked Questions

What are the key trends driving demand growth of antibiotic susceptibility testing?

Rising prevalence of testing in hospitals and diagnostics for providing appropriate therapies to patients is driving market growth.

Which are the top companies in the antibiotic susceptibility testing market?

Major companies supplying antibiotic susceptibility testing systems include BD, Danaher, Thermo Fisher Scientific, Bio-Rad, and Creative Diagnostics.

What is the growth rate of the antibiotic susceptibility testing market?

The global antibiotic susceptibility testing market is estimated to exhibit a CAGR of 5.2% during the forecast period (2022-2028).

Which region holds the largest share in the global antibiotic susceptibility testing market?

North America accounts for 28.6% share of the global antibiotic susceptibility testing market.

What is the expected market size for antibiotic susceptibility testing by 2028?

The global market for antibiotic susceptibility testing is expected to reach a valuation of US$ 4.05 Bn by 2028.

Table of Content

1. Executive Summary

    1.1. Market Overview

    1.2. Market Analysis

    1.3. FMI Analysis and Recommendations

    1.4. Wheel of Fortune

2. Market Introduction

    2.1. Market Definition

    2.2. Market Taxonomy

3. Global Market Opportunity Analysis 

    3.1. Macro-Economic Factors

    3.2. Opportunity Analysis

4. Global Economic Outlook

    4.1. Global Gross Domestic Product by Region & Country, 2013 – 2021

    4.2. Healthcare Sector Outlook by Region & Country, 2013 – 2021

5. Key Inclusions

    5.1. Development Roadmap for Systems

    5.2. Technology Assessment

6. Market Background

    6.1. Market Dynamics

        6.1.1. Drivers

        6.1.2. Restraints

        6.1.3. Trends

7. North America Market Analysis 2013-2021 and Forecast 2022–2028

    7.1. Introduction

    7.2. Historical Market Size Analysis By Country, 2013-2021

        7.2.1. U.S.

        7.2.2. Canada

    7.3. Market Size Forecast By Country, 2022–2028

        7.3.1. U.S.

        7.3.2. Canada

    7.4. Historical Market Size Forecast By Product Type, 2022–2028

        7.4.1. Instruments

            7.4.1.1. Automated Broth Microdilution Systems

            7.4.1.2. Manual Broth Microdilution Systems

            7.4.1.3. Semi-Automated Broth Microdilution Systems

        7.4.2. Software & Services

            7.4.2.1. Image Analysis Software

            7.4.2.2. Installation Services

        7.4.3. Kits & Reagents

    7.5. Market Size Forecast By Product Type, 2022–2028

    7.6. Historical Market Size Forecast By Application, 2022–2028

        7.6.1. Sepsis

        7.6.2. Respiratory Infections

        7.6.3. Gastrointestinal Infections

        7.6.4. Meningitis & Encephalitis

        7.6.5. Endocarditis

        7.6.6. Others

    7.7. Market Size Forecast By Application, 2022–2028

    7.8. Historical Market Size Forecast By End User, 2022–2028

        7.8.1. Diagnostic Laboratories

        7.8.2. Hospitals

        7.8.3. Research Laboratories

    7.9. Market Size Forecast By End User, 2022–2028

    7.10. Market Attractiveness Analysis

        7.10.1. By Country

        7.10.2. By Product Type

        7.10.3. By Application

        7.10.4. By End User

8. Latin America Market Analysis 2013-2021 and Forecast 2022–2028

    8.1. Introduction

    8.2. Historical Market Size Analysis By Country, 2013-2021

        8.2.1. Brazil

        8.2.2. Mexico

        8.2.3. Rest of Latin America

    8.3. Market Size Forecast By Country, 2022–2028

    8.4. Historical Market Size Forecast By Product Type, 2022–2028

        8.4.1. Instruments

            8.4.1.1. Automated Broth Microdilution Systems

            8.4.1.2. Manual Broth Microdilution Systems

            8.4.1.3. Semi-Automated Broth Microdilution Systems

        8.4.2. Software & Services

            8.4.2.1. Image Analysis Software

            8.4.2.2. Installation Services

        8.4.3. Kits & Reagents

    8.5. Market Size Forecast By Product Type, 2022–2028

    8.6. Historical Market Size Forecast By Application, 2022–2028

        8.6.1. Sepsis

        8.6.2. Respiratory Infections

        8.6.3. Gastrointestinal Infections

        8.6.4. Meningitis & Encephalitis

        8.6.5. Endocarditis

        8.6.6. Others

    8.7. Market Size Forecast By Application, 2022–2028

    8.8. Historical Market Size Forecast By End User, 2022–2028

        8.8.1. Diagnostic Laboratories

        8.8.2. Hospitals

        8.8.3. Research Laboratories

    8.9. Market Size Forecast By End User, 2022–2028

    8.10. Market Attractiveness Analysis

        8.10.1. By Country

        8.10.2. By Product Type

        8.10.3. By Application

        8.10.4. By End User

9. Europe Market Analysis 2013-2021 and Forecast 2022–2028

    9.1. Introduction

    9.2. Historical Market Size Analysis By Country, 2013-2021

        9.2.1. United Kingdom

        9.2.2. France

        9.2.3. Italy

        9.2.4. Spain

        9.2.5. Russia

        9.2.6. Germany

        9.2.7. Rest of Eastern Europe

    9.3. Market Size Forecast By Country, 2022–2028

    9.4. Historical Market Size Forecast By Product Type, 2022–2028

        9.4.1. Instruments

            9.4.1.1. Automated Broth Microdilution Systems

            9.4.1.2. Manual Broth Microdilution Systems

            9.4.1.3. Semi-Automated Broth Microdilution Systems

        9.4.2. Software & Services

            9.4.2.1. Image Analysis Software

            9.4.2.2. Installation Services

        9.4.3. Kits & Reagents

    9.5. Market Size Forecast By Product Type, 2022–2028

    9.6. Historical Market Size Forecast By Application, 2022–2028

        9.6.1. Sepsis

        9.6.2. Respiratory Infections

        9.6.3. Gastrointestinal Infections

        9.6.4. Meningitis & Encephalitis

        9.6.5. Endocarditis

        9.6.6. Others

    9.7. Market Size Forecast By Application, 2022–2028

    9.8. Historical Market Size Forecast By End User, 2022–2028

        9.8.1. Diagnostic Laboratories

        9.8.2. Hospitals

        9.8.3. Research Laboratories

    9.9. Market Size Forecast By End User, 2022–2028

    9.10. Market Attractiveness Analysis

        9.10.1. By Country

        9.10.2. By Product Type

        9.10.3. By Application

        9.10.4. By End User

10. APAC Market Analysis 2013-2021 and Forecast 2022–2028

    10.1. Introduction

    10.2. Historical Market Size Analysis By Country, 2013-2021

        10.2.1. Japan

        10.2.2. China

        10.2.3. India

        10.2.4. Australia

        10.2.5. Rest of APAC

    10.3. Market Size Forecast By Country, 2022–2028

    10.4. Historical Market Size Forecast By Product Type, 2022–2028

        10.4.1. Instruments

            10.4.1.1. Automated Broth Microdilution Systems

            10.4.1.2. Manual Broth Microdilution Systems

            10.4.1.3. Semi-Automated Broth Microdilution Systems

        10.4.2. Software & Services

            10.4.2.1. Image Analysis Software

            10.4.2.2. Installation Services

        10.4.3. Kits & Reagents

    10.5. Market Size Forecast By Product Type, 2022–2028

    10.6. Historical Market Size Forecast By Application, 2022–2028

        10.6.1. Sepsis

        10.6.2. Respiratory Infections

        10.6.3. Gastrointestinal Infections

        10.6.4. Meningitis & Encephalitis

        10.6.5. Endocarditis

        10.6.6. Others

    10.7. Market Size Forecast By Application, 2022–2028

    10.8. Historical Market Size Forecast By End User, 2022–2028

        10.8.1. Diagnostic Laboratories

        10.8.2. Hospitals

        10.8.3. Research Laboratories

    10.9. Market Size Forecast By End User, 2022–2028

    10.10. Market Attractiveness Analysis

        10.10.1. By Country

        10.10.2. By Product Type

        10.10.3. By Application

        10.10.4. By End User

11. Middle East and Africa Market Analysis 2013-2021 and Forecast 2022–2028

    11.1. Introduction

    11.2. Historical Market Size Analysis By Country, 2013-2021

        11.2.1. South Africa

        11.2.2. Saudi Arabia

        11.2.3. Rest of Middle East and Africa

    11.3. Market Size Forecast By Country, 2022–2028

    11.4. Historical Market Size Forecast By Product Type, 2022–2028

        11.4.1. Instruments

            11.4.1.1. Automated Broth Microdilution Systems

            11.4.1.2. Manual Broth Microdilution Systems

            11.4.1.3. Semi-Automated Broth Microdilution Systems

        11.4.2. Software & Services

            11.4.2.1. Image Analysis Software

            11.4.2.2. Installation Services

        11.4.3. Kits & Reagents

    11.5. Market Size Forecast By Product Type, 2022–2028

    11.6. Historical Market Size Forecast By Application, 2022–2028

        11.6.1. Sepsis

        11.6.2. Respiratory Infections

        11.6.3. Gastrointestinal Infections

        11.6.4. Meningitis & Encephalitis

        11.6.5. Endocarditis

        11.6.6. Others

    11.7. Market Size Forecast By Application, 2022–2028

    11.8. Historical Market Size Forecast By End User, 2022–2028

        11.8.1. Diagnostic Laboratories

        11.8.2. Hospitals

        11.8.3. Research Laboratories

    11.9. Market Size Forecast By End User, 2022–2028

    11.10. Market Attractiveness Analysis

        11.10.1. By Country

        11.10.2. By Product Type

        11.10.3. By Application

        11.10.4. By End User

12. Forecast Factors: Relevance and Impact

13. Forecast Assumptions

14. Market Structure Analysis

    14.1. Market Structure by Tier

    14.2. Market Share Analysis (2021) for Top Players, By Region

15. Competition Analysis

    15.1. Competition Dashboard

    15.2. Company Profiles

        15.2.1. BD

            15.2.1.1. Overview

            15.2.1.2. Product Portfolio

            15.2.1.3. Key Financials

            15.2.1.4. SWOT Analysis

            15.2.1.5. Marketing Strategy

        15.2.2. Thermo Fischer Scientific Inc.

            15.2.2.1. Overview

            15.2.2.2. Product Portfolio

            15.2.2.3. Key Financials

            15.2.2.4. SWOT Analysis

            15.2.2.5. Marketing Strategy

        15.2.3. bioMérieux SA

            15.2.3.1. Overview

            15.2.3.2. Product Portfolio

            15.2.3.3. Key Financials

            15.2.3.4. SWOT Analysis

            15.2.3.5. Marketing Strategy

        15.2.4. Bio-Rad Laboratories Inc.

            15.2.4.1. Overview

            15.2.4.2. Product Portfolio

            15.2.4.3. Key Financials

            15.2.4.4. SWOT Analysis

            15.2.4.5. Marketing Strategy

        15.2.5. Merck KGaA

            15.2.5.1. Overview

            15.2.5.2. Product Portfolio

            15.2.5.3. Key Financials

            15.2.5.4. SWOT Analysis

            15.2.5.5. Marketing Strategy

        15.2.6. Creative Diagnostics

            15.2.6.1. Overview

            15.2.6.2. Product Portfolio

            15.2.6.3. Key Financials

            15.2.6.4. SWOT Analysis

            15.2.6.5. Marketing Strategy

        15.2.7. Danaher Corporation

            15.2.7.1. Overview

            15.2.7.2. Product Portfolio

            15.2.7.3. Key Financials

            15.2.7.4. SWOT Analysis

            15.2.7.5. Marketing Strategy

        15.2.8. Accelerate Diagnostics, Inc.

            15.2.8.1. Overview

            15.2.8.2. Product Portfolio

            15.2.8.3. Key Financials

            15.2.8.4. SWOT Analysis

            15.2.8.5. Marketing Strategy

16. Global Market Analysis 2013-2021 and Forecast 2022–2028 By Region

    16.1. Introduction / Key Findings

    16.2. Historical Market Size Analysis By Region

        16.2.1. North America

        16.2.2. Latin America

        16.2.3. Europe

        16.2.4. Asia-Pacific and China

        16.2.5. Middle East and Africa

    16.3. Market Size Forecast By Region

    16.4. Market Attractiveness Analysis By Region

17. Global Market Analysis 2013-2021 and Forecast 2022–2028, By Product Type

    17.1. Introduction/Key Finding

    17.2. Historical Market Size Analysis By Product Type, 2013-2021

        17.2.1. Instruments

            17.2.1.1. Automated Broth Microdilution Systems

            17.2.1.2. Manual Broth Microdilution Systems

            17.2.1.3. Semi-Automated Broth Microdilution Systems

        17.2.2. Software & Services

            17.2.2.1. Image Analysis Software

            17.2.2.2. Installation Services

        17.2.3. Kits & Reagents

    17.3. Market Size Forecast By Product Type, 2022–2028

    17.4. Market Attractiveness Analysis By Product Type

18. Global Market Analysis 2013-2021 and Forecast 2022–2028, By End User

    18.1. Introduction/Key Finding

    18.2. Historical Market Size Analysis By End User, 2013-2021

        18.2.1. Diagnostic Laboratories

        18.2.2. Hospitals

        18.2.3. Research Laboratories

    18.3. Market Size Forecast By End User, 2022–2028

    18.4. Market Attractiveness Analysis By End User

19. Global Market Analysis 2013-2021 and Forecast 2022–2028

    19.1. Market Value Share Analysis By All Segment

    19.2. Y-o-Y Growth Analysis By All Segment

    19.3. Absolute $ Opportunity

20. Assumptions and Acronyms Used

21. Research Methodology

Don't pay for what you don't need

Customize your report by selecting specific countries or regions and save 30%!

List of Tables

Table 01: North America Market size (US$ Mn)Analysis-2013–2021 and Forecast 2022-2028 By Country

Table 02: North America Market size (US$ Mn) Analysis-2013–2021 and Forecast 2022-2028 By Product Type

Table 03: North America Market size (US$ Mn) Analysis-2013–2021 and Forecast 2022-2028 By Application

Table 04: North America Market size (US$ Mn) Analysis-2013–2021 and Forecast 2022-2028 By End User

Table 05: Latin America Market size (US$ Mn)Analysis-2013–2021 and Forecast 2022-2028 By Country

Table 06: Latin America Market size (US$ Mn) Analysis-2013–2021 and Forecast 2022-2028 By Product Type

Table 07: Latin America Market size (US$ Mn) Analysis-2013–2021 and Forecast 2022-2028 By Application

Table 08: Latin America Market size (US$ Mn) Analysis-2013–2021 and Forecast 2022-2028 By End User

Table 09: Europe Market size (US$ Mn)Analysis-2013–2021 and Forecast 2022-2028 By Country

Table 10: Europe Market size (US$ Mn) Analysis-2013–2021 and Forecast 2022-2028 By Product Type

Table 11: Europe Market size (US$ Mn) Analysis-2013–2021 and Forecast 2022-2028 By Application

Table 12: Europe Market size (US$ Mn) Analysis-2013–2021 and Forecast 2022-2028 By End User

Table 13: APAC Market size (US$ Mn)Analysis-2013–2021 and Forecast 2022-2028 By Country

Table 14: APAC Market size (US$ Mn) Analysis-2013–2021 and Forecast 2022-2028 By Product Type

Table 15: APAC Market size (US$ Mn) Analysis-2013–2021 and Forecast 2022-2028 By Application

Table 16: APAC Market size (US$ Mn) Analysis-2013–2021 and Forecast 2022-2028 By End User

Table 17: Middle East & Africa Market size (US$ Mn)Analysis-2013–2021 and Forecast 2022-2028 By Country

Table 18: Middle East & Africa Market size (US$ Mn) Analysis-2013–2021 and Forecast 2022-2028 By Product Type

Table 19: Middle East & Africa Market size (US$ Mn) Analysis-2013–2021 and Forecast 2022-2028 By Application

Table 20: Middle East & Africa Market size (US$ Mn) Analysis-2013–2021 and Forecast 2022-2028 By End User

Table 21: Global Market Size (US$ Mn) Forecast By Region, 2013-2028

Table 22: Global Market size (US$ Mn) Analysis-2013–2021 and Forecast 2022-2028 By Product Type

Table 23: Global Market size (US$ Mn) Analysis-2013–2021 and Forecast 2022-2028 By Application

Table 24: Global Market size (US$ Mn) Analysis-2013–2021 and Forecast 2022-2028 By End User
Sabyasachi Ghosh
Sabyasachi Ghosh

Principal Consultant

Talk to Analyst

Find your sweet spots for generating winning opportunities in this market.

List of Charts

Figure 01: Global Market Value Share 2022E, By Region

Figure 02: Global Market Value Share, By Product Type

Figure 03: North America Market Value Share, By Country (2021 A)

Figure 04: North America Market Value Share, By Product Type (2021 A)

Figure 05: North America Market Value Share, By Application (2021 A)

Figure 06: North America Market Value Share, By End User (2021 A)

Figure 07: North America Market Size Analysis, 2013–2021

Figure 08: North America Market Forecast & Y-o-Y growth, 2022–2028

Figure 09: U.S. Antibiotic Susceptibility Testing, Market Size (US$ Mn) Analysis, 2013–2021

Figure 10: U.S. Antibiotic Susceptibility Testing, Market Forecast & Y-o-Y Growth (%), 2022-2028

Figure 11: Canada Antibiotic Susceptibility Testing, Market Size (US$ Mn) Analysis, 2013–2021

Figure 12: Canada Antibiotic Susceptibility Testing, Market Forecast & Y-o-Y Growth (%), 2022-2028

Figure 13: North America Market Size (US$ Mn) Analysis, 2013–2021, By Instruments

Figure 14: North America Market Forecast & Y-o-Y Growth (%), 2022-2028, By Instruments

Figure 15: North America Market Size (US$ Mn) Analysis, 2013–2021, By Software & Services

Figure 16: North America Market Forecast & Y-o-Y Growth (%), 2022-2028, By Software & Services

Figure 17: North America Market Size (US$ Mn) Analysis, 2013–2021, By Kits & Reagents

Figure 18: North America Market Forecast & Y-o-Y Growth (%), 2022-2028, By Kits & Reagents

Figure 19: North America Market Attractiveness Analysis By Country, 2022-2028

Figure 20: North America Market Attractiveness Analysis By Product Type, 2022-2028

Figure 21: North America Market Attractiveness Analysis By Application, 2022-2028

Figure 22: North America Market Attractiveness Analysis By End User, 2022-2028

Figure 23: Latin America Market Value Share, By Country (2021 A)

Figure 24: Latin America Market Value Share, By Product Type (2021 A)

Figure 25: Latin America Market Value Share, By Application (2021 A)

Figure 26: Latin America Market Value Share, By End User (2021 A)

Figure 27: Latin America Market Size Analysis, 2013–2021

Figure 28: Latin America Market Forecast & Y-o-Y growth, 2022–2028

Figure 29: Mexico Antibiotic Susceptibility Testing, Market Size (US$ Mn) Analysis, 2013–2021

Figure 30: Mexico Antibiotic Susceptibility Testing, Market Forecast & Y-o-Y Growth (%), 2022-2028

Figure 31: Brazil Antibiotic Susceptibility Testing, Market Size (US$ Mn) Analysis, 2013–2021

Figure 32: Brazil Antibiotic Susceptibility Testing, Market Forecast & Y-o-Y Growth (%), 2022-2028

Figure 33: Rest of LA Antibiotic Susceptibility Testing, Market Size (US$ Mn) Analysis, 2013–2021

Figure 34: Rest of LA Antibiotic Susceptibility Testing, Market Size (US$ Mn) Analysis, 2013–2021

Figure 35: Latin America Market Size (US$ Mn) Analysis, 2013–2021, By Instruments

Figure 36: Latin America Market Forecast & Y-o-Y Growth (%), 2022-2028, By Instruments

Figure 37: Latin America Market Size (US$ Mn) Analysis, 2013–2021, By Software & Services

Figure 38: Latin America Market Forecast & Y-o-Y Growth (%), 2022-2028, By Software & Services

Figure 39: Latin America Market Size (US$ Mn) Analysis, 2013–2021, By Kits & Reagents

Figure 40: Latin America Market Forecast & Y-o-Y Growth (%), 2022-2028, By Kits & Reagents

Figure 41: Latin America Market Attractiveness Analysis By Country, 2022-2028

Figure 42: Latin America Market Attractiveness Analysis By Product Type, 2022-2028

Figure 43: Latin America Market Attractiveness Analysis By Application, 2022-2028

Figure 44: Latin America Market Attractiveness Analysis By End User, 2022-2028

Figure 45: Europe Market Value Share, By Country (2021 A)

Figure 46: Europe Market Value Share, By Product Type (2021 A)

Figure 47: Europe Market Value Share, By Application (2021 A)

Figure 48: Europe Market Value Share, By End User (2021 A)

Figure 49: Europe Market Size Analysis, 2013–2021

Figure 50: Europe Market Forecast & Y-o-Y growth, 2022–2028

Figure 51: United Kingdom Antibiotic Susceptibility Testing, Market Size (US$ Mn) Analysis, 2013–2021

Figure 52: United Kingdom Antibiotic Susceptibility Testing, Market Forecast & Y-o-Y Growth (%), 2022-2028

Figure 53: France Antibiotic Susceptibility Testing, Market Size (US$ Mn) Analysis, 2013–2021

Figure 54: France Antibiotic Susceptibility Testing, Market Forecast & Y-o-Y Growth (%), 2022-2028

Figure 55: Italy Antibiotic Susceptibility Testing, Market Size (US$ Mn) Analysis, 2013–2021

Figure 56: Italy Antibiotic Susceptibility Testing, Market Forecast & Y-o-Y Growth (%), 2022-2028

Figure 57: Spain Antibiotic Susceptibility Testing, Market Size (US$ Mn) Analysis, 2013–2021

Figure 58: Spain Antibiotic Susceptibility Testing, Market Forecast & Y-o-Y Growth (%), 2022-2028

Figure 59: Russia Antibiotic Susceptibility Testing, Market Size (US$ Mn) Analysis, 2013–2021

Figure 60: Russia Antibiotic Susceptibility Testing, Market Forecast & Y-o-Y Growth (%), 2022-2028

Figure 61: Germany Antibiotic Susceptibility Testing, Market Size (US$ Mn) Analysis, 2013–2021

Figure 62: Germany Antibiotic Susceptibility Testing, Market Forecast & Y-o-Y Growth (%), 2022-2028

Figure 63: Rest of Europe Antibiotic Susceptibility Testing, Market Size (US$ Mn) Analysis, 2013–2021

Figure 64: Rest of Europe Antibiotic Susceptibility Testing, Market Size (US$ Mn) Analysis, 2013–2021

Figure 65: Europe Market Size (US$ Mn) Analysis, 2013–2021, By Instruments

Figure 66: Europe Market Forecast & Y-o-Y Growth (%), 2022-2028, By Instruments

Figure 67: Europe Market Size (US$ Mn) Analysis, 2013–2021, By Software & Services

Figure 68: Europe Market Forecast & Y-o-Y Growth (%), 2022-2028, By Software & Services

Figure 69: Europe Market Size (US$ Mn) Analysis, 2013–2021, By Kits & Reagents

Figure 70: Europe Market Forecast & Y-o-Y Growth (%), 2022-2028, By Kits & Reagents

Figure 71: Europe Market Attractiveness Analysis By Country, 2022-2028

Figure 72: Europe Market Attractiveness Analysis By Product Type, 2022-2028

Figure 73: Europe Market Attractiveness Analysis By Application, 2022-2028

Figure 74: Europe Market Attractiveness Analysis By End User, 2022-2028

Figure 75: APAC Market Value Share, By Country (2021 A)

Figure 76: APAC Market Value Share, By Product Type (2021 A)

Figure 77: APAC Market Value Share, By Application (2021 A)

Figure 78: APAC Market Value Share, By End User (2021 A)

Figure 79: APAC Market Size Analysis, 2013–2021

Figure 80: APAC Market Forecast & Y-o-Y growth, 2022–2028

Figure 81: Japan Antibiotic Susceptibility Testing, Market Size (US$ Mn) Analysis, 2013–2021

Figure 82: Japan Antibiotic Susceptibility Testing, Market Forecast & Y-o-Y Growth (%), 2022-2028

Figure 83: China Antibiotic Susceptibility Testing, Market Size (US$ Mn) Analysis, 2013–2021

Figure 84: China Antibiotic Susceptibility Testing, Market Forecast & Y-o-Y Growth (%), 2022-2028

Figure 85: India Antibiotic Susceptibility Testing, Market Size (US$ Mn) Analysis, 2013–2021

Figure 86: India Antibiotic Susceptibility Testing, Market Forecast & Y-o-Y Growth (%), 2022-2028

Figure 87: Australia Antibiotic Susceptibility Testing, Market Size (US$ Mn) Analysis, 2013–2021

Figure 88: Australia Antibiotic Susceptibility Testing, Market Forecast & Y-o-Y Growth (%), 2022-2028

Figure 89: Rest of APAC Antibiotic Susceptibility Testing, Market Size (US$ Mn) Analysis, 2013–2021

Figure 90: Rest of APAC Antibiotic Susceptibility Testing, Market Size (US$ Mn) Analysis, 2013–2021

Figure 91: APAC Market Size (US$ Mn) Analysis, 2013–2021, By Instruments

Figure 92: APAC Market Forecast & Y-o-Y Growth (%), 2022-2028, By Instruments

Figure 93: APAC Market Size (US$ Mn) Analysis, 2013–2021, By Software & Services

Figure 94: APAC Market Forecast & Y-o-Y Growth (%), 2022-2028, By Software & Services

Figure 95: APAC Market Size (US$ Mn) Analysis, 2013–2021, By Kits & Reagents

Figure 96: APAC Market Forecast & Y-o-Y Growth (%), 2022-2028, By Kits & Reagents

Figure 97: APAC Market Attractiveness Analysis By Country, 2022-2028

Figure 98: APAC Market Attractiveness Analysis By Product Type, 2022-2028

Figure 99: APAC Market Attractiveness Analysis By Application, 2022-2028

Figure 100: APAC Market Attractiveness Analysis By End User, 2022-2028

Figure 101: Middle East & Africa Market Value Share, By Country (2021 A)

Figure 102: Middle East & Africa Market Value Share, By Product Type (2021 A)

Figure 103: Middle East & Africa Market Value Share, By Application (2021 A)

Figure 104: Middle East & Africa Market Value Share, By End User (2021 A)

Figure 105: Middle East & Africa Market Size Analysis, 2013–2021

Figure 106: Middle East & Africa Market Forecast & Y-o-Y growth, 2022–2028

Figure 107: South Africa Antibiotic Susceptibility Testing, Market Size (US$ Mn) Analysis, 2013–2021

Figure 108: South Africa Antibiotic Susceptibility Testing, Market Forecast & Y-o-Y Growth (%), 2022-2028

Figure 109: Saudi Arabia Antibiotic Susceptibility Testing, Market Size (US$ Mn) Analysis, 2013–2021

Figure 110: Saudi Arabia Antibiotic Susceptibility Testing, Market Forecast & Y-o-Y Growth (%), 2022-2028

Figure 111: Rest of MEA Antibiotic Susceptibility Testing, Market Size (US$ Mn) Analysis, 2013–2021

Figure 112: Rest of MEA Antibiotic Susceptibility Testing, Market Size (US$ Mn) Analysis, 2013–2021

Figure 113: Middle East & Africa Market Size (US$ Mn) Analysis, 2013–2021, By Instruments

Figure 114: Middle East & Africa Market Forecast & Y-o-Y Growth (%), 2022-2028, By Instruments

Figure 115: Middle East & Africa Market Size (US$ Mn) Analysis, 2013–2021, By Software & Services

Figure 116: Middle East & Africa Market Forecast & Y-o-Y Growth (%), 2022-2028, By Software & Services

Figure 117: Middle East & Africa Market Size (US$ Mn) Analysis, 2013–2021, By Kits & Reagents

Figure 118: Middle East & Africa Market Forecast & Y-o-Y Growth (%), 2022-2028, By Kits & Reagents

Figure 119: MEA Market Attractiveness Analysis By Country, 2022-2028

Figure 120: MEA Market Attractiveness Analysis By Product Type, 2022-2028

Figure 121: MEA Market Attractiveness Analysis By Application, 2022-2028

Figure 122: MEA Market Attractiveness Analysis By End User, 2022-2028

Figure 123: Global Market: Company Share Analysis (2021)

Figure 124: Global Market Share Analysis (%) By Region, 2022 & 2028

Figure 125: Global Market Y-o-Y Growth (%) By Region, 2022–2028

Figure 126: Global Market Attractiveness Analysis By Region, 2022–2028

Figure 127: Global Market Share Analysis (%) By Product Type, 2022 & 2028

Figure 128: Global Market Y-o-Y Growth (%) By Product Type, 2022–2028

Figure 129: Global Market Attractiveness Analysis By Product Type, 2022–2028

Figure 130: Global Market Share Analysis (%) By Application, 2021 & 2028

Figure 131: Global Market Y-o-Y Growth (%) By Application, 2022–2028

Figure 132: Global Market Attractiveness Analysis By Application, 2022–2028

Figure 133: Global Market Share Analysis (%) By End User, 2022 & 2028

Figure 134: Global Market Y-o-Y Growth (%) By End User, 2022–2028

Figure 135: Global Market Attractiveness Analysis By End User, 2022–2028

Figure 136: Global Market Value (US$ Mn), 2013–2021

Figure 137: Global Absolute $ Opportunity (US$ Mn), 2021–2028

Figure 138: Global Market Value Analysis and Forecast, 2013–2028 (US$ Mn)

Recommendations

Healthcare

Companion Animal Drugs Market

Published : February 2023

Healthcare

Vaginitis Treatment Drugs Market

Published : July 2022

Explore Healthcare Insights

View Reports

Antibiotic Susceptibility Testing Market