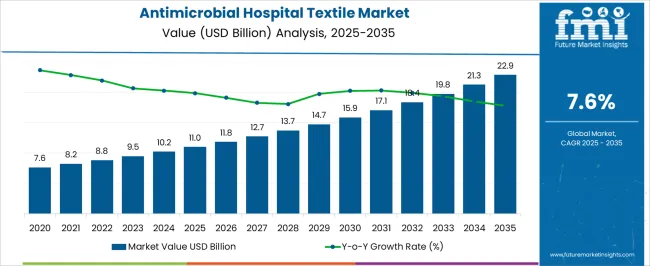
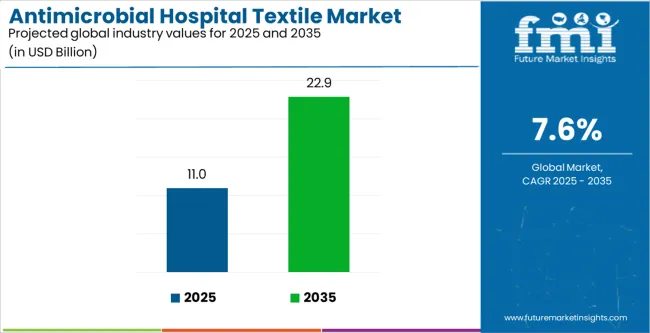
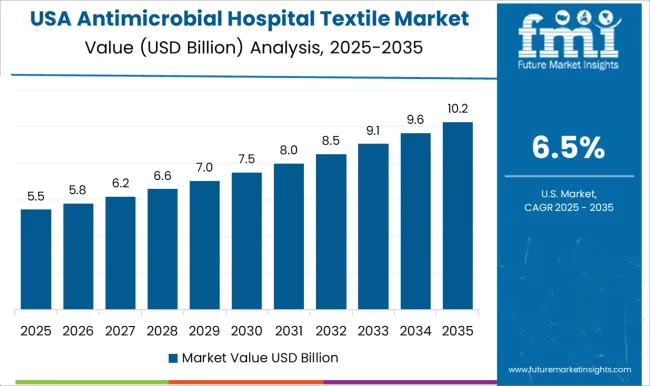
The antimicrobial hospital textile market size is estimated to be worth USD 9.5 billion in 2024. The increasing awareness of HAIs has intensified the focus on preventive measures within healthcare settings. The demand for antimicrobial hospital textile is likely to rise at a CAGR of 7.6% through 2034.
Hospitals and healthcare facilities are investing in antimicrobial textiles to create a safer patient environment, reducing the risk of infections.
The antimicrobial hospital textile industry is anticipated to surpass USD 19.8 billion by 2034. Innovations in textile manufacturing have led to the development of antimicrobial fabrics with enhanced efficacy. Hospitals are inclined towards adopting advanced textile solutions that provide long-lasting protection against a broad spectrum of pathogens.
Demand Analysis of the Antimicrobial Hospital Textile
Attributes | Details |
---|---|
Antimicrobial Hospital Textile Market Value for 2024 | USD 9.5 billion |
Antimicrobial Hospital Textile Market Value for 2034 | USD 19.8 billion |
Antimicrobial Hospital Textile Market Forecast CAGR for 2024 to 2034 | 7.6% |
Historical CAGR | 8.7% |
---|
The historical CAGR of 8.7% reflects a period of robust market awareness and educational initiatives. Companies invested significantly in educating healthcare professionals about the benefits of antimicrobial hospital textiles, leading to widespread adoption.
During this period, substantial technological advancements in textile manufacturing resulted in highly effective antimicrobial fabrics. These innovations contributed to the increased efficacy and durability of the textiles, positively influencing market growth. As the market matured during this period, achieving sustained high growth became progressively challenging. Saturation in certain segments or regions could have contributed to a slight decrease in the CAGR.
Forecast CAGR | 7.6% |
---|
The historical CAGR of 8.7% signifies a phase of significant growth, while the forecasted CAGR of 7.6% suggests a moderation in the pace of expansion. The market is likely entering a phase of maturity where sustained growth requires strategic adaptation to economic and competitive challenges.
Companies continue to invest in research and development, aiming to bring forth even more advanced and cost-effective antimicrobial textile solutions. Continued innovation may counterbalance the factors contributing to the forecasted decline. As international markets adopt more stringent infection control measures, the demand for antimicrobial textiles could experience a resurgence.
Community Health Initiatives Fuels Adoption of Antimicrobial Hospital Textile
Antimicrobial textiles extend beyond hospitals, with companies promoting their use in community settings such as schools and public spaces. This trend aligns with a broader focus on community health and infection prevention. The application of antimicrobial textiles in diverse environments contributes to overall public health and creates new market opportunities beyond traditional healthcare settings.
Antimicrobial Textiles in Telemedicine Environments
With the rise of telemedicine, there is a growing trend to integrate antimicrobial textiles into home healthcare setups. Companies are developing textiles for patient wear and home furnishings that contribute to infection control in remote healthcare environments. The expansion of antimicrobial textiles beyond traditional hospital spaces aligns with the evolving healthcare delivery, emphasizing the importance of infection prevention in diverse settings.
Nanotechnology in Antimicrobial Textiles
An emerging trend involves the application of nanotechnology to enhance the antimicrobial properties of textiles. Companies are exploring nanomaterials that can provide more effective and long-lasting protection against pathogens. The integration of nanotechnology not only improves the performance of antimicrobial textiles but also opens avenues for developing fabrics with self-cleaning and self-renewing capabilities.
Biodegradable Antimicrobial Textiles
A sustainable trend involves the development of biodegradable antimicrobial textiles. Companies are exploring materials that not only combat infections but also have minimal environmental impact, addressing concerns about textile waste. Biodegradable antimicrobial textiles resonate with the growing demand for sustainable solutions, appealing to environmentally conscious healthcare providers and institutions.
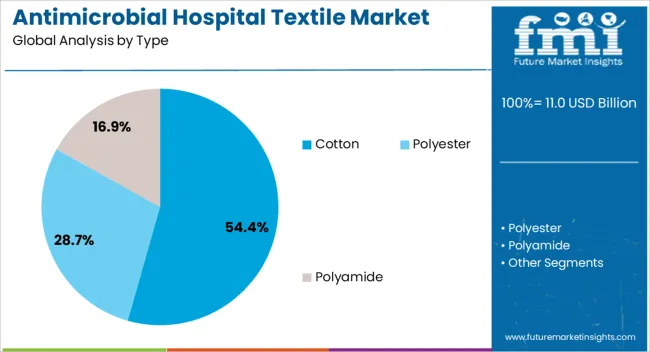
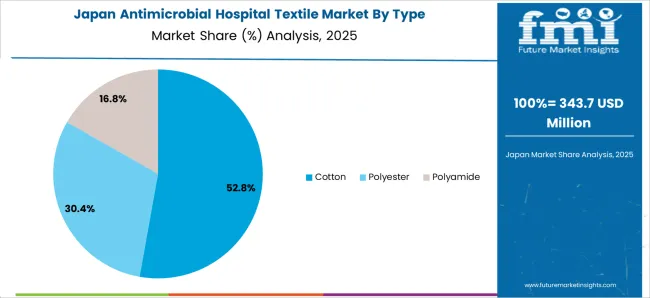
This section provides detailed insights into specific categories in the antimicrobial hospital textile industry. Cotton reigns supreme in the antimicrobial hospital textile market, boasting a CAGR of 8.5% between 2019 and 2023 and a projected 7.5% CAGR until 2034.
Top Type | Cotton |
---|---|
CAGR % 2019 to 2023 | 8.5% |
CAGR % 2024 to 2034 | 7.5% |
With a projected CAGR of 7.5% from 2024 to 2034, cotton maintains its position as the top material choice. Its affordability, comfort, and widespread adoption in hospital settings cement its leadership.
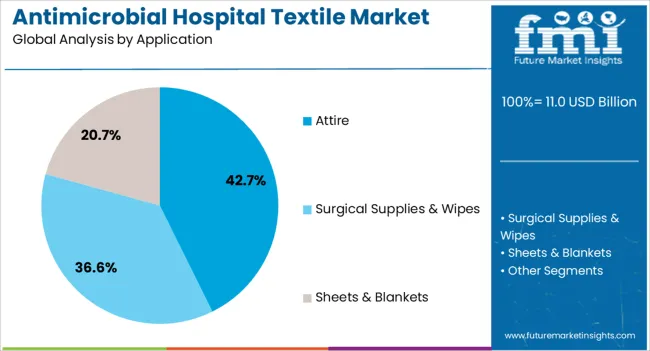
Dominating Application Segment | Attire |
---|---|
CAGR % 2019 to 2023 | 8.3% |
CAGR % 2024 to 2034 | 7.1% |
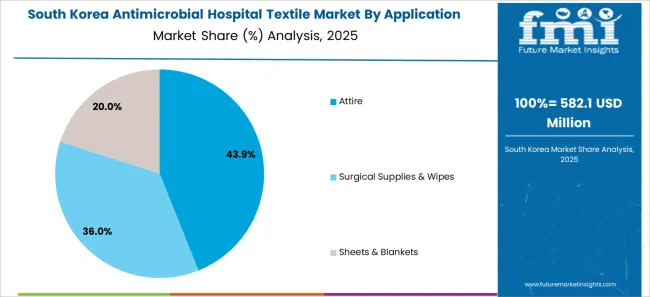
The attire segment, boasting a 7.1% CAGR through 2034, is poised to lead application areas. As hygiene concerns remain paramount, demand for antimicrobial medical uniforms, scrubs, and patient gowns continues to soar.
The section analyzes the antimicrobial hospital textile market across key countries, including the United States, United Kingdom, China, Japan, and South Korea. The analysis delves into the specific factors driving the demand, adoption, and sales of antimicrobial hospital textiles in these countries.
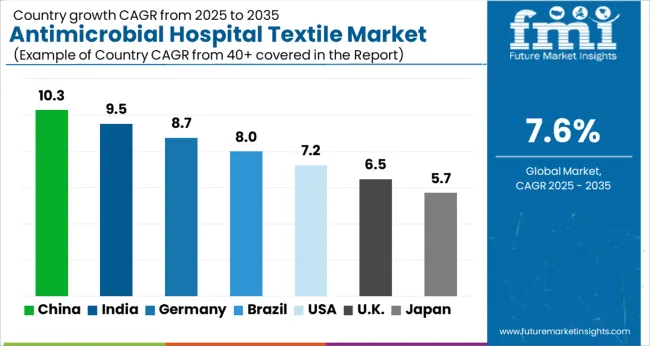
Country | CAGR |
---|---|
United States | 8.1% |
United Kingdom | 7.8% |
China | 7.9% |
Japan | 8.2% |
South Korea | 8.8% |
The antimicrobial hospital textile industry in the United States is anticipated to rise at a CAGR of 8.1% through 2034.
The antimicrobial hospital textile industry in the United Kingdom is projected to rise at a CAGR of 7.8% through 2034.
China’s antimicrobial hospital textile industry is likely to witness expansion at a CAGR of 7.9% through 2034.
Japan's antimicrobial hospital textile industry is projected to rise at a CAGR of 8.2% through 2034.
The antimicrobial hospital textile industry in South Korea is poised to witness expansion at a CAGR of 8.8% through 2034.
The antimicrobial hospital textile industry is a hotbed of competition, with established players defending their turf while innovative startups strive for a foothold. Players constantly refine existing solutions and explore new frontiers, offering ever-more effective and user-friendly antimicrobial textiles. Functionality reigns supreme, with textiles boasting targeted properties like specific pathogen resistance or enhanced breathability.
Balancing cost with value is a constant tightrope walk. Healthcare facilities, ever mindful of budgets, demand affordability, leading to intense price competition. However, players can't simply slash prices. They must demonstrate the unique value proposition of their textiles, highlighting long-term cost savings through infection prevention or superior durability.
Regulatory hurdles add another layer of complexity. Stringent safety and efficacy standards can create entry barriers for new players, while established players must navigate compliance requirements. Adapting quickly and ensuring products meet the highest standards is crucial for survival.
The growing focus on environmental responsibility is transforming the competition. Players are adopting eco-friendly practices, utilizing recycled materials, and minimizing their environmental impact. This shift presents both challenges and opportunities, with sustainable solutions potentially attracting environmentally conscious buyers and commanding premium prices.
Recent Developments in the Antimicrobial Hospital Textile Industry:
Table 1: Global Market Value (US$ Million) Forecast by Region, 2019 to 2034
Table 2: Global Market Volume (Tons) Forecast by Region, 2019 to 2034
Table 3: Global Market Value (US$ Million) Forecast by Material, 2019 to 2034
Table 4: Global Market Volume (Tons) Forecast by Material, 2019 to 2034
Table 5: Global Market Value (US$ Million) Forecast by Usability, 2019 to 2034
Table 6: Global Market Volume (Tons) Forecast by Usability, 2019 to 2034
Table 7: Global Market Value (US$ Million) Forecast by FDA Class, 2019 to 2034
Table 8: Global Market Volume (Tons) Forecast by FDA Class, 2019 to 2034
Table 9: Global Market Value (US$ Million) Forecast by Application, 2019 to 2034
Table 10: Global Market Volume (Tons) Forecast by Application, 2019 to 2034
Table 11: Global Market Value (US$ Million) Forecast by Hospital Department, 2019 to 2034
Table 12: Global Market Volume (Tons) Forecast by Hospital Department, 2019 to 2034
Table 13: North America Market Value (US$ Million) Forecast by Country, 2019 to 2034
Table 14: North America Market Volume (Tons) Forecast by Country, 2019 to 2034
Table 15: North America Market Value (US$ Million) Forecast by Material, 2019 to 2034
Table 16: North America Market Volume (Tons) Forecast by Material, 2019 to 2034
Table 17: North America Market Value (US$ Million) Forecast by Usability, 2019 to 2034
Table 18: North America Market Volume (Tons) Forecast by Usability, 2019 to 2034
Table 19: North America Market Value (US$ Million) Forecast by FDA Class, 2019 to 2034
Table 20: North America Market Volume (Tons) Forecast by FDA Class, 2019 to 2034
Table 21: North America Market Value (US$ Million) Forecast by Application, 2019 to 2034
Table 22: North America Market Volume (Tons) Forecast by Application, 2019 to 2034
Table 23: North America Market Value (US$ Million) Forecast by Hospital Department, 2019 to 2034
Table 24: North America Market Volume (Tons) Forecast by Hospital Department, 2019 to 2034
Table 25: Latin America Market Value (US$ Million) Forecast by Country, 2019 to 2034
Table 26: Latin America Market Volume (Tons) Forecast by Country, 2019 to 2034
Table 27: Latin America Market Value (US$ Million) Forecast by Material, 2019 to 2034
Table 28: Latin America Market Volume (Tons) Forecast by Material, 2019 to 2034
Table 29: Latin America Market Value (US$ Million) Forecast by Usability, 2019 to 2034
Table 30: Latin America Market Volume (Tons) Forecast by Usability, 2019 to 2034
Table 31: Latin America Market Value (US$ Million) Forecast by FDA Class, 2019 to 2034
Table 32: Latin America Market Volume (Tons) Forecast by FDA Class, 2019 to 2034
Table 33: Latin America Market Value (US$ Million) Forecast by Application, 2019 to 2034
Table 34: Latin America Market Volume (Tons) Forecast by Application, 2019 to 2034
Table 35: Latin America Market Value (US$ Million) Forecast by Hospital Department, 2019 to 2034
Table 36: Latin America Market Volume (Tons) Forecast by Hospital Department, 2019 to 2034
Table 37: Western Europe Market Value (US$ Million) Forecast by Country, 2019 to 2034
Table 38: Western Europe Market Volume (Tons) Forecast by Country, 2019 to 2034
Table 39: Western Europe Market Value (US$ Million) Forecast by Material, 2019 to 2034
Table 40: Western Europe Market Volume (Tons) Forecast by Material, 2019 to 2034
Table 41: Western Europe Market Value (US$ Million) Forecast by Usability, 2019 to 2034
Table 42: Western Europe Market Volume (Tons) Forecast by Usability, 2019 to 2034
Table 43: Western Europe Market Value (US$ Million) Forecast by FDA Class, 2019 to 2034
Table 44: Western Europe Market Volume (Tons) Forecast by FDA Class, 2019 to 2034
Table 45: Western Europe Market Value (US$ Million) Forecast by Application, 2019 to 2034
Table 46: Western Europe Market Volume (Tons) Forecast by Application, 2019 to 2034
Table 47: Western Europe Market Value (US$ Million) Forecast by Hospital Department, 2019 to 2034
Table 48: Western Europe Market Volume (Tons) Forecast by Hospital Department, 2019 to 2034
Table 49: Eastern Europe Market Value (US$ Million) Forecast by Country, 2019 to 2034
Table 50: Eastern Europe Market Volume (Tons) Forecast by Country, 2019 to 2034
Table 51: Eastern Europe Market Value (US$ Million) Forecast by Material, 2019 to 2034
Table 52: Eastern Europe Market Volume (Tons) Forecast by Material, 2019 to 2034
Table 53: Eastern Europe Market Value (US$ Million) Forecast by Usability, 2019 to 2034
Table 54: Eastern Europe Market Volume (Tons) Forecast by Usability, 2019 to 2034
Table 55: Eastern Europe Market Value (US$ Million) Forecast by FDA Class, 2019 to 2034
Table 56: Eastern Europe Market Volume (Tons) Forecast by FDA Class, 2019 to 2034
Table 57: Eastern Europe Market Value (US$ Million) Forecast by Application, 2019 to 2034
Table 58: Eastern Europe Market Volume (Tons) Forecast by Application, 2019 to 2034
Table 59: Eastern Europe Market Value (US$ Million) Forecast by Hospital Department, 2019 to 2034
Table 60: Eastern Europe Market Volume (Tons) Forecast by Hospital Department, 2019 to 2034
Table 61: South Asia and Pacific Market Value (US$ Million) Forecast by Country, 2019 to 2034
Table 62: South Asia and Pacific Market Volume (Tons) Forecast by Country, 2019 to 2034
Table 63: South Asia and Pacific Market Value (US$ Million) Forecast by Material, 2019 to 2034
Table 64: South Asia and Pacific Market Volume (Tons) Forecast by Material, 2019 to 2034
Table 65: South Asia and Pacific Market Value (US$ Million) Forecast by Usability, 2019 to 2034
Table 66: South Asia and Pacific Market Volume (Tons) Forecast by Usability, 2019 to 2034
Table 67: South Asia and Pacific Market Value (US$ Million) Forecast by FDA Class, 2019 to 2034
Table 68: South Asia and Pacific Market Volume (Tons) Forecast by FDA Class, 2019 to 2034
Table 69: South Asia and Pacific Market Value (US$ Million) Forecast by Application, 2019 to 2034
Table 70: South Asia and Pacific Market Volume (Tons) Forecast by Application, 2019 to 2034
Table 71: South Asia and Pacific Market Value (US$ Million) Forecast by Hospital Department, 2019 to 2034
Table 72: South Asia and Pacific Market Volume (Tons) Forecast by Hospital Department, 2019 to 2034
Table 73: East Asia Market Value (US$ Million) Forecast by Country, 2019 to 2034
Table 74: East Asia Market Volume (Tons) Forecast by Country, 2019 to 2034
Table 75: East Asia Market Value (US$ Million) Forecast by Material, 2019 to 2034
Table 76: East Asia Market Volume (Tons) Forecast by Material, 2019 to 2034
Table 77: East Asia Market Value (US$ Million) Forecast by Usability, 2019 to 2034
Table 78: East Asia Market Volume (Tons) Forecast by Usability, 2019 to 2034
Table 79: East Asia Market Value (US$ Million) Forecast by FDA Class, 2019 to 2034
Table 80: East Asia Market Volume (Tons) Forecast by FDA Class, 2019 to 2034
Table 81: East Asia Market Value (US$ Million) Forecast by Application, 2019 to 2034
Table 82: East Asia Market Volume (Tons) Forecast by Application, 2019 to 2034
Table 83: East Asia Market Value (US$ Million) Forecast by Hospital Department, 2019 to 2034
Table 84: East Asia Market Volume (Tons) Forecast by Hospital Department, 2019 to 2034
Table 85: Middle East and Africa Market Value (US$ Million) Forecast by Country, 2019 to 2034
Table 86: Middle East and Africa Market Volume (Tons) Forecast by Country, 2019 to 2034
Table 87: Middle East and Africa Market Value (US$ Million) Forecast by Material, 2019 to 2034
Table 88: Middle East and Africa Market Volume (Tons) Forecast by Material, 2019 to 2034
Table 89: Middle East and Africa Market Value (US$ Million) Forecast by Usability, 2019 to 2034
Table 90: Middle East and Africa Market Volume (Tons) Forecast by Usability, 2019 to 2034
Table 91: Middle East and Africa Market Value (US$ Million) Forecast by FDA Class, 2019 to 2034
Table 92: Middle East and Africa Market Volume (Tons) Forecast by FDA Class, 2019 to 2034
Table 93: Middle East and Africa Market Value (US$ Million) Forecast by Application, 2019 to 2034
Table 94: Middle East and Africa Market Volume (Tons) Forecast by Application, 2019 to 2034
Table 95: Middle East and Africa Market Value (US$ Million) Forecast by Hospital Department, 2019 to 2034
Table 96: Middle East and Africa Market Volume (Tons) Forecast by Hospital Department, 2019 to 2034
Figure 1: Global Market Value (US$ Million) by Material, 2024 to 2034
Figure 2: Global Market Value (US$ Million) by Usability, 2024 to 2034
Figure 3: Global Market Value (US$ Million) by FDA Class, 2024 to 2034
Figure 4: Global Market Value (US$ Million) by Application, 2024 to 2034
Figure 5: Global Market Value (US$ Million) by Hospital Department, 2024 to 2034
Figure 6: Global Market Value (US$ Million) by Region, 2024 to 2034
Figure 7: Global Market Value (US$ Million) Analysis by Region, 2019 to 2034
Figure 8: Global Market Volume (Tons) Analysis by Region, 2019 to 2034
Figure 9: Global Market Value Share (%) and BPS Analysis by Region, 2024 to 2034
Figure 10: Global Market Y-o-Y Growth (%) Projections by Region, 2024 to 2034
Figure 11: Global Market Value (US$ Million) Analysis by Material, 2019 to 2034
Figure 12: Global Market Volume (Tons) Analysis by Material, 2019 to 2034
Figure 13: Global Market Value Share (%) and BPS Analysis by Material, 2024 to 2034
Figure 14: Global Market Y-o-Y Growth (%) Projections by Material, 2024 to 2034
Figure 15: Global Market Value (US$ Million) Analysis by Usability, 2019 to 2034
Figure 16: Global Market Volume (Tons) Analysis by Usability, 2019 to 2034
Figure 17: Global Market Value Share (%) and BPS Analysis by Usability, 2024 to 2034
Figure 18: Global Market Y-o-Y Growth (%) Projections by Usability, 2024 to 2034
Figure 19: Global Market Value (US$ Million) Analysis by FDA Class, 2019 to 2034
Figure 20: Global Market Volume (Tons) Analysis by FDA Class, 2019 to 2034
Figure 21: Global Market Value Share (%) and BPS Analysis by FDA Class, 2024 to 2034
Figure 22: Global Market Y-o-Y Growth (%) Projections by FDA Class, 2024 to 2034
Figure 23: Global Market Value (US$ Million) Analysis by Application, 2019 to 2034
Figure 24: Global Market Volume (Tons) Analysis by Application, 2019 to 2034
Figure 25: Global Market Value Share (%) and BPS Analysis by Application, 2024 to 2034
Figure 26: Global Market Y-o-Y Growth (%) Projections by Application, 2024 to 2034
Figure 27: Global Market Value (US$ Million) Analysis by Hospital Department, 2019 to 2034
Figure 28: Global Market Volume (Tons) Analysis by Hospital Department, 2019 to 2034
Figure 29: Global Market Value Share (%) and BPS Analysis by Hospital Department, 2024 to 2034
Figure 30: Global Market Y-o-Y Growth (%) Projections by Hospital Department, 2024 to 2034
Figure 31: Global Market Attractiveness by Material, 2024 to 2034
Figure 32: Global Market Attractiveness by Usability, 2024 to 2034
Figure 33: Global Market Attractiveness by FDA Class, 2024 to 2034
Figure 34: Global Market Attractiveness by Application, 2024 to 2034
Figure 35: Global Market Attractiveness by Hospital Department, 2024 to 2034
Figure 36: Global Market Attractiveness by Region, 2024 to 2034
Figure 37: North America Market Value (US$ Million) by Material, 2024 to 2034
Figure 38: North America Market Value (US$ Million) by Usability, 2024 to 2034
Figure 39: North America Market Value (US$ Million) by FDA Class, 2024 to 2034
Figure 40: North America Market Value (US$ Million) by Application, 2024 to 2034
Figure 41: North America Market Value (US$ Million) by Hospital Department, 2024 to 2034
Figure 42: North America Market Value (US$ Million) by Country, 2024 to 2034
Figure 43: North America Market Value (US$ Million) Analysis by Country, 2019 to 2034
Figure 44: North America Market Volume (Tons) Analysis by Country, 2019 to 2034
Figure 45: North America Market Value Share (%) and BPS Analysis by Country, 2024 to 2034
Figure 46: North America Market Y-o-Y Growth (%) Projections by Country, 2024 to 2034
Figure 47: North America Market Value (US$ Million) Analysis by Material, 2019 to 2034
Figure 48: North America Market Volume (Tons) Analysis by Material, 2019 to 2034
Figure 49: North America Market Value Share (%) and BPS Analysis by Material, 2024 to 2034
Figure 50: North America Market Y-o-Y Growth (%) Projections by Material, 2024 to 2034
Figure 51: North America Market Value (US$ Million) Analysis by Usability, 2019 to 2034
Figure 52: North America Market Volume (Tons) Analysis by Usability, 2019 to 2034
Figure 53: North America Market Value Share (%) and BPS Analysis by Usability, 2024 to 2034
Figure 54: North America Market Y-o-Y Growth (%) Projections by Usability, 2024 to 2034
Figure 55: North America Market Value (US$ Million) Analysis by FDA Class, 2019 to 2034
Figure 56: North America Market Volume (Tons) Analysis by FDA Class, 2019 to 2034
Figure 57: North America Market Value Share (%) and BPS Analysis by FDA Class, 2024 to 2034
Figure 58: North America Market Y-o-Y Growth (%) Projections by FDA Class, 2024 to 2034
Figure 59: North America Market Value (US$ Million) Analysis by Application, 2019 to 2034
Figure 60: North America Market Volume (Tons) Analysis by Application, 2019 to 2034
Figure 61: North America Market Value Share (%) and BPS Analysis by Application, 2024 to 2034
Figure 62: North America Market Y-o-Y Growth (%) Projections by Application, 2024 to 2034
Figure 63: North America Market Value (US$ Million) Analysis by Hospital Department, 2019 to 2034
Figure 64: North America Market Volume (Tons) Analysis by Hospital Department, 2019 to 2034
Figure 65: North America Market Value Share (%) and BPS Analysis by Hospital Department, 2024 to 2034
Figure 66: North America Market Y-o-Y Growth (%) Projections by Hospital Department, 2024 to 2034
Figure 67: North America Market Attractiveness by Material, 2024 to 2034
Figure 68: North America Market Attractiveness by Usability, 2024 to 2034
Figure 69: North America Market Attractiveness by FDA Class, 2024 to 2034
Figure 70: North America Market Attractiveness by Application, 2024 to 2034
Figure 71: North America Market Attractiveness by Hospital Department, 2024 to 2034
Figure 72: North America Market Attractiveness by Country, 2024 to 2034
Figure 73: Latin America Market Value (US$ Million) by Material, 2024 to 2034
Figure 74: Latin America Market Value (US$ Million) by Usability, 2024 to 2034
Figure 75: Latin America Market Value (US$ Million) by FDA Class, 2024 to 2034
Figure 76: Latin America Market Value (US$ Million) by Application, 2024 to 2034
Figure 77: Latin America Market Value (US$ Million) by Hospital Department, 2024 to 2034
Figure 78: Latin America Market Value (US$ Million) by Country, 2024 to 2034
Figure 79: Latin America Market Value (US$ Million) Analysis by Country, 2019 to 2034
Figure 80: Latin America Market Volume (Tons) Analysis by Country, 2019 to 2034
Figure 81: Latin America Market Value Share (%) and BPS Analysis by Country, 2024 to 2034
Figure 82: Latin America Market Y-o-Y Growth (%) Projections by Country, 2024 to 2034
Figure 83: Latin America Market Value (US$ Million) Analysis by Material, 2019 to 2034
Figure 84: Latin America Market Volume (Tons) Analysis by Material, 2019 to 2034
Figure 85: Latin America Market Value Share (%) and BPS Analysis by Material, 2024 to 2034
Figure 86: Latin America Market Y-o-Y Growth (%) Projections by Material, 2024 to 2034
Figure 87: Latin America Market Value (US$ Million) Analysis by Usability, 2019 to 2034
Figure 88: Latin America Market Volume (Tons) Analysis by Usability, 2019 to 2034
Figure 89: Latin America Market Value Share (%) and BPS Analysis by Usability, 2024 to 2034
Figure 90: Latin America Market Y-o-Y Growth (%) Projections by Usability, 2024 to 2034
Figure 91: Latin America Market Value (US$ Million) Analysis by FDA Class, 2019 to 2034
Figure 92: Latin America Market Volume (Tons) Analysis by FDA Class, 2019 to 2034
Figure 93: Latin America Market Value Share (%) and BPS Analysis by FDA Class, 2024 to 2034
Figure 94: Latin America Market Y-o-Y Growth (%) Projections by FDA Class, 2024 to 2034
Figure 95: Latin America Market Value (US$ Million) Analysis by Application, 2019 to 2034
Figure 96: Latin America Market Volume (Tons) Analysis by Application, 2019 to 2034
Figure 97: Latin America Market Value Share (%) and BPS Analysis by Application, 2024 to 2034
Figure 98: Latin America Market Y-o-Y Growth (%) Projections by Application, 2024 to 2034
Figure 99: Latin America Market Value (US$ Million) Analysis by Hospital Department, 2019 to 2034
Figure 100: Latin America Market Volume (Tons) Analysis by Hospital Department, 2019 to 2034
Figure 101: Latin America Market Value Share (%) and BPS Analysis by Hospital Department, 2024 to 2034
Figure 102: Latin America Market Y-o-Y Growth (%) Projections by Hospital Department, 2024 to 2034
Figure 103: Latin America Market Attractiveness by Material, 2024 to 2034
Figure 104: Latin America Market Attractiveness by Usability, 2024 to 2034
Figure 105: Latin America Market Attractiveness by FDA Class, 2024 to 2034
Figure 106: Latin America Market Attractiveness by Application, 2024 to 2034
Figure 107: Latin America Market Attractiveness by Hospital Department, 2024 to 2034
Figure 108: Latin America Market Attractiveness by Country, 2024 to 2034
Figure 109: Western Europe Market Value (US$ Million) by Material, 2024 to 2034
Figure 110: Western Europe Market Value (US$ Million) by Usability, 2024 to 2034
Figure 111: Western Europe Market Value (US$ Million) by FDA Class, 2024 to 2034
Figure 112: Western Europe Market Value (US$ Million) by Application, 2024 to 2034
Figure 113: Western Europe Market Value (US$ Million) by Hospital Department, 2024 to 2034
Figure 114: Western Europe Market Value (US$ Million) by Country, 2024 to 2034
Figure 115: Western Europe Market Value (US$ Million) Analysis by Country, 2019 to 2034
Figure 116: Western Europe Market Volume (Tons) Analysis by Country, 2019 to 2034
Figure 117: Western Europe Market Value Share (%) and BPS Analysis by Country, 2024 to 2034
Figure 118: Western Europe Market Y-o-Y Growth (%) Projections by Country, 2024 to 2034
Figure 119: Western Europe Market Value (US$ Million) Analysis by Material, 2019 to 2034
Figure 120: Western Europe Market Volume (Tons) Analysis by Material, 2019 to 2034
Figure 121: Western Europe Market Value Share (%) and BPS Analysis by Material, 2024 to 2034
Figure 122: Western Europe Market Y-o-Y Growth (%) Projections by Material, 2024 to 2034
Figure 123: Western Europe Market Value (US$ Million) Analysis by Usability, 2019 to 2034
Figure 124: Western Europe Market Volume (Tons) Analysis by Usability, 2019 to 2034
Figure 125: Western Europe Market Value Share (%) and BPS Analysis by Usability, 2024 to 2034
Figure 126: Western Europe Market Y-o-Y Growth (%) Projections by Usability, 2024 to 2034
Figure 127: Western Europe Market Value (US$ Million) Analysis by FDA Class, 2019 to 2034
Figure 128: Western Europe Market Volume (Tons) Analysis by FDA Class, 2019 to 2034
Figure 129: Western Europe Market Value Share (%) and BPS Analysis by FDA Class, 2024 to 2034
Figure 130: Western Europe Market Y-o-Y Growth (%) Projections by FDA Class, 2024 to 2034
Figure 131: Western Europe Market Value (US$ Million) Analysis by Application, 2019 to 2034
Figure 132: Western Europe Market Volume (Tons) Analysis by Application, 2019 to 2034
Figure 133: Western Europe Market Value Share (%) and BPS Analysis by Application, 2024 to 2034
Figure 134: Western Europe Market Y-o-Y Growth (%) Projections by Application, 2024 to 2034
Figure 135: Western Europe Market Value (US$ Million) Analysis by Hospital Department, 2019 to 2034
Figure 136: Western Europe Market Volume (Tons) Analysis by Hospital Department, 2019 to 2034
Figure 137: Western Europe Market Value Share (%) and BPS Analysis by Hospital Department, 2024 to 2034
Figure 138: Western Europe Market Y-o-Y Growth (%) Projections by Hospital Department, 2024 to 2034
Figure 139: Western Europe Market Attractiveness by Material, 2024 to 2034
Figure 140: Western Europe Market Attractiveness by Usability, 2024 to 2034
Figure 141: Western Europe Market Attractiveness by FDA Class, 2024 to 2034
Figure 142: Western Europe Market Attractiveness by Application, 2024 to 2034
Figure 143: Western Europe Market Attractiveness by Hospital Department, 2024 to 2034
Figure 144: Western Europe Market Attractiveness by Country, 2024 to 2034
Figure 145: Eastern Europe Market Value (US$ Million) by Material, 2024 to 2034
Figure 146: Eastern Europe Market Value (US$ Million) by Usability, 2024 to 2034
Figure 147: Eastern Europe Market Value (US$ Million) by FDA Class, 2024 to 2034
Figure 148: Eastern Europe Market Value (US$ Million) by Application, 2024 to 2034
Figure 149: Eastern Europe Market Value (US$ Million) by Hospital Department, 2024 to 2034
Figure 150: Eastern Europe Market Value (US$ Million) by Country, 2024 to 2034
Figure 151: Eastern Europe Market Value (US$ Million) Analysis by Country, 2019 to 2034
Figure 152: Eastern Europe Market Volume (Tons) Analysis by Country, 2019 to 2034
Figure 153: Eastern Europe Market Value Share (%) and BPS Analysis by Country, 2024 to 2034
Figure 154: Eastern Europe Market Y-o-Y Growth (%) Projections by Country, 2024 to 2034
Figure 155: Eastern Europe Market Value (US$ Million) Analysis by Material, 2019 to 2034
Figure 156: Eastern Europe Market Volume (Tons) Analysis by Material, 2019 to 2034
Figure 157: Eastern Europe Market Value Share (%) and BPS Analysis by Material, 2024 to 2034
Figure 158: Eastern Europe Market Y-o-Y Growth (%) Projections by Material, 2024 to 2034
Figure 159: Eastern Europe Market Value (US$ Million) Analysis by Usability, 2019 to 2034
Figure 160: Eastern Europe Market Volume (Tons) Analysis by Usability, 2019 to 2034
Figure 161: Eastern Europe Market Value Share (%) and BPS Analysis by Usability, 2024 to 2034
Figure 162: Eastern Europe Market Y-o-Y Growth (%) Projections by Usability, 2024 to 2034
Figure 163: Eastern Europe Market Value (US$ Million) Analysis by FDA Class, 2019 to 2034
Figure 164: Eastern Europe Market Volume (Tons) Analysis by FDA Class, 2019 to 2034
Figure 165: Eastern Europe Market Value Share (%) and BPS Analysis by FDA Class, 2024 to 2034
Figure 166: Eastern Europe Market Y-o-Y Growth (%) Projections by FDA Class, 2024 to 2034
Figure 167: Eastern Europe Market Value (US$ Million) Analysis by Application, 2019 to 2034
Figure 168: Eastern Europe Market Volume (Tons) Analysis by Application, 2019 to 2034
Figure 169: Eastern Europe Market Value Share (%) and BPS Analysis by Application, 2024 to 2034
Figure 170: Eastern Europe Market Y-o-Y Growth (%) Projections by Application, 2024 to 2034
Figure 171: Eastern Europe Market Value (US$ Million) Analysis by Hospital Department, 2019 to 2034
Figure 172: Eastern Europe Market Volume (Tons) Analysis by Hospital Department, 2019 to 2034
Figure 173: Eastern Europe Market Value Share (%) and BPS Analysis by Hospital Department, 2024 to 2034
Figure 174: Eastern Europe Market Y-o-Y Growth (%) Projections by Hospital Department, 2024 to 2034
Figure 175: Eastern Europe Market Attractiveness by Material, 2024 to 2034
Figure 176: Eastern Europe Market Attractiveness by Usability, 2024 to 2034
Figure 177: Eastern Europe Market Attractiveness by FDA Class, 2024 to 2034
Figure 178: Eastern Europe Market Attractiveness by Application, 2024 to 2034
Figure 179: Eastern Europe Market Attractiveness by Hospital Department, 2024 to 2034
Figure 180: Eastern Europe Market Attractiveness by Country, 2024 to 2034
Figure 181: South Asia and Pacific Market Value (US$ Million) by Material, 2024 to 2034
Figure 182: South Asia and Pacific Market Value (US$ Million) by Usability, 2024 to 2034
Figure 183: South Asia and Pacific Market Value (US$ Million) by FDA Class, 2024 to 2034
Figure 184: South Asia and Pacific Market Value (US$ Million) by Application, 2024 to 2034
Figure 185: South Asia and Pacific Market Value (US$ Million) by Hospital Department, 2024 to 2034
Figure 186: South Asia and Pacific Market Value (US$ Million) by Country, 2024 to 2034
Figure 187: South Asia and Pacific Market Value (US$ Million) Analysis by Country, 2019 to 2034
Figure 188: South Asia and Pacific Market Volume (Tons) Analysis by Country, 2019 to 2034
Figure 189: South Asia and Pacific Market Value Share (%) and BPS Analysis by Country, 2024 to 2034
Figure 190: South Asia and Pacific Market Y-o-Y Growth (%) Projections by Country, 2024 to 2034
Figure 191: South Asia and Pacific Market Value (US$ Million) Analysis by Material, 2019 to 2034
Figure 192: South Asia and Pacific Market Volume (Tons) Analysis by Material, 2019 to 2034
Figure 193: South Asia and Pacific Market Value Share (%) and BPS Analysis by Material, 2024 to 2034
Figure 194: South Asia and Pacific Market Y-o-Y Growth (%) Projections by Material, 2024 to 2034
Figure 195: South Asia and Pacific Market Value (US$ Million) Analysis by Usability, 2019 to 2034
Figure 196: South Asia and Pacific Market Volume (Tons) Analysis by Usability, 2019 to 2034
Figure 197: South Asia and Pacific Market Value Share (%) and BPS Analysis by Usability, 2024 to 2034
Figure 198: South Asia and Pacific Market Y-o-Y Growth (%) Projections by Usability, 2024 to 2034
Figure 199: South Asia and Pacific Market Value (US$ Million) Analysis by FDA Class, 2019 to 2034
Figure 200: South Asia and Pacific Market Volume (Tons) Analysis by FDA Class, 2019 to 2034
Figure 201: South Asia and Pacific Market Value Share (%) and BPS Analysis by FDA Class, 2024 to 2034
Figure 202: South Asia and Pacific Market Y-o-Y Growth (%) Projections by FDA Class, 2024 to 2034
Figure 203: South Asia and Pacific Market Value (US$ Million) Analysis by Application, 2019 to 2034
Figure 204: South Asia and Pacific Market Volume (Tons) Analysis by Application, 2019 to 2034
Figure 205: South Asia and Pacific Market Value Share (%) and BPS Analysis by Application, 2024 to 2034
Figure 206: South Asia and Pacific Market Y-o-Y Growth (%) Projections by Application, 2024 to 2034
Figure 207: South Asia and Pacific Market Value (US$ Million) Analysis by Hospital Department, 2019 to 2034
Figure 208: South Asia and Pacific Market Volume (Tons) Analysis by Hospital Department, 2019 to 2034
Figure 209: South Asia and Pacific Market Value Share (%) and BPS Analysis by Hospital Department, 2024 to 2034
Figure 210: South Asia and Pacific Market Y-o-Y Growth (%) Projections by Hospital Department, 2024 to 2034
Figure 211: South Asia and Pacific Market Attractiveness by Material, 2024 to 2034
Figure 212: South Asia and Pacific Market Attractiveness by Usability, 2024 to 2034
Figure 213: South Asia and Pacific Market Attractiveness by FDA Class, 2024 to 2034
Figure 214: South Asia and Pacific Market Attractiveness by Application, 2024 to 2034
Figure 215: South Asia and Pacific Market Attractiveness by Hospital Department, 2024 to 2034
Figure 216: South Asia and Pacific Market Attractiveness by Country, 2024 to 2034
Figure 217: East Asia Market Value (US$ Million) by Material, 2024 to 2034
Figure 218: East Asia Market Value (US$ Million) by Usability, 2024 to 2034
Figure 219: East Asia Market Value (US$ Million) by FDA Class, 2024 to 2034
Figure 220: East Asia Market Value (US$ Million) by Application, 2024 to 2034
Figure 221: East Asia Market Value (US$ Million) by Hospital Department, 2024 to 2034
Figure 222: East Asia Market Value (US$ Million) by Country, 2024 to 2034
Figure 223: East Asia Market Value (US$ Million) Analysis by Country, 2019 to 2034
Figure 224: East Asia Market Volume (Tons) Analysis by Country, 2019 to 2034
Figure 225: East Asia Market Value Share (%) and BPS Analysis by Country, 2024 to 2034
Figure 226: East Asia Market Y-o-Y Growth (%) Projections by Country, 2024 to 2034
Figure 227: East Asia Market Value (US$ Million) Analysis by Material, 2019 to 2034
Figure 228: East Asia Market Volume (Tons) Analysis by Material, 2019 to 2034
Figure 229: East Asia Market Value Share (%) and BPS Analysis by Material, 2024 to 2034
Figure 230: East Asia Market Y-o-Y Growth (%) Projections by Material, 2024 to 2034
Figure 231: East Asia Market Value (US$ Million) Analysis by Usability, 2019 to 2034
Figure 232: East Asia Market Volume (Tons) Analysis by Usability, 2019 to 2034
Figure 233: East Asia Market Value Share (%) and BPS Analysis by Usability, 2024 to 2034
Figure 234: East Asia Market Y-o-Y Growth (%) Projections by Usability, 2024 to 2034
Figure 235: East Asia Market Value (US$ Million) Analysis by FDA Class, 2019 to 2034
Figure 236: East Asia Market Volume (Tons) Analysis by FDA Class, 2019 to 2034
Figure 237: East Asia Market Value Share (%) and BPS Analysis by FDA Class, 2024 to 2034
Figure 238: East Asia Market Y-o-Y Growth (%) Projections by FDA Class, 2024 to 2034
Figure 239: East Asia Market Value (US$ Million) Analysis by Application, 2019 to 2034
Figure 240: East Asia Market Volume (Tons) Analysis by Application, 2019 to 2034
Figure 241: East Asia Market Value Share (%) and BPS Analysis by Application, 2024 to 2034
Figure 242: East Asia Market Y-o-Y Growth (%) Projections by Application, 2024 to 2034
Figure 243: East Asia Market Value (US$ Million) Analysis by Hospital Department, 2019 to 2034
Figure 244: East Asia Market Volume (Tons) Analysis by Hospital Department, 2019 to 2034
Figure 245: East Asia Market Value Share (%) and BPS Analysis by Hospital Department, 2024 to 2034
Figure 246: East Asia Market Y-o-Y Growth (%) Projections by Hospital Department, 2024 to 2034
Figure 247: East Asia Market Attractiveness by Material, 2024 to 2034
Figure 248: East Asia Market Attractiveness by Usability, 2024 to 2034
Figure 249: East Asia Market Attractiveness by FDA Class, 2024 to 2034
Figure 250: East Asia Market Attractiveness by Application, 2024 to 2034
Figure 251: East Asia Market Attractiveness by Hospital Department, 2024 to 2034
Figure 252: East Asia Market Attractiveness by Country, 2024 to 2034
Figure 253: Middle East and Africa Market Value (US$ Million) by Material, 2024 to 2034
Figure 254: Middle East and Africa Market Value (US$ Million) by Usability, 2024 to 2034
Figure 255: Middle East and Africa Market Value (US$ Million) by FDA Class, 2024 to 2034
Figure 256: Middle East and Africa Market Value (US$ Million) by Application, 2024 to 2034
Figure 257: Middle East and Africa Market Value (US$ Million) by Hospital Department, 2024 to 2034
Figure 258: Middle East and Africa Market Value (US$ Million) by Country, 2024 to 2034
Figure 259: Middle East and Africa Market Value (US$ Million) Analysis by Country, 2019 to 2034
Figure 260: Middle East and Africa Market Volume (Tons) Analysis by Country, 2019 to 2034
Figure 261: Middle East and Africa Market Value Share (%) and BPS Analysis by Country, 2024 to 2034
Figure 262: Middle East and Africa Market Y-o-Y Growth (%) Projections by Country, 2024 to 2034
Figure 263: Middle East and Africa Market Value (US$ Million) Analysis by Material, 2019 to 2034
Figure 264: Middle East and Africa Market Volume (Tons) Analysis by Material, 2019 to 2034
Figure 265: Middle East and Africa Market Value Share (%) and BPS Analysis by Material, 2024 to 2034
Figure 266: Middle East and Africa Market Y-o-Y Growth (%) Projections by Material, 2024 to 2034
Figure 267: Middle East and Africa Market Value (US$ Million) Analysis by Usability, 2019 to 2034
Figure 268: Middle East and Africa Market Volume (Tons) Analysis by Usability, 2019 to 2034
Figure 269: Middle East and Africa Market Value Share (%) and BPS Analysis by Usability, 2024 to 2034
Figure 270: Middle East and Africa Market Y-o-Y Growth (%) Projections by Usability, 2024 to 2034
Figure 271: Middle East and Africa Market Value (US$ Million) Analysis by FDA Class, 2019 to 2034
Figure 272: Middle East and Africa Market Volume (Tons) Analysis by FDA Class, 2019 to 2034
Figure 273: Middle East and Africa Market Value Share (%) and BPS Analysis by FDA Class, 2024 to 2034
Figure 274: Middle East and Africa Market Y-o-Y Growth (%) Projections by FDA Class, 2024 to 2034
Figure 275: Middle East and Africa Market Value (US$ Million) Analysis by Application, 2019 to 2034
Figure 276: Middle East and Africa Market Volume (Tons) Analysis by Application, 2019 to 2034
Figure 277: Middle East and Africa Market Value Share (%) and BPS Analysis by Application, 2024 to 2034
Figure 278: Middle East and Africa Market Y-o-Y Growth (%) Projections by Application, 2024 to 2034
Figure 279: Middle East and Africa Market Value (US$ Million) Analysis by Hospital Department, 2019 to 2034
Figure 280: Middle East and Africa Market Volume (Tons) Analysis by Hospital Department, 2019 to 2034
Figure 281: Middle East and Africa Market Value Share (%) and BPS Analysis by Hospital Department, 2024 to 2034
Figure 282: Middle East and Africa Market Y-o-Y Growth (%) Projections by Hospital Department, 2024 to 2034
Figure 283: Middle East and Africa Market Attractiveness by Material, 2024 to 2034
Figure 284: Middle East and Africa Market Attractiveness by Usability, 2024 to 2034
Figure 285: Middle East and Africa Market Attractiveness by FDA Class, 2024 to 2034
Figure 286: Middle East and Africa Market Attractiveness by Application, 2024 to 2034
Figure 287: Middle East and Africa Market Attractiveness by Hospital Department, 2024 to 2034
Figure 288: Middle East and Africa Market Attractiveness by Country, 2024 to 2034
The antimicrobial hospital textile market is projected to expand at a CAGR of 7.6% between 2024 and 2034.
The cotton segment dominates the antimicrobial hospital textile industry.
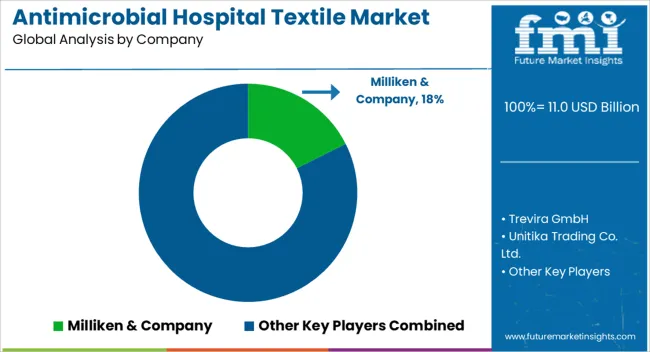
The top 3 antimicrobial hospital textile manufacturers are Milliken & Company, Trevira GmbH, and Unitika Trading Co. Ltd.
The antimicrobial hospital textile market is anticipated to surpass USD 19.8 billion by 2034.
The demand is propelled by infection awareness, regulations, and technological advancements.
The attire segment presents an untapped opportunity due to fashion-conscious infection prevention.
Explore Similar Insights
Thank you!
You will receive an email from our Business Development Manager. Please be sure to check your SPAM/JUNK folder too.