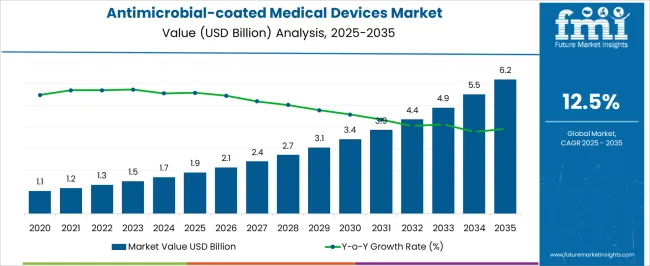
The Antimicrobial-coated Medical Devices Market is estimated to be valued at USD 1.9 billion in 2025 and is projected to reach USD 6.2 billion by 2035, registering a compound annual growth rate (CAGR) of 12.5% over the forecast period.
| Metric | Value |
|---|---|
| Antimicrobial-coated Medical Devices Market Estimated Value in (2025 E) | USD 1.9 billion |
| Antimicrobial-coated Medical Devices Market Forecast Value in (2035 F) | USD 6.2 billion |
| Forecast CAGR (2025 to 2035) | 12.5% |
The Antimicrobial-coated Medical Devices market is being driven by the increasing need to prevent healthcare associated infections and improve patient outcomes across a range of clinical environments. The current market scenario reflects a growing adoption of devices that integrate antimicrobial properties to reduce microbial colonization and subsequent infections. Hospitals, surgical centers, and outpatient care facilities are prioritizing patient safety and operational efficiency, which has encouraged the use of coated medical devices.
The future outlook is supported by rising awareness among healthcare providers regarding infection control, along with regulatory pressures to minimize hospital readmissions and treatment costs. Continuous research in coating materials and advancements in biocompatible formulations are enabling the development of next-generation devices. Additionally, the rising geriatric population and prevalence of chronic diseases are contributing to higher device usage.
Investments in innovative coatings, along with collaborations between medical device manufacturers and material science experts, are expected to further enhance the market's growth opportunities As infection control remains a critical priority in healthcare, the Antimicrobial-coated Medical Devices market is anticipated to maintain steady expansion in the coming years.
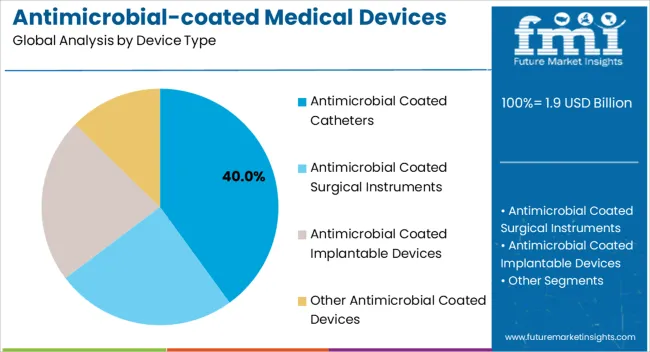
The Antimicrobial Coated Catheters segment is expected to hold 40.00% of the total Antimicrobial-coated Medical Devices market revenue in 2025, making it the leading device type. This position has been attributed to the widespread use of catheters in critical care settings, where prolonged device usage and exposure to hospital environments increase the risk of infections. The integration of antimicrobial coatings on catheters has been favored for its ability to prevent biofilm formation and reduce microbial adhesion, which are common contributors to catheter-associated infections.
The growing demand for safer vascular access and urinary management devices has further supported the adoption of coated catheters. The ability of such devices to lower infection rates and associated treatment costs has encouraged healthcare providers to prioritize their usage.
Additionally, the ease of integrating coatings during manufacturing without significant changes to existing catheter designs has enabled scalable deployment As regulatory frameworks increasingly mandate infection control measures, the Antimicrobial Coated Catheters segment is expected to sustain its leadership, driven by ongoing innovations in coating technologies and rising patient care standards.
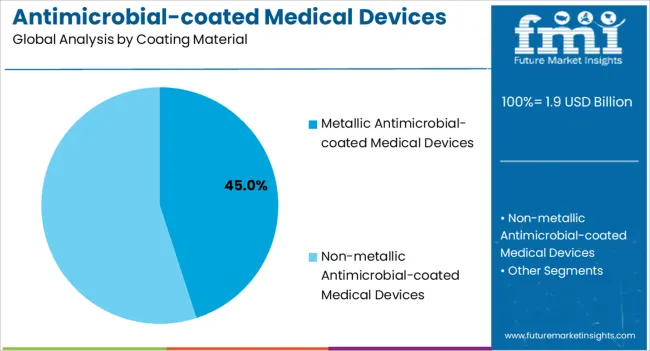
The Metallic Antimicrobial-coated Medical Devices segment is projected to account for 45.00% of the total Antimicrobial-coated Medical Devices market revenue in 2025, making it the largest coating material segment. This growth has been driven by the superior antimicrobial properties of metallic coatings such as silver, copper, and zinc, which are capable of inhibiting a wide range of microbial strains. Metallic coatings have been increasingly applied to orthopedic implants, surgical instruments, and dental devices, where long-term implantation and exposure to body fluids create higher risks of infection.
The adoption of metallic coatings has been supported by advancements in coating techniques that ensure uniform application and controlled release of antimicrobial agents. The growing focus on reducing postoperative infections and improving device longevity has encouraged healthcare providers to opt for metallic-coated solutions.
Furthermore, the ability to combine metallic coatings with other surface modifications has enhanced device performance and biocompatibility As healthcare systems emphasize reducing infection-related complications, the Metallic Antimicrobial-coated Medical Devices segment is expected to maintain its dominance, benefiting from technological innovations and heightened safety protocols across clinical settings.
Technological advancement in the healthcare sector and the increasing burden of cardiovascular diseases are expected to accrue significant benefits to the global antimicrobial-coated medical devices market. Also, technological advancements in antimicrobial coatings and the growing implantable devices market are expected to propel the growth of the antimicrobial-coated medical devices market in forecasting years.
The increasing research and development activities and innovations in the antimicrobial coating process are also expected to bolster the growth of the global antimicrobial-coated medical devices market. The advanced medical infrastructure and facilities are also expected to propel the demand for antimicrobial-coated medical devices, driving the global market over a forecast period.
Although the antimicrobial-coated medical devices market has numerous uses, numerous obstacles likely pose a challenge to market growth. High costs associated with a coating process and other components may hamper the growth of the global antimicrobial-coated medical devices market.
In addition, the stringent rules and regulations and unfavorable reforms for the material and process used for antimicrobial coating for medical devices may hinder the growth of the antimicrobial-coated medical devices market in the forecasting period. The limitations related to metallic coatings, such as silver coating and copper coating, due to antimicrobial resistance, may restrain the growth of the global antimicrobial-coated medical devices market over the forecast period.
These catheters are specially designed with coatings that help inhibit the growth of bacteria and reduce the risk of catheter-associated infections.
Antimicrobial-coated catheters have become increasingly important due to the high prevalence of catheter-related infections and associated healthcare complications. Antimicrobial coatings on catheters act as a protective barrier, preventing the colonization of microorganisms on the catheter surface and reducing the likelihood of infection transmission.
The antimicrobial-coated catheters market encompasses a wide range of catheter types, including urinary catheters, central venous catheters, peripheral intravenous catheters, and arterial catheters. These catheters are used in various healthcare settings, such as hospitals, clinics, and home care, to provide essential medical interventions.
These devices are equipped with metallic coatings, such as silver, copper, or zinc, which possess inherent antimicrobial properties. The use of metallic coatings on catheters has gained traction due to their effectiveness in inhibiting the growth of bacteria and reducing the risk of infections. Metallic antimicrobial-coated catheters find extensive application in various medical settings, including urinary catheters and central venous catheters.
The durable antimicrobial activity of these coatings provides prolonged protection against microbial colonization, making them a preferred choice for healthcare providers aiming to enhance patient safety and minimize catheter-associated infections. As the awareness of infection control continues to increase, the demand for metallic antimicrobial-coated catheters is expected to grow, contributing to the overall expansion of the antimicrobial-coated catheters market.
North America is the leading market for the angiographic-catheters market. It is expected to continue into the forecast period owing to the increasing preference for advanced antimicrobial-coated medical devices over conventional procedures for patient safety purposes.
Rising awareness about antimicrobial-coated medical devices and increasing government investment in medical technologies are the other factors fueling the growth of this market in the region.
The region is forecast to have a 36.2% market share of the antimicrobial-coated medical devices market. North America is expected to be the next dominant region witnessing high adoption rates for the antimicrobial-coated medical devices market during the forecast period.
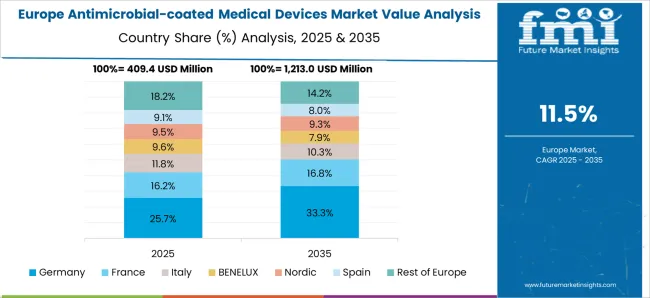
According to Future Market Insights, Europe is expected to provide immense growth opportunities for the antimicrobial-coated medical devices market due to the expansion of the healthcare sector in the region. The antimicrobial-coated medical devices market is expected to witness sustained growth over the forecast period.
The growth of the antimicrobial-coated medical devices market is driven by the increasing demand for antimicrobial-coated medical devices in the region. Europe accounts for a total of 27.8% share in the antimicrobial-coated medical devices market.
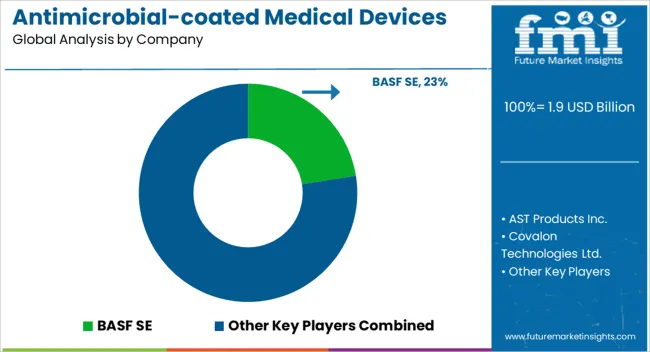
The market is highly competitive due to the presence of several leading participants. While global players such as AST Products, Inc., Covalon Technologies Ltd., and BASF SE account for a considerable market size, several regional-level players are also operating across key growth regions.
Recent Developments :
Innovative antimicrobial coating technology was on display, including BioCote Limited's most recent advancements for plastic antimicrobial coating solutions. This increased the business's yearly revenue.
The company Hydromer has announced that Avinger, Inc. has chosen them as a significant partner for coating and services. This action aids the business in accelerating its market expansion.
| Attribute | Details |
|---|---|
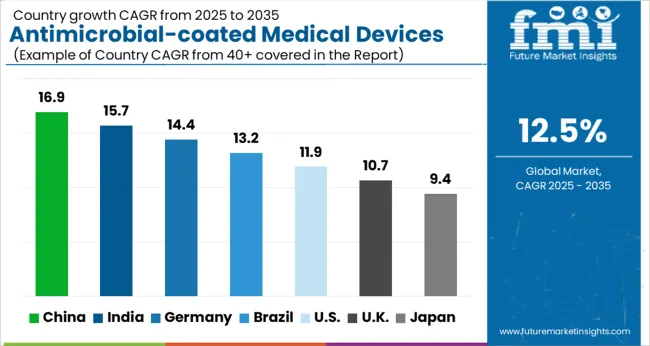
| Growth Rate | CAGR of 13.2% from 2025 to 2035 |
| Base Year of Estimation | 2025 |
| Historical Data | 2020 to 2025 |
| Forecast Period | 2025 to 2035 |
| Quantitative Units | Revenue in USD million and Volume in Units and F-CAGR from 2025 to 2035 |
| Report Coverage | Revenue Forecast, Volume Forecast, Company Ranking, Competitive Landscape, growth factors, Trends, and Pricing Analysis |
| Key Segments Covered | Device Type, Coating Material, By Region |
| Regions Covered | North America; Latin America; Europe; East Asia; South Asia; The Middle East & Africa; Oceania |
| Key Countries Profiled | The United States, Canada, Brazil, Mexico, Germany, Italy, France, The United Kingdom, Spain, Russia, China, Japan, India, GCC Countries, Australia |
| Key Companies Profiled | AST Products Inc.; Covalon Technologies Ltd.; BASF SE; Bio Interaction Ltd.; Royal DSM; Sciessent LLC; Specialty Coating Systems Inc.; Hydromer Inc.; Dow Chemical Company; Biocote; PPG Industries, Inc. |
| Customization & Pricing | Available upon Request |
The global antimicrobial-coated medical devices market is estimated to be valued at USD 1.9 billion in 2025.
The market size for the antimicrobial-coated medical devices market is projected to reach USD 6.2 billion by 2035.
The antimicrobial-coated medical devices market is expected to grow at a 12.5% CAGR between 2025 and 2035.
The key product types in antimicrobial-coated medical devices market are antimicrobial coated catheters, antimicrobial coated surgical instruments, antimicrobial coated implantable devices and other antimicrobial coated devices.
In terms of coating material, metallic antimicrobial-coated medical devices segment to command 45.0% share in the antimicrobial-coated medical devices market in 2025.


Our Research Products

The "Full Research Suite" delivers actionable market intel, deep dives on markets or technologies, so clients act faster, cut risk, and unlock growth.

The Leaderboard benchmarks and ranks top vendors, classifying them as Established Leaders, Leading Challengers, or Disruptors & Challengers.

Locates where complements amplify value and substitutes erode it, forecasting net impact by horizon

We deliver granular, decision-grade intel: market sizing, 5-year forecasts, pricing, adoption, usage, revenue, and operational KPIs—plus competitor tracking, regulation, and value chains—across 60 countries broadly.

Spot the shifts before they hit your P&L. We track inflection points, adoption curves, pricing moves, and ecosystem plays to show where demand is heading, why it is changing, and what to do next across high-growth markets and disruptive tech

Real-time reads of user behavior. We track shifting priorities, perceptions of today’s and next-gen services, and provider experience, then pace how fast tech moves from trial to adoption, blending buyer, consumer, and channel inputs with social signals (#WhySwitch, #UX).

Partner with our analyst team to build a custom report designed around your business priorities. From analysing market trends to assessing competitors or crafting bespoke datasets, we tailor insights to your needs.
Supplier Intelligence
Discovery & Profiling
Capacity & Footprint
Performance & Risk
Compliance & Governance
Commercial Readiness
Who Supplies Whom
Scorecards & Shortlists
Playbooks & Docs
Category Intelligence
Definition & Scope
Demand & Use Cases
Cost Drivers
Market Structure
Supply Chain Map
Trade & Policy
Operating Norms
Deliverables
Buyer Intelligence
Account Basics
Spend & Scope
Procurement Model
Vendor Requirements
Terms & Policies
Entry Strategy
Pain Points & Triggers
Outputs
Pricing Analysis
Benchmarks
Trends
Should-Cost
Indexation
Landed Cost
Commercial Terms
Deliverables
Brand Analysis
Positioning & Value Prop
Share & Presence
Customer Evidence
Go-to-Market
Digital & Reputation
Compliance & Trust
KPIs & Gaps
Outputs
Full Research Suite comprises of:
Market outlook & trends analysis
Interviews & case studies
Strategic recommendations
Vendor profiles & capabilities analysis
5-year forecasts
8 regions and 60+ country-level data splits
Market segment data splits
12 months of continuous data updates
DELIVERED AS:
PDF EXCEL ONLINE
Medical Devices Market Size and Share Forecast Outlook 2025 to 2035
Medical Devices Secondary Packaging Market Analysis by Material and Application Through 2035
Medical Cleaning Devices Market Overview - Trends & Forecast 2025 to 2035
Portable Medical Devices Market Analysis - Growth & Forecast 2025 to 2035
Homecare Medical Devices Market Outlook – Industry Growth & Forecast 2025 to 2035
AI-enabled Medical Devices Market Size and Share Forecast Outlook 2025 to 2035
3D Printed Medical Devices Market is segmented by drug type, treatment and distribution channel from 2025 to 2035
Reprocessed Medical Devices Market Size and Share Forecast Outlook 2025 to 2035
Demand for Homecare Medical Devices in Japan Size and Share Forecast Outlook 2025 to 2035
Demand for Homecare Medical Devices in USA Size and Share Forecast Outlook 2025 to 2035
Asia Pacific Reprocessed Medical Devices Market Growth – Trends & Forecast 2025 to 2035
Medical Silicone Radiopaque Vascular Ties Market Size and Share Forecast Outlook 2025 to 2035
Medical Indoor Air Purifier Market Size and Share Forecast Outlook 2025 to 2035
Medical Eye Shield Film Market Size and Share Forecast Outlook 2025 to 2035
Medical Far Infrared Therapy Device Market Size and Share Forecast Outlook 2025 to 2035
Medical Latex Protective Suit Market Size and Share Forecast Outlook 2025 to 2035
Medical Activated Carbon Dressing Market Size and Share Forecast Outlook 2025 to 2035
Medical Coated Roll Stock Market Size and Share Forecast Outlook 2025 to 2035
Medical Billing Outsourcing Market Size and Share Forecast Outlook 2025 to 2035
Medical Pressure Mapping System Market Size and Share Forecast Outlook 2025 to 2035

Thank you!
You will receive an email from our Business Development Manager. Please be sure to check your SPAM/JUNK folder too.
Chat With
MaRIA