The Antimicrobial Susceptibility Tester Market is estimated to be valued at USD 4.4 billion in 2025 and is projected to reach USD 7.5 billion by 2035, registering a compound annual growth rate (CAGR) of 5.6% over the forecast period.
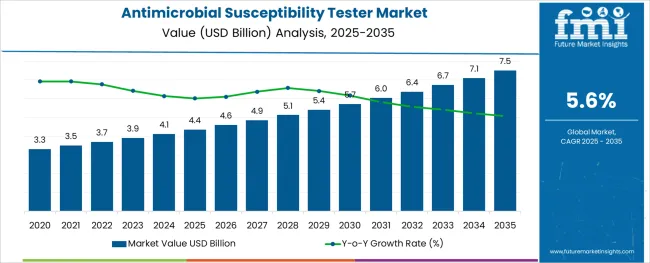
The antimicrobial susceptibility tester market is expanding rapidly, driven by the increasing need for effective diagnosis of infectious diseases and growing antibiotic resistance worldwide. Healthcare facilities and diagnostic laboratories are emphasizing timely and accurate detection of microbial resistance patterns to guide appropriate treatment decisions. Advances in testing technologies have enhanced the precision and speed of susceptibility assays, improving patient outcomes and infection control.
Rising prevalence of hospital-acquired infections and stringent regulatory guidelines promoting antimicrobial stewardship are further fueling market growth. Investment in healthcare infrastructure and the adoption of automated systems in clinical labs have contributed to higher demand for reliable testing equipment.
As infectious diseases continue to pose significant public health challenges, the market outlook remains positive with ongoing innovation and increased testing volumes. Growth is expected to be driven by the clinical diagnosis application and automatic antimicrobial susceptibility testers as the leading equipment type.
The market is segmented by Application and Equipment Type and region. By Application, the market is divided into Clinical Diagnosis, Drug Discovery, and Others. In terms of Equipment Type, the market is classified into Automatic Antimicrobial Susceptibility Testers, Manual Antimicrobial Susceptibility Testers, Custom Antimicrobial Susceptibility Testers, MIC Strips, Susceptibility Plates, and Other Accessories. Regionally, the market is classified into North America, Latin America, Western Europe, Eastern Europe, Balkan & Baltic Countries, Russia & Belarus, Central Asia, East Asia, South Asia & Pacific, and the Middle East & Africa.
The market is segmented by Application and Equipment Type and region. By Application, the market is divided into Clinical Diagnosis, Drug Discovery, and Others. In terms of Equipment Type, the market is classified into Automatic Antimicrobial Susceptibility Testers, Manual Antimicrobial Susceptibility Testers, Custom Antimicrobial Susceptibility Testers, MIC Strips, Susceptibility Plates, and Other Accessories. Regionally, the market is classified into North America, Latin America, Western Europe, Eastern Europe, Balkan & Baltic Countries, Russia & Belarus, Central Asia, East Asia, South Asia & Pacific, and the Middle East & Africa.
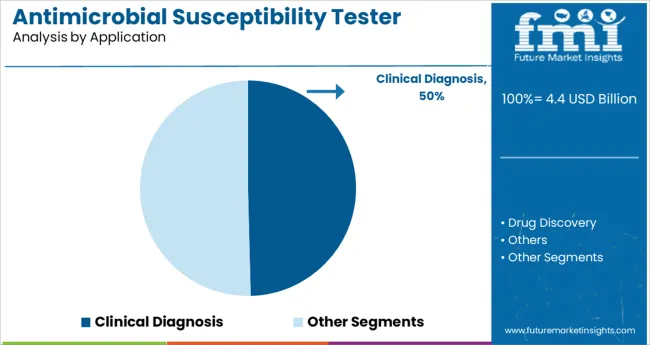
The clinical diagnosis segment is projected to hold 49.6% of the antimicrobial susceptibility tester market revenue in 2025, maintaining its dominant position. This segment’s growth has been fueled by the critical role susceptibility testing plays in guiding effective antimicrobial therapy. Hospitals and diagnostic centers rely on these tests to determine the resistance profile of pathogens causing infections, ensuring targeted treatment and reducing the spread of resistant strains.
Increasing incidence of multidrug-resistant infections has underscored the importance of timely and accurate clinical diagnosis. Additionally, the growing focus on antimicrobial stewardship programs worldwide has increased the routine use of susceptibility testing in clinical settings.
This has led to wider adoption of advanced testing methods that offer rapid and precise results. The clinical diagnosis segment is expected to sustain its growth as infection management remains a top healthcare priority.
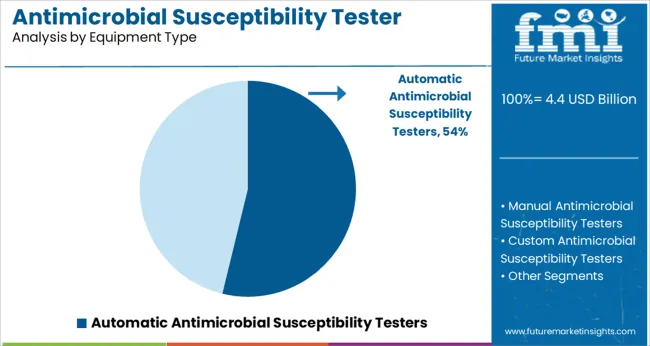
The automatic antimicrobial susceptibility testers segment is expected to contribute 53.8% of the market revenue in 2025, establishing itself as the preferred equipment type. Growth in this segment has been driven by the advantages of automation including improved throughput, reduced human error, and standardized testing procedures.
Laboratories have increasingly adopted automatic testers to manage high testing volumes efficiently while maintaining accuracy and reproducibility. Automated systems also facilitate integration with laboratory information management systems, enabling better data handling and reporting.
Continuous advancements in automation technology have improved the speed and scope of antimicrobial testing, allowing rapid detection of resistance even in complex microbial populations. The segment’s ability to deliver consistent results with minimal manual intervention is expected to keep it at the forefront of the antimicrobial susceptibility tester market.
The increasing frequency of outbreaks caused by infectious organisms such as Haemophilus influenzae, Streptococcus pneumoniae, Shigella, Vibrio cholera, Neisseria meningitides, Neisseria gonorrhoeae, and Salmonella serotype Typhi is driving up demand for antimicrobial susceptibility testing kits.
According to the World Health Organization, tuberculosis is one of the top ten causes of death and the main cause of a single infectious agent. In 2020, it was predicted that 3.3 million individuals worldwide were infected with tuberculosis, with 1.5 million dying as a result of the disease. According to the Joint United Nations Programme on HIV/AIDS (UNAIDS), 1.7 million people were newly infected with HIV in 2020, 38 million people are HIV-positive, and 690 thousand people died from AIDS-related illnesses in 2020. The World Malaria Report 2020 estimates that 228 million cases of malaria were diagnosed worldwide. According to the report, nineteen nations in Sub-Saharan Africa and India carried about 85 percent of the worldwide malaria load. All of these increasing instances will boost market demand.
Furthermore, the increased focus on drug discovery, the emergence of new diseases, the increasing incidences of chronic disorders, and the emergence of antimicrobial resistance (AMR) have increased biopharmaceutical, biotechnological, and pharmaceutical companies' use of antimicrobial susceptibility testing. During the projected period, this tendency is expected to boost the growth of the antimicrobial susceptibility testing market.
Automated antimicrobial susceptibility testing tools are expensive and have very advanced features and functionality. This affects the entire cost of therapy and makes it difficult for the patient party to pay the expenses.
At the same time, this approach is out of reach for modest healthcare institutions due to the large cash required to run this automated process. The adoption of automated antimicrobial susceptibility testing systems minimizes the time required for incubation and detection. However, the high cost of these systems is a key barrier to widespread adoption by end users, particularly small-budget institutions.
The time lag between establishing clinical thresholds, approval of new antimicrobial drugs, and inclusion of these medicines in antimicrobial susceptibility testing is one of the primary issues confronting the AST market. When medication manufacturers submit individual new drug applications or device manufacturers submit requests to change the breakpoints, the FDA establishes these breakpoints. Furthermore, the lack of clinical breakpoints for many medicines is limiting the use of AST products.
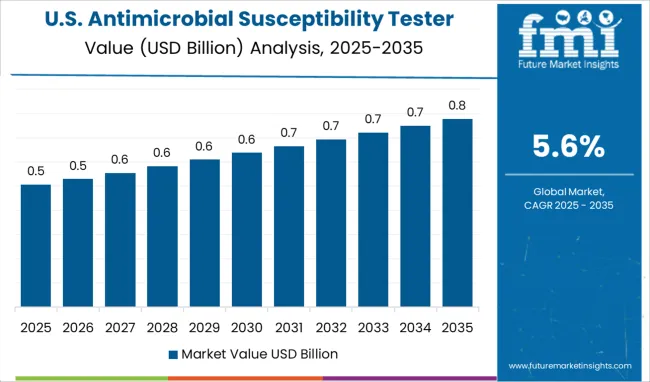
In 2024, North America held the greatest share of the AST market. The rising frequency of infectious diseases, safety concerns, and technological improvements in antimicrobial susceptibility products are the primary factors driving market growth in North America.
Furthermore, most of the world's leading firms, such as Becton, Dickinson and Company, Danaher Corporation, Thermo Fisher Scientific, and Bruker Corporation, are located or have a substantial presence in the region. Others have concentrated on growth in order to broaden their reach and skills. This is another important component contributing to the market's rapid rise.
The rapid availability of information on bacterial infections and their antibiotic susceptibility aids in the timely adoption of suitable treatment therapy, which plays a significant role in illness management. These factors have been a major driver of demand in the North American market.
According to the analysis, the major factors driving the APAC antimicrobial susceptibility testing market are an increase in the incidence of infectious diseases combined with epidemic and pandemic occurrences, an increase in the adoption of antimicrobial susceptibility testing, and the innovation of manual and automated products.
There are significant potential prospects for the antimicrobial susceptibility testing market in growing APAC countries due to improved healthcare infrastructure, an increase in neglected healthcare demands, and an increase in the prevalence of antibiotic resistance in populations. Furthermore, the availability of numerous manual and automated solutions that deliver results in less time with improved accuracy for testing is a growing potential for leading industry players in this area to engage in the antimicrobial susceptibility testing market, which would accelerate growth.
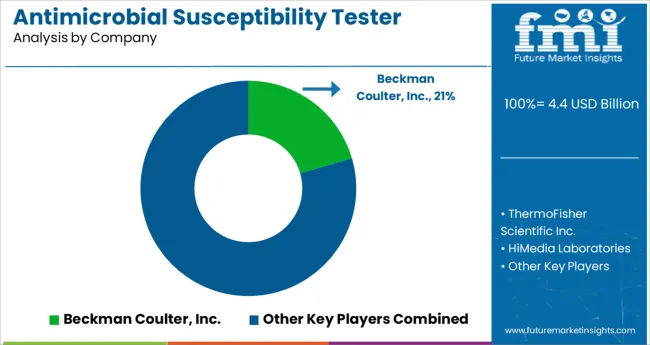
Beckman Coulter, Inc., ThermoFisher Scientific Inc., HiMedia Laboratories, Becton, Dickinson and Company, Creative Diagnostics, MERLIN, Alifax, Bioanalyse, bioMerieux are among the top players of antimicrobial susceptibility testers market.
| Report Attribute | Details |
|---|---|
| Growth Rate | 5.6% CAGR from 2025 to 2035 |
| Market Value in 2025 | USD 3.70 Billion |
| Market Value in 2035 | USD 6.37 Billion |
| Base Year for Estimation | 2024 |
| Historical Data | 2020 to 2024 |
| Forecast Period | 2025 to 2035 |
| Quantitative Units | million for Value |
| Report Coverage | Revenue Forecast, Volume Forecast, Company Ranking, Competitive Landscape, Growth Factors, Trends, and Pricing Analysis |
| Segments Covered | Equipment Type, Application, Region |
| Regions Covered | North America; Latin America; Europe; Asia Pacific; CIS & Russia; Middle East & Africa |
| Key Countries Profiled | USA, Canada, Mexico, Brazil, Argentina, Peru, Chile, Rest of LATAM, Germany, Italy, UK, Spain, France, Nordic countries, BENELUX, Eastern Europe, Rest of Europe, Greater China, India, South Korea, ASEAN Countries, Rest of APEJ, GCC Countries, Turkey, Iran, Israel, S.Africa, Rest of MEA |
| Key Companies Profiled | Beckman Coulter, Inc.; ThermoFisher Scientific Inc.; HiMedia Laboratories; Becton; Dickinson and Company; Creative Diagnostics; MERLIN; Alifax; Bioanalyse; BioMerieux |
| Customization Scope | Available upon Request |
The global antimicrobial susceptibility tester market is estimated to be valued at USD 4.4 billion in 2025.
It is projected to reach USD 7.5 billion by 2035.
The market is expected to grow at a 5.6% CAGR between 2025 and 2035.
The key product types are clinical diagnosis, drug discovery and others.
automatic antimicrobial susceptibility testers segment is expected to dominate with a 53.8% industry share in 2025.


Our Research Products

The "Full Research Suite" delivers actionable market intel, deep dives on markets or technologies, so clients act faster, cut risk, and unlock growth.

The Leaderboard benchmarks and ranks top vendors, classifying them as Established Leaders, Leading Challengers, or Disruptors & Challengers.

Locates where complements amplify value and substitutes erode it, forecasting net impact by horizon

We deliver granular, decision-grade intel: market sizing, 5-year forecasts, pricing, adoption, usage, revenue, and operational KPIs—plus competitor tracking, regulation, and value chains—across 60 countries broadly.

Spot the shifts before they hit your P&L. We track inflection points, adoption curves, pricing moves, and ecosystem plays to show where demand is heading, why it is changing, and what to do next across high-growth markets and disruptive tech

Real-time reads of user behavior. We track shifting priorities, perceptions of today’s and next-gen services, and provider experience, then pace how fast tech moves from trial to adoption, blending buyer, consumer, and channel inputs with social signals (#WhySwitch, #UX).

Partner with our analyst team to build a custom report designed around your business priorities. From analysing market trends to assessing competitors or crafting bespoke datasets, we tailor insights to your needs.
Supplier Intelligence
Discovery & Profiling
Capacity & Footprint
Performance & Risk
Compliance & Governance
Commercial Readiness
Who Supplies Whom
Scorecards & Shortlists
Playbooks & Docs
Category Intelligence
Definition & Scope
Demand & Use Cases
Cost Drivers
Market Structure
Supply Chain Map
Trade & Policy
Operating Norms
Deliverables
Buyer Intelligence
Account Basics
Spend & Scope
Procurement Model
Vendor Requirements
Terms & Policies
Entry Strategy
Pain Points & Triggers
Outputs
Pricing Analysis
Benchmarks
Trends
Should-Cost
Indexation
Landed Cost
Commercial Terms
Deliverables
Brand Analysis
Positioning & Value Prop
Share & Presence
Customer Evidence
Go-to-Market
Digital & Reputation
Compliance & Trust
KPIs & Gaps
Outputs
Full Research Suite comprises of:
Market outlook & trends analysis
Interviews & case studies
Strategic recommendations
Vendor profiles & capabilities analysis
5-year forecasts
8 regions and 60+ country-level data splits
Market segment data splits
12 months of continuous data updates
DELIVERED AS:
PDF EXCEL ONLINE
Antimicrobial HVAC Coating Market Size and Share Forecast Outlook 2025 to 2035
Antimicrobial Hospital Textile Market Forecast Outlook 2025 to 2035
Antimicrobial Glass Powder Market Forecast and Outlook 2025 to 2035
Antimicrobial Cap Fitters Market Size and Share Forecast Outlook 2025 to 2035
Antimicrobial Powder Coating Market Size and Share Forecast Outlook 2025 to 2035
Antimicrobial Skincare Market Analysis - Size and Share Forecast Outlook 2025 to 2035
Antimicrobial Feed Additives Market Analysis - Size and Share Forecast Outlook 2025 to 2035
Antimicrobials Cosmetic Preserving market Size and Share Forecast Outlook 2025 to 2035
Antimicrobial Packaging Ingredients for Food Packaging Market Size and Share Forecast Outlook 2025 to 2035
Antimicrobial-coated Medical Devices Market Size and Share Forecast Outlook 2025 to 2035
Antimicrobial Wound Care Dressings Market Analysis - Size, Share, and Forecast Outlook 2025 to 2035
Antimicrobial Additives Market Analysis - Size, Share, and Forecast Outlook 2025 to 2035
Antimicrobial Car Care Products Market Size and Share Forecast Outlook 2025 to 2035
Antimicrobial Wipes Market - by Product Type, Material Type, Sales Channel, End-User, and Region - Trends, Growth & Forecast 2025 to 2035
Antimicrobial Nanocoatings Market Growth - Trends & Forecast 2025 to 2035
Competitive Overview of Antimicrobial Packaging Ingredients for Food Packaging
Antimicrobial Regenerative Wound Matrix Market - Growth & Forecast 2025 to 2035
Antimicrobial Coil Coating Market Growth - Trends & Forecast 2025 to 2035
Antimicrobial Polymer Films Market Insights – Growth & Forecast 2024-2034
Antimicrobial Packaging Market

Thank you!
You will receive an email from our Business Development Manager. Please be sure to check your SPAM/JUNK folder too.
Chat With
MaRIA