The antimicrobial glass powder market is expanding steadily. Rising concerns over microbial contamination and the need for durable antimicrobial materials are driving adoption across multiple industries. Current market dynamics reflect increasing integration of antimicrobial agents in coatings, packaging, and healthcare surfaces to ensure hygiene and safety.
Advancements in nanotechnology and material science are improving the functional efficiency, dispersion stability, and long-term antimicrobial performance of glass powders. Regulatory emphasis on infection control and product safety is supporting market standardization and encouraging innovation in formulation. The future outlook remains positive, driven by expanding use in paints, polymers, and construction materials where extended antimicrobial protection is required.
Growth rationale is founded on the rising demand for sustainable, non-toxic antimicrobial additives, ongoing industrial modernization, and the scalability of metal oxide-based solutions that enhance product lifespan and surface protection Collectively, these factors are positioning the market for consistent revenue growth and broader global penetration.
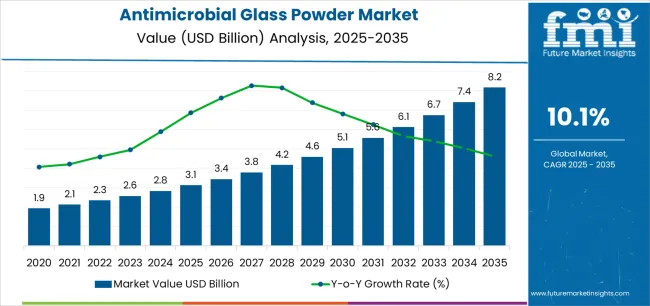
| Metric | Value |
|---|---|
| Antimicrobial Glass Powder Market Estimated Value in (2025 E) | USD 3.1 billion |
| Antimicrobial Glass Powder Market Forecast Value in (2035 F) | USD 8.2 billion |
| Forecast CAGR (2025 to 2035) | 10.1% |
The market is segmented by Type, Size, and Application and region. By Type, the market is divided into Metal Oxide-Based, Photocatalytic, and Bioactive-Based. In terms of Size, the market is classified into Nano-Sized and Micro-Sized. Based on Application, the market is segmented into Paints And Coating, Fiber, Plastics, Personal Care & Cosmetics, Commercial and Household Products, and Others. Regionally, the market is classified into North America, Latin America, Western Europe, Eastern Europe, Balkan & Baltic Countries, Russia & Belarus, Central Asia, East Asia, South Asia & Pacific, and the Middle East & Africa.
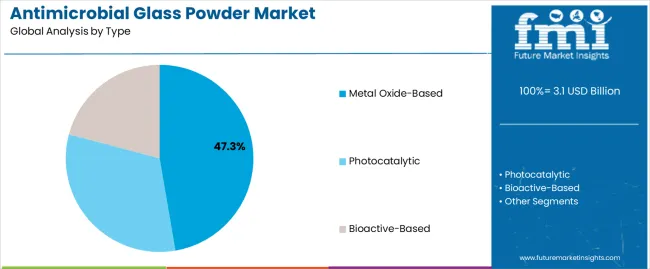
The metal oxide-based segment, holding 47.30% of the type category, is dominating due to its superior antimicrobial efficacy, chemical stability, and broad compatibility with various substrate materials. Demand has been supported by its effectiveness against a wide spectrum of microorganisms and its long-term resistance to degradation under thermal and chemical stress.
Its preference among manufacturers stems from high performance in industrial and consumer applications such as coatings, polymers, and glass composites. Ongoing innovations in metal oxide composition and particle engineering have enhanced functional performance, enabling tailored antimicrobial activity while maintaining transparency and durability.
Regulatory compliance and scalability of production have reinforced segment stability The growing emphasis on eco-friendly formulations and the reduced use of organic biocides are expected to sustain demand for metal oxide-based antimicrobial glass powders across diverse end-use sectors.
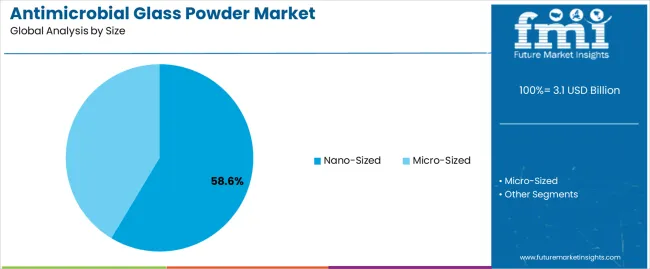
The nano-sized segment, accounting for 58.60% of the size category, has emerged as the leading segment due to its exceptional surface area-to-volume ratio and enhanced antimicrobial efficiency. Nano-scale particles provide improved dispersion within coatings and composite matrices, leading to more uniform antimicrobial coverage and higher functional longevity.
Adoption has been supported by advances in nanofabrication and controlled synthesis processes, which have optimized performance without compromising safety or product stability. Demand from healthcare, packaging, and consumer goods industries has further accelerated due to the effectiveness of nano-sized materials in preventing microbial colonization on contact surfaces.
Ongoing regulatory validation and improved safety assessments are supporting market credibility Continued research in nanostructure tuning and hybrid material development is expected to strengthen this segment’s leadership over the forecast period.
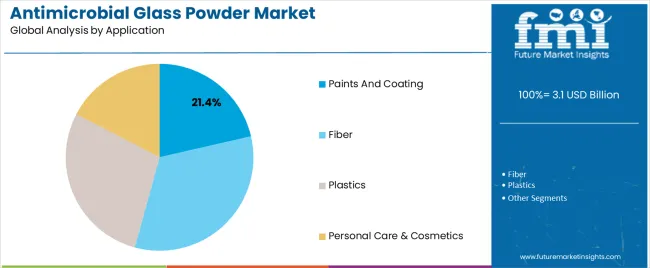
The paints and coating segment, representing 21.40% of the application category, is leading owing to widespread use of antimicrobial glass powders in protective and decorative surface finishes. Integration within architectural, industrial, and automotive coatings has been increasing as manufacturers prioritize hygiene, durability, and aesthetics.
The segment’s prominence is driven by growing adoption in healthcare facilities, food processing units, and public infrastructure where microbial control is a key performance requirement. Antimicrobial glass powder enhances coating longevity by reducing microbial degradation and surface staining.
Compatibility with waterborne and solvent-based systems has enabled flexible formulation across diverse environments Rising awareness about antimicrobial protection in construction and interior applications, combined with supportive regulations for hygienic materials, is expected to sustain demand and reinforce the segment’s contribution to overall market growth.
Antimicrobial Glass Powder Market to Expand Nearly 2.7X through 2035
The antimicrobial glass powder industry is set to expand around 2.7X through 2035, accompanied by a 7.5% increase in the expected CAGR compared to the historical one. This is due to the growing demand for glass powders from healthcare, food packing, and public settings to reduce the transmission of illnesses.
Antimicrobial glass powders are becoming ideal alternatives to organic antimicrobials due to their safe and more durable nature. They help increase product durability, infection control, and overall public health. These benefits are expected to boost sales of antimicrobial glass powders during the forecast period.
As per the latest analysis, East Asia is expected to hold around 28.9% of the global antimicrobial glass powder market share in 2035. This is attributed to the following factors:
Rising Emphasis on Improving Hygiene Standards: In East Asia, the increasing adoption of cleanliness is why the demand for antimicrobial glass powder is rising. Antimicrobial glass powder, with its inherent antibacterial qualities, satisfies the growing demand for greater hygiene. Antimicrobial solutions are required by industries such as healthcare, food packaging, and public areas to reduce the transmission of illnesses while improving overall cleanliness practices. As people become more aware of the necessity of maintaining sterile workplaces, demand for antimicrobial glass powders is set to grow rapidly.
Rapid Infrastructural Development: East Asian regions like China and Japan are witnessing increasing investments in infrastructure development projects. This, in turn, is positively impacting the demand for antimicrobial glass powders. Antimicrobial glass powder, which has the inherent ability to suppress microbiological growth, has become an essential component in construction materials. From healthcare facilities to public areas and transportation hubs, the use of antimicrobial glass powder is consistent with a larger commitment to providing safer, cleaner environments. This increase in demand demonstrates its critical role in influencing the future of infrastructure development, with a focus on hygiene and safety.
Increasing Research and Development: Top players have adopted emerging business models to expand their regional footprint and market share. As governments across East Asia invest heavily in updating their infrastructure, the importance of adopting antimicrobial solutions becomes more widely recognized. The companies are building long-term capabilities and increasing investments in research and development. They are striving to develop innovative, high-performance, and cost-effective products to meet growing demand in East Asia and other regions.
As per the report, the nano-sized segment is expected to dominate the antimicrobial glass powder market, holding a volume share of about 67.9% in 2025. This is due to their superior ability to suppress microbial development.
Small particle sizes provide more surface area, resulting in stronger antibacterial effects. This increased efficacy makes nano-sized antibacterial glass powder a popular choice in a variety of sectors for enhanced hygiene and safety applications.
Antimicrobial glass powder sales grew at a CAGR of 3.1% between 2020 and 2025. Total market revenue reached about USD 2,590.8 million in 2025. Over the next ten years, the antimicrobial glass powder industry is set to thrive at a CAGR of 10.6%.
| Historical CAGR (2020 to 2025) | 3.1% |
|---|---|
| Forecast CAGR (2025 to 2035) | 10.6% |
The antimicrobial glass powder market witnessed steady growth between 2020 and 2025. However, the COVID-19 pandemic adversely affected several markets, including antimicrobial glass powder, in terms of supply and demand.
Increased usage of antimicrobial materials in the healthcare industry mostly provided impetus for market growth. Health concerns triggered by the pandemic prompted healthcare professionals to use materials like antimicrobial glass powders to reduce the risk of infections.
The antimicrobial glass powder industry has a potential future, owing to a growing global awareness of cleanliness standards. As people become more aware of their health and hygiene, materials like antimicrobial glass powders will likely witness high demand.
Nanoparticle innovations are likely to improve the antibacterial characteristics of glass powder, increasing its effectiveness. As the demand for cleaner and safer surroundings grows, the market is positioned to play an important role in shaping the future of hygiene solutions.
Collaborations between businesses and research institutions to develop breakthrough formulations and applications are expected to propel technological improvement. The antimicrobial glass powder market's future lies in its adaptability, as it addresses a wide range of hygiene concerns.
Growing Healthcare Expenditure and Increasing Government Initiatives
Increasing healthcare costs and government policies promoting nutritional supplements are key factors driving the antibacterial glass powder market growth. As healthcare budgets expand, more emphasis is placed on preventive measures against infectious diseases, and new solutions, such as glass disinfectants, are sought.
Antimicrobial glass powders, which prevent the growth of bacteria and viruses on surfaces, meet the broader objective of promoting health and preventing the spread of diseases. The antimicrobial properties of this glass paste are important for maintaining hygienic conditions not only in healthcare facilities but also in public places.
Demand for Sustainable Solutions and Environmental Concerns Fueling Sales
In response to the increasing emphasis on sustainability, a surprising trend has emerged in the development of glass antimicrobial powders. Manufacturers are actively pursuing eco-friendly and non-toxic qualities in these powders to align with the global push for environmentally friendly solutions. This indicates a greater commitment to reducing the environmental impacts associated with antimicrobial technologies.
The industry is seeing a shift toward green alternatives that not only maintain high levels of antimicrobial activity but also consume them with environmental considerations. This includes finding sustainable raw materials, environmentally friendly manufacturing processes, and addressing concerns related to glass disposal.
Expansion of Healthcare Industry, Particularly in Emerging Economies
The expansion of healthcare sector, especially in emerging economies, plays a pivotal role in propelling the growth of the antimicrobial glass powder market. Antimicrobial glass powders play a crucial function in infection prevention.
Antimicrobial glass powders are in high demand in healthcare settings, with an increased risk of nosocomial infections. By integrating antimicrobial residences into glass powders, surfaces end up in inhospitable environments for microbial proliferation, thereby decreasing the probability of healthcare-related infections.
Nosocomial infections pose critical threats to affected persons' safety and might lead to extended medical institution stays, accelerated healthcare fees, or even mortality in excessive cases. The ability of antimicrobial glass powders to fight pathogens on surfaces gives an additional layer of defense against move-infection and transmission inside healthcare facilities.
Antimicrobial glass powders are integral in the ongoing battle against healthcare-related infections. Hence, their demand is expected to rise rapidly during the assessment period.
Rising Demand for Medical Device Coatings to Foster Sales
Antimicrobial properties of glass powders are making them ideal for pharmaceutical coatings as they address the growing need for improved infection control in healthcare facilities. These powders are widely used in several medical devices to reduce the risk of infection acquisition.
Increasing awareness of infectious risks and growing emphasis on improving patient safety are fueling the demand for medical device coatings with antimicrobial powders. This, in turn, will provide impetus for the growth of antimicrobial glass powder industry.
Regulatory Concerns
Regulatory problems significantly impact the antimicrobial glass powder market, affecting production, marketing, and acceptance. As governments tighten health and environmental protection regulations, disinfecting glass companies face stringent requirements to comply with.
Companies must invest in research and development to meet regulatory expectations. They need to ensure that their products meet established safety and efficacy standards.
Lack of Awareness
The antimicrobial glass powder industry is heavily impacted by a lack of understanding among potential users and stakeholders. Despite the demonstrated effectiveness of these powders in suppressing microbial growth on surfaces, a lack of understanding prevents widespread adoption.
Many sectors and consumers may not completely understand the advantages, applications, and long-term benefits of antimicrobial glass powders. This results in delayed market penetration. Educational initiatives about the functionality and adaptability of antimicrobial glass powders are critical for overcoming this barrier.
The table below highlights key countries’ antimicrobial glass powder market revenues. China, the United States, and Canada are expected to remain the top three consumers of antimicrobial glass powders, with expected valuations of USD 1,512.6 million, USD 988.5 million, and USD 682.3 million, respectively, in 2035.
| Countries | Antimicrobial Glass Powder Market Revenue (2035) |
|---|---|
| China | USD 1,512.6 million |
| United States | USD 988.5 million |
| Canada | USD 682.3 million |
| Japan | USD 413.1 million |
| ASEAN | USD 369.9 million |
The table below shows the estimated growth rates of the top three countries. Germany, the United Kingdom, and Italy are set to record higher CAGRs of 22.5%, 17.8%, and 15.2%, respectively, through 2035.
| Countries | Projected Antimicrobial Glass Powder CAGR (2025 to 2035) |
|---|---|
| Germany | 22.5% |
| United Kingdom | 17.8% |
| Italy | 15.2% |
| Spain | 14.9% |
| Australia and New Zealand | 14.3% |
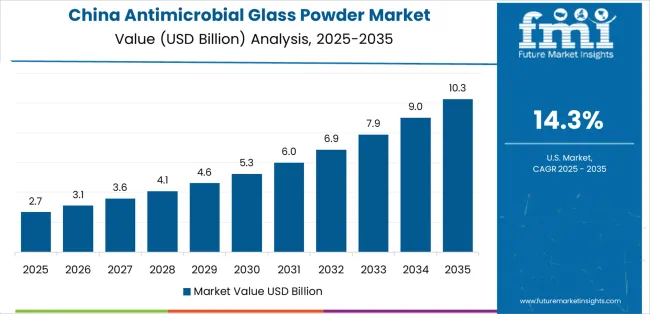
China's antimicrobial glass powder market size is projected to reach USD 1,512.6 million by 2035. Over the assessment period, demand for antimicrobial glass powders in China will likely rise at 12.3% CAGR.
The United States antimicrobial glass powder market is poised to exhibit a CAGR of 8.5% during the forecast period, totaling USD 988.5 million by 2035. This can be attributed to widening applications of antimicrobial glass powders in the booming healthcare sector.
The antimicrobial glass powder market value in Canada is anticipated to total USD 682.3 million by 2035. Overall demand for antimicrobial glass powders in the country is set to increase at a robust CAGR of 9.4%.
The section below shows the personal care & cosmetics segment dominating the antimicrobial glass powder industry. It will likely grow at a CAGR of 13.5% through 2035. Based on type, the bioactive-based segment is poised to exhibit a robust CAGR of 10.9% from 2025 to 2035.
| Top Segment (Application) | Personal Care & Cosmetics |
|---|---|
| Predicted CAGR (2025 to 2035) | 13.5% |
The latest stats indicate antimicrobial glass powder consumption to remain high in personal care and cosmetic products. The target segment will likely thrive at 13.5% CAGR, holding a significant volume share of 13.5% in 2025.
| Top Segment (Type) | Bioactive-based |
|---|---|
| Projected CAGR (2025 to 2035) | 10.9% |
As per the latest analysis, demand in the market is expected to remain high for bioactive-based antimicrobial glass powder during the forecast period. This can be attributed to rising usage of bioactive-based antimicrobial glass powder across industries like healthcare and food packaging.
The bioactive-based segment is projected to thrive at 10.9% CAGR during the forecast period. It will likely attain a market valuation of USD 3,341.5 million by 2035, making it a top revenue generation segment.
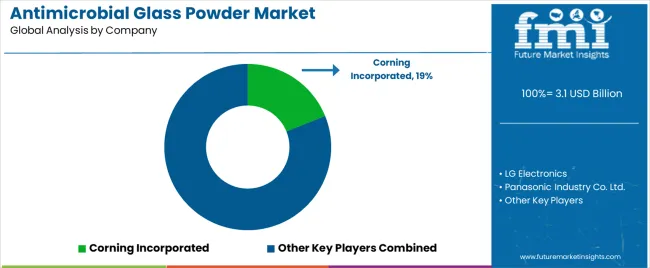
The antimicrobial glass powder market is fairly consolidated, with leading players accounting for about 75% to 80% share. LG Electronics, Panasonic Industry Co. Ltd., Ishizuka Glass Co. Ltd, BioCote Limited, CD Bioparticles, Koshida Corporation, Vedayukt India Private Limited, Hongwu International Group Ltd., HeiQ Materials AG, Addmaster (UK) Limited, Corning Incorporated, SCHOTT AG, and American Elements are a few leading manufacturers of antimicrobial glass powder listed in the report.
Top players are rigorously investing in research and development to produce antimicrobial glass powders with enhanced efficacy and durability. They are also using advanced manufacturing technologies and novel materials to stay ahead of their competitors.
Several antimicrobial glass powder manufacturers are employing strategies like partnerships, collaborations, alliances, facility expansions, acquisitions, and mergers. These strategies will help them to expand their global footprint as well as boost their revenue.
Recent Developments in Antimicrobial Glass Powder Market
| Attribute | Details |
|---|---|
| Estimated Market Size (2025) | USD 2,827.6 million |
| Projected Market Size (2035) | USD 7,702.0 million |
| Anticipated Growth Rate (2025 to 2035) | 10.6% |
| Historical Data | 2020 to 2025 |
| Forecast Period | 2025 to 2035 |
| Quantitative Units | Value (USD million) and Volume (thousand tons) |
| Report Coverage | Revenue Forecast, Volume Forecast, Company Ranking, Competitive Landscape, Growth Factors, Trends, and Pricing Analysis |
| Market Segments Covered | Type, Size, Application, Region |
| Key Countries Covered | North America, Latin America, Western Europe, Eastern Europe, East Asia, South Asia Pacific, Middle East & Africa |
| Key Companies Profiled | LG Electronics; Panasonic Industry Co. Ltd.; Ishizuka Glass Co Ltd; BioCote Limited; CD Bioparticles; Koshida Corporation; Vedayukt India Private Limited; Hongwu International Group Ltd; HeiQ Materials AG; Addmaster (UK) Limited; Corning Incorporated; SCHOTT AG; American Elements |
The global antimicrobial glass powder market is estimated to be valued at USD 3.1 billion in 2025.
The market size for the antimicrobial glass powder market is projected to reach USD 8.2 billion by 2035.
The antimicrobial glass powder market is expected to grow at a 10.1% CAGR between 2025 and 2035.
The key product types in antimicrobial glass powder market are metal oxide-based, photocatalytic and bioactive-based.
In terms of size, nano-sized segment to command 58.6% share in the antimicrobial glass powder market in 2025.


Our Research Products

The "Full Research Suite" delivers actionable market intel, deep dives on markets or technologies, so clients act faster, cut risk, and unlock growth.

The Leaderboard benchmarks and ranks top vendors, classifying them as Established Leaders, Leading Challengers, or Disruptors & Challengers.

Locates where complements amplify value and substitutes erode it, forecasting net impact by horizon

We deliver granular, decision-grade intel: market sizing, 5-year forecasts, pricing, adoption, usage, revenue, and operational KPIs—plus competitor tracking, regulation, and value chains—across 60 countries broadly.

Spot the shifts before they hit your P&L. We track inflection points, adoption curves, pricing moves, and ecosystem plays to show where demand is heading, why it is changing, and what to do next across high-growth markets and disruptive tech

Real-time reads of user behavior. We track shifting priorities, perceptions of today’s and next-gen services, and provider experience, then pace how fast tech moves from trial to adoption, blending buyer, consumer, and channel inputs with social signals (#WhySwitch, #UX).

Partner with our analyst team to build a custom report designed around your business priorities. From analysing market trends to assessing competitors or crafting bespoke datasets, we tailor insights to your needs.
Supplier Intelligence
Discovery & Profiling
Capacity & Footprint
Performance & Risk
Compliance & Governance
Commercial Readiness
Who Supplies Whom
Scorecards & Shortlists
Playbooks & Docs
Category Intelligence
Definition & Scope
Demand & Use Cases
Cost Drivers
Market Structure
Supply Chain Map
Trade & Policy
Operating Norms
Deliverables
Buyer Intelligence
Account Basics
Spend & Scope
Procurement Model
Vendor Requirements
Terms & Policies
Entry Strategy
Pain Points & Triggers
Outputs
Pricing Analysis
Benchmarks
Trends
Should-Cost
Indexation
Landed Cost
Commercial Terms
Deliverables
Brand Analysis
Positioning & Value Prop
Share & Presence
Customer Evidence
Go-to-Market
Digital & Reputation
Compliance & Trust
KPIs & Gaps
Outputs
Full Research Suite comprises of:
Market outlook & trends analysis
Interviews & case studies
Strategic recommendations
Vendor profiles & capabilities analysis
5-year forecasts
8 regions and 60+ country-level data splits
Market segment data splits
12 months of continuous data updates
DELIVERED AS:
PDF EXCEL ONLINE
Antimicrobial Powder Coating Market Size and Share Forecast Outlook 2025 to 2035
Glass Rolling Forming Machine Market Size and Share Forecast Outlook 2025 to 2035
Glass Liquor Bottle Market Size and Share Forecast Outlook 2025 to 2035
Antimicrobial HVAC Coating Market Size and Share Forecast Outlook 2025 to 2035
Glass Bottles Market Forecast and Outlook 2025 to 2035
Glass Laser Engraving Machine Market Size and Share Forecast Outlook 2025 to 2035
Glass Restoration Kit Market Size and Share Forecast Outlook 2025 to 2035
Glass Bottle and Container Market Forecast and Outlook 2025 to 2035
Antimicrobial Hospital Textile Market Forecast Outlook 2025 to 2035
Glass Additive Market Forecast and Outlook 2025 to 2035
Antimicrobial Cap Fitters Market Size and Share Forecast Outlook 2025 to 2035
Glass Reactor Market Size and Share Forecast Outlook 2025 to 2035
Glass Cosmetic Bottle Market Size and Share Forecast Outlook 2025 to 2035
Glass & Metal Cleaner Market Size and Share Forecast Outlook 2025 to 2035
Glass Product Market Size and Share Forecast Outlook 2025 to 2035
Antimicrobial Skincare Market Analysis - Size and Share Forecast Outlook 2025 to 2035
Glassine Paper Market Size and Share Forecast Outlook 2025 to 2035
Glass Container Market Size and Share Forecast Outlook 2025 to 2035
Glass Fibre Yarn Market Size and Share Forecast Outlook 2025 to 2035
Glass Cloth Electrical Insulation Tape Market Size and Share Forecast Outlook 2025 to 2035

Thank you!
You will receive an email from our Business Development Manager. Please be sure to check your SPAM/JUNK folder too.
Chat With
MaRIA