The glassine paper industry is poised for a decade-long expansion, projected to grow from USD 2.8 billion in 2025 to USD 4.3 billion by 2035, reflecting a CAGR of 4.3%. The first half of the decade (2025-2030) will see the market rise from USD 2.8 billion to approximately USD 3.5 billion, adding USD 0.7 billion, or 47% of the total growth. This phase will be defined by the widespread adoption of bleached glassine systems, driven by increasing packaging volumes and the demand for advanced barrier solutions. Enhanced paper capabilities and automated production systems will transition from premium options to standard expectations across food packaging, pharmaceutical, and industrial sectors.
In the latter half of the decade (2030-2035), the market is forecast to expand from USD 3.5 billion to USD 4.3 billion, adding USD 0.8 billion or 53% of the decade's growth. This period will see the mass adoption of advanced coating technologies, integration with packaging management platforms, and seamless compatibility with existing production systems. The market will experience fundamental shifts in how packaging facilities approach barrier optimization, as companies invest in high-performance materials and scalable production techniques. As demand grows across various product types and application segments, participants in the glassine paper market will benefit from innovations in packaging solutions and material management strategies.
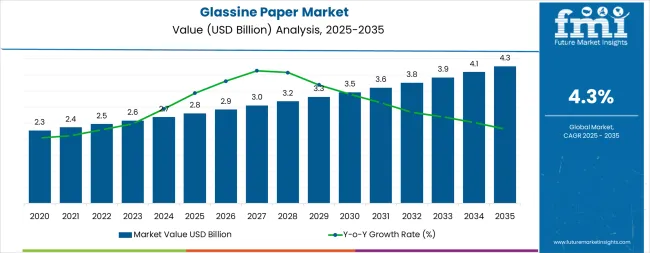
The glassine paper market demonstrates distinct growth phases with varying market characteristics and competitive dynamics. Between 2025 and 2030, the market progresses through its technology adoption phase, expanding from USD 2.8 billion to USD 3.5 billion with steady annual increments averaging 4.3% growth. This period showcases the transition from basic paper materials to advanced bleached glassine systems with enhanced barrier capabilities and integrated production systems becoming mainstream features.
The 2025-2030 phase adds USD 0.7 billion to market value, representing 47% of total decade expansion. Market maturation factors include standardization of packaging protocols, declining component costs for specialized equipment, and increasing industrial awareness of glassine benefits reaching 96-98% operational effectiveness in barrier applications. Competitive landscape evolution during this period features established paper companies like UPM-Kymmene Corporation and Glatfelter expanding their glassine portfolios while specialty manufacturers focus on advanced technology development and enhanced barrier capabilities.
From 2030 to 2035, market dynamics shift toward advanced coating integration and global packaging expansion, with growth continuing from USD 3.5 billion to USD 4.3 billion, adding USD 0.8 billion or 53% of total expansion. This phase transition centers on composite material systems, integration with automated monitoring networks, and deployment across diverse packaging and industrial scenarios, becoming standard rather than specialized applications. The competitive environment matures with focus shifting from basic barrier capability to comprehensive material optimization systems and integration with packaging monitoring platforms.
| Metric | Value |
|---|---|
| Market Value (2025) | USD 2.8 billion |
| Market Forecast (2035) | USD 4.3 billion |
| Growth Rate | 4.3% CAGR |
| Leading Technology | Bleached Glassine Type |
| Primary Application | Food Packaging Segment |
The market demonstrates strong fundamentals with bleached glassine systems capturing a dominant share through advanced barrier capabilities and material optimization. Food packaging applications drive primary demand, supported by increasing packaging development and industrial performance requirements. Geographic expansion remains concentrated in developed markets with established packaging infrastructure, while emerging economies show accelerating adoption rates driven by industrialization initiatives and rising quality standards.
Market expansion rests on three fundamental shifts driving adoption across the packaging and industrial sectors.
1. Performance mandates create compelling operational advantages through glassine paper that provides immediate barrier efficiency without material degradation, enabling packaging facilities to meet regulatory standards while maintaining production productivity and reducing contamination risks.
2. Packaging modernization accelerates as facilities worldwide seek advanced materials that complement traditional packaging methods, enabling precise moisture control and grease resistance that align with food safety regulations and operational efficiency standards.
3. Quality enhancement drives adoption from food processing facilities and pharmaceutical operations requiring effective barrier solutions that minimize product deterioration while maintaining operational productivity during packaging and storage operations.
However, growth faces headwinds from raw material cost challenges that vary across suppliers regarding the pricing of specialized paper equipment and coating systems, which may limit adoption in budget-sensitive packaging environments. Technical limitations also persist regarding paper capabilities and operational conditions that may reduce effectiveness in extreme humidity or challenging storage environments, which affect barrier performance and material consistency.
The glassine paper market will expand from USD 2.8 billion in 2025 to USD 4.3 billion by 2035, adding USD 1.5 billion in new value. Growth opportunities cluster around advanced bleached materials, food packaging applications, pharmaceutical demand, and smart production integration.
Primary Classification: The market segments by product type into bleached glassine, unbleached glassine, and machine glazed glassine, representing the evolution from basic paper materials to specialized barrier solutions for comprehensive packaging optimization.
Secondary Classification: Application segmentation divides the market into food packaging, pharmaceutical packaging, industrial packaging, and labels & tapes sectors, reflecting distinct requirements for operational performance, barrier compliance, and material efficiency standards.
Regional Classification: Geographic distribution covers North America, Latin America, Western Europe, Eastern Europe, East Asia, South Asia Pacific, and Middle East & Africa, with developed markets leading adoption while emerging economies show accelerating growth patterns driven by packaging expansion programs.
The segmentation structure reveals technology progression from standard paper materials toward specialized barrier systems with enhanced performance and automation capabilities, while application diversity spans from food facilities to pharmaceutical operations requiring precise moisture control solutions.
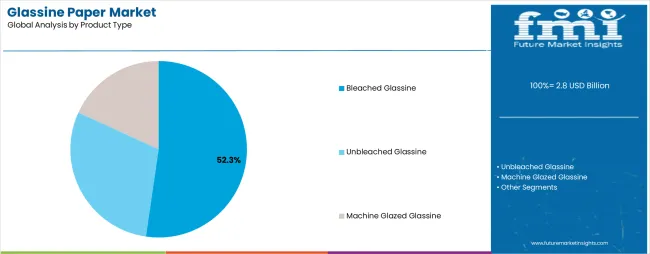
Market Position: Bleached Glassine systems command the leading position in the glassine paper market with 52.3% share and 4.8% CAGR through advanced barrier features, including superior moisture resistance, operational flexibility, and material optimization that enable packaging facilities to achieve optimal protection across diverse food and pharmaceutical environments.
Value Drivers: The segment benefits from packaging facility preference for reliable barrier systems that provide consistent moisture protection, reduced contamination risk, and operational efficiency optimization without requiring significant infrastructure modifications. Advanced coating features enable automated production systems, barrier consistency, and integration with existing packaging equipment, where operational performance and material reliability represent critical facility requirements.
Competitive Advantages: Bleached Glassine systems differentiate through proven operational stability, consistent barrier characteristics, and integration with automated packaging systems that enhance facility effectiveness while maintaining optimal quality standards for diverse food and pharmaceutical applications.
Key market characteristics:
Unbleached Glassine systems maintain a 31.5% market share in the glassine paper market due to their cost-effective properties and operational advantages. These systems appeal to facilities requiring basic barrier characteristics with competitive pricing for standard industrial packaging applications. Market growth is driven by industrial expansion, emphasizing economical packaging solutions and operational efficiency through optimized material designs.
Machine Glazed Glassine captures 16.2% market share through specialized surface requirements in industrial packaging facilities, label applications, and release liner operations. These facilities demand specialty paper systems capable of operating in diverse environments while providing effective surface smoothness and operational efficiency.
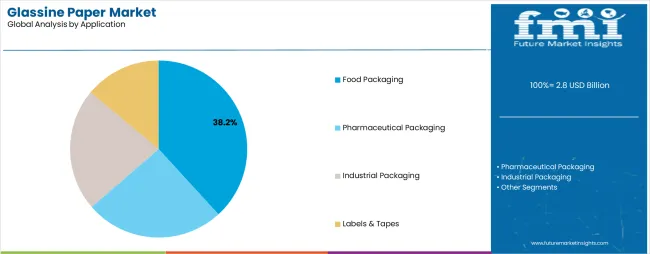
Market Context: Food Packaging applications demonstrate market leadership in the glassine paper market with 38.2% share and 4.9% CAGR due to widespread adoption of barrier systems and increasing focus on food safety optimization, quality preservation, and packaging modernization applications that maximize protection while maintaining regulatory standards.
Appeal Factors: Food packaging operators prioritize material reliability, barrier optimization, and integration with existing production infrastructure that enables coordinated moisture control across multiple packaging operations. The segment benefits from substantial food safety investment and modernization programs that emphasize the acquisition of glassine systems for quality control and contamination prevention applications.
Growth Drivers: Food safety programs incorporate glassine applications as standard materials for packaging operations, while food processing facility growth increases demand for reliable barrier capabilities that comply with regulatory standards and minimize contamination complexity.
Market Challenges: Varying food safety technology standards and packaging infrastructure differences may limit material standardization across different facilities or operational scenarios.
Application dynamics include:
Pharmaceutical Packaging applications capture 26.7% market share through stringent sterility requirements in drug packaging facilities, medical device operations, and healthcare applications. These facilities demand premium barrier systems capable of operating in controlled environments while providing effective moisture protection and contamination prevention capabilities.
Industrial Packaging applications account for 22.4% market share, including general manufacturing operations, component protection, and storage applications requiring barrier capabilities for operational optimization and product preservation.
Labels & Tapes applications account for 12.7% market share, including pressure-sensitive applications, release liner operations, and specialty adhesive applications requiring smooth surface capabilities for operational performance and product quality.
Growth Accelerators: Food safety development drives primary adoption as glassine paper provides barrier efficiency capabilities that enable packaging facilities to meet quality standards without excessive material degradation, supporting food processing and pharmaceutical missions that require precise moisture control applications. Packaging demand accelerates market expansion as facilities seek effective systems that minimize contamination risks while maintaining operational effectiveness during storage and transportation scenarios. Quality technology spending increases worldwide, creating continued demand for glassine systems that complement traditional packaging methods and provide material flexibility in complex food processing environments.
Growth Inhibitors: Raw material cost challenges vary across suppliers regarding the pricing of specialized paper systems and coating equipment, which may limit operational flexibility and market penetration in regions with budget constraints or cost-sensitive packaging operations. Technical performance limitations persist regarding paper capabilities and operational conditions that may reduce effectiveness in extreme humidity, challenging environments, or storage conditions, affecting barrier performance and material consistency. Market fragmentation across multiple packaging specifications and quality standards creates compatibility concerns between different material suppliers and existing packaging infrastructure.
Market Evolution Patterns: Adoption accelerates in food and pharmaceutical sectors where quality requirements justify glassine system costs, with geographic concentration in developed markets transitioning toward mainstream adoption in emerging economies driven by packaging initiatives and modernization development. Technology development focuses on enhanced barrier capabilities, improved moisture resistance, and integration with automated monitoring systems that optimize material performance and packaging effectiveness. The market could face disruption if alternative barrier technologies or packaging regulations significantly limit the deployment of traditional glassine materials in food or pharmaceutical applications.
The glassine paper market demonstrates varied regional dynamics with Growth Leaders including India (5.2% growth rate) and China (4.9% growth rate) driving expansion through packaging initiatives and modernization development. Steady Performers encompass Germany (4.5% growth rate), United States (4.1% growth rate), and Japan (4.0% growth rate), benefiting from established packaging sectors and advanced glassine adoption. Emerging Markets feature developing regions where packaging initiatives and quality modernization support consistent growth patterns.
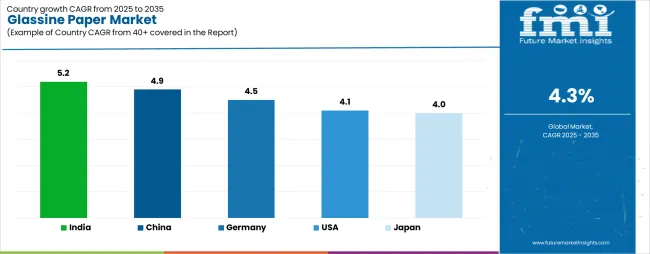
| Country | CAGR (2025-2035) |
|---|---|
| India | 5.2% |
| China | 4.9% |
| Germany | 4.5% |
| United States | 4.1% |
| Japan | 4.0% |
Regional synthesis reveals East Asian markets leading adoption through packaging expansion and modernization development, while South Asian countries maintain steady expansion supported by food processing technology advancement and quality standardization requirements. European markets show moderate growth driven by pharmaceutical applications and barrier integration trends.
India establishes fastest market growth through aggressive packaging programs and comprehensive food safety development, integrating advanced glassine paper as standard materials in food processing and pharmaceutical installations. The country's 5.2% growth rate reflects government initiatives promoting packaging technology and domestic manufacturing capabilities that mandate the use of advanced barrier systems in food and healthcare facilities. Growth concentrates in major industrial centers, including Mumbai, Delhi, and Chennai, where packaging technology development showcases integrated glassine systems that appeal to food operators seeking advanced facility optimization capabilities and quality management applications.
Indian manufacturers are developing cost-effective glassine solutions that combine domestic production advantages with advanced barrier features, including automated production systems and enhanced moisture resistance capabilities. Distribution channels through packaging suppliers and material distributors expand market access, while government support for food safety development supports adoption across diverse food processing and pharmaceutical segments.
Strategic Market Indicators:
In Beijing, Shanghai, and Guangzhou, food processing facilities and pharmaceutical plants are implementing advanced glassine paper as standard materials for barrier optimization and quality compliance applications, driven by increasing government food safety investment and packaging modernization programs that emphasize the importance of moisture control capabilities. The market holds a 4.9% growth rate, supported by government packaging initiatives and food processing infrastructure development programs that promote advanced glassine systems for food and pharmaceutical facilities. Chinese operators are adopting glassine systems that provide consistent operational performance and barrier compliance features, particularly appealing in urban regions where contamination prevention and quality standards represent critical operational requirements.
Market expansion benefits from growing packaging technology manufacturing capabilities and international technology transfer agreements that enable domestic production of advanced glassine systems for food and pharmaceutical applications. Technology adoption follows patterns established in packaging equipment, where reliability and quality drive procurement decisions and operational deployment.
Market Intelligence Brief:
Germany establishes technology leadership through comprehensive packaging programs and advanced manufacturing infrastructure development, integrating glassine paper across food and pharmaceutical applications. The country's 4.5% growth rate reflects established packaging relationships and mature glassine technology adoption that supports widespread use of barrier systems in food processing and pharmaceutical facilities. Growth concentrates in major industrial centers, including Bavaria, North Rhine-Westphalia, and Baden-Württemberg, where packaging technology showcases mature glassine deployment that appeals to food operators seeking proven barrier capabilities and operational efficiency applications.
German glassine providers leverage established distribution networks and comprehensive service capabilities, including quality programs and technical support that create customer relationships and operational advantages. The market benefits from mature food safety regulations and packaging standards that mandate glassine use while supporting technology advancement and operational optimization.
Market Intelligence Brief:
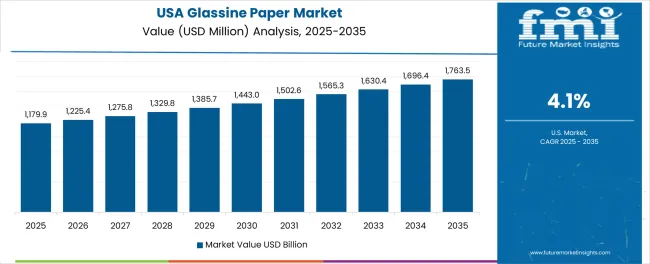
United States establishes market stability through comprehensive food safety programs and advanced packaging infrastructure development, integrating glassine paper across food and pharmaceutical applications. The country's 4.1% growth rate reflects established packaging relationships and mature glassine technology adoption that supports widespread use of barrier systems in food processing and healthcare facilities. Growth concentrates in major industrial centers, including California, Illinois, and New York, where packaging technology showcases mature glassine deployment that appeals to food operators seeking proven barrier capabilities and operational efficiency applications.
American glassine providers leverage established distribution networks and comprehensive service capabilities, including technical programs and quality support that create customer relationships and operational advantages. The market benefits from mature food safety regulations and packaging standards that mandate glassine use while supporting technology advancement and operational optimization.
Market Intelligence Brief:
Japan's market growth reflects precision manufacturing culture and stringent quality standards, with glassine paper adoption concentrated in pharmaceutical packaging and premium food applications. The country's 4.0% growth rate benefits from established packaging technology infrastructure and mature quality control systems that prioritize material consistency and barrier performance. Japanese operators emphasize miniaturization, stability under controlled conditions, and compatibility with automated packaging platforms, where operational precision represents non-negotiable requirements.
Market characteristics include high reliance on bleached glassine for pharmaceutical applications, integration with quality monitoring systems, and focus on material uniformity and long-term barrier stability. Demand concentrates in Tokyo, Osaka, and Nagoya, where pharmaceutical facilities and premium food packaging operations implement advanced glassine systems for contamination prevention and quality assurance.
Strategic Market Considerations:
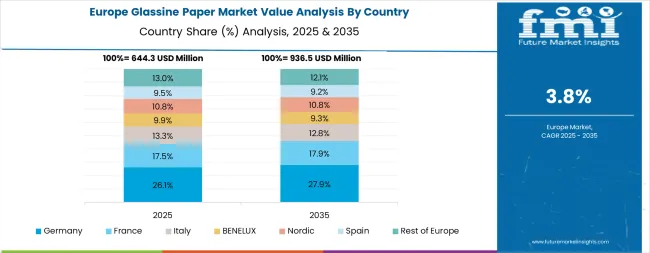
The European glassine paper market is projected to grow from USD 0.7 billion in 2025 to USD 1.0 billion by 2035, registering a CAGR of 3.9% over the forecast period. Germany is expected to maintain its leadership position with a 29.3% market share in 2025, supported by its advanced packaging technology infrastructure and major food processing centers.
France follows with a 21.5% share in 2025, driven by comprehensive food safety programs and pharmaceutical packaging development initiatives. United Kingdom holds a 19.7% share through specialized packaging applications and quality compliance requirements. Italy commands a 16.2% share, while Spain accounts for 13.3% in 2025. The rest of Europe region is anticipated to gain momentum, expanding its collective share from 7.8% to 8.2% by 2035, attributed to increasing packaging adoption in Nordic countries and emerging food processing facilities implementing quality modernization programs.
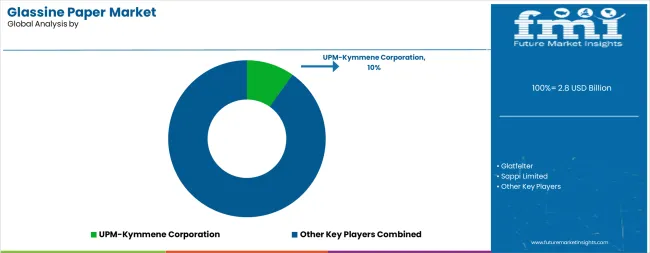
The glassine paper market operates with moderate concentration, featuring approximately 18-25 meaningful participants, where leading companies control roughly 45-50% of the global market share through established packaging relationships and comprehensive glassine portfolios. Competition emphasizes advanced barrier capabilities, material reliability, and packaging integration rather than price-based rivalry.
Market Leaders encompass UPM-Kymmene Corporation, Glatfelter, and Sappi Limited, which maintain competitive advantages through extensive paper technology expertise, global packaging distributor networks, and comprehensive material integration capabilities that create customer switching costs and support premium pricing. These companies leverage decades of glassine technology experience and ongoing research investments to develop advanced barrier systems with precision moisture control and quality monitoring features.
Technology Innovators include Stora Enso, Nippon Paper Industries Co. Ltd., and Munksjö Oyj, which compete through specialized glassine technology focus and innovative coating interfaces that appeal to packaging operators seeking advanced barrier capabilities and operational flexibility. These companies differentiate through rapid technology development cycles and specialized packaging application focus.
Regional Specialists feature companies like Loparex Group, Delfortgroup AG, and Patidar Corporation, which focus on specific geographic markets and specialized applications, including specialty coatings and integrated packaging solutions. Market dynamics favor participants that combine reliable barrier capabilities with advanced production software, including precision moisture control and automatic quality optimization capabilities. Competitive pressure intensifies as traditional paper manufacturers expand into glassine systems, while specialized packaging companies challenge established players through innovative barrier solutions and cost-effective materials targeting specialized food processing segments.
| Item | Value |
|---|---|
| Quantitative Units | USD 2.8 billion |
| Product Type | Bleached Glassine, Unbleached Glassine, Machine Glazed Glassine |
| Application | Food Packaging, Pharmaceutical Packaging, Industrial Packaging, Labels & Tapes |
| Regions Covered | North America, Latin America, Western Europe, Eastern Europe, East Asia, South Asia Pacific, Middle East & Africa |
| Countries Covered | United States, China, Germany, India, United Kingdom, Japan, France, Canada, Brazil, Australia, and 25+ additional countries |
| Key Companies Profiled | UPM-Kymmene Corporation, Glatfelter, Sappi Limited, Stora Enso, Nippon Paper Industries Co. Ltd., Munksjö Oyj, Loparex Group, Delfortgroup AG |
| Additional Attributes | Dollar sales by product type and application categories, regional adoption trends across East Asia, South Asia Pacific, and Western Europe, competitive landscape with paper manufacturers and technical material suppliers, packaging operator preferences for precision moisture control and material reliability, integration with packaging platforms and quality monitoring systems, innovations in glassine technology and barrier enhancement, and development of automated production solutions with enhanced performance and packaging optimization capabilities. |
The global glassine paper market is estimated to be valued at USD 2.8 billion in 2025.
The market size for the glassine paper market is projected to reach USD 4.3 billion by 2035.
The glassine paper market is expected to grow at a 4.3% CAGR between 2025 and 2035.
The key product types in glassine paper market are bleached glassine, unbleached glassine and machine glazed glassine.
In terms of application, food packaging segment to command 38.2% share in the glassine paper market in 2025.


Full Research Suite comprises of:
Market outlook & trends analysis
Interviews & case studies
Strategic recommendations
Vendor profiles & capabilities analysis
5-year forecasts
8 regions and 60+ country-level data splits
Market segment data splits
12 months of continuous data updates
DELIVERED AS:
PDF EXCEL ONLINE
Glassine Paper Industry Analysis in Western Europe Size and Share Forecast Outlook 2025 to 2035
Glassine Paper Industry Analysis in Korea Size and Share Forecast Outlook 2025 to 2035
Glassine Paper Industry Analysis in Japan Size and Share Forecast Outlook 2025 to 2035
Examining Market Share Trends in the Glassine Paper Industry
Super Calendered Glassine Paper Market Size and Share Forecast Outlook 2025 to 2035
Paper Edge Protector Market Size and Share Forecast Outlook 2025 to 2035
Paper Cup Lids Market Size and Share Forecast Outlook 2025 to 2035
Paper Pallet Market Size and Share Forecast Outlook 2025 to 2035
Paper and Paperboard Packaging Market Forecast and Outlook 2025 to 2035
Paper Wrap Market Size and Share Forecast Outlook 2025 to 2035
Paper Cups Market Size and Share Forecast Outlook 2025 to 2035
Paper Core Market Size and Share Forecast Outlook 2025 to 2035
Paper Bags Market Size and Share Forecast Outlook 2025 to 2035
Paper Processing Resins Market Size and Share Forecast Outlook 2025 to 2035
Paper Tester Market Size and Share Forecast Outlook 2025 to 2035
Paper Napkin Converting Lines Market Size and Share Forecast Outlook 2025 to 2035
Paper Packaging Tapes Market Size and Share Forecast Outlook 2025 to 2035
Paper Napkins Converting Machines Market Size and Share Forecast Outlook 2025 to 2035
Paper Coating Binders Market Size and Share Forecast Outlook 2025 to 2035
Paper Core Cutting Machine Market Size and Share Forecast Outlook 2025 to 2035

Thank you!
You will receive an email from our Business Development Manager. Please be sure to check your SPAM/JUNK folder too.
Chat With
MaRIA