Paper Packaging Market Size and Share Forecast Outlook 2025 to 2035

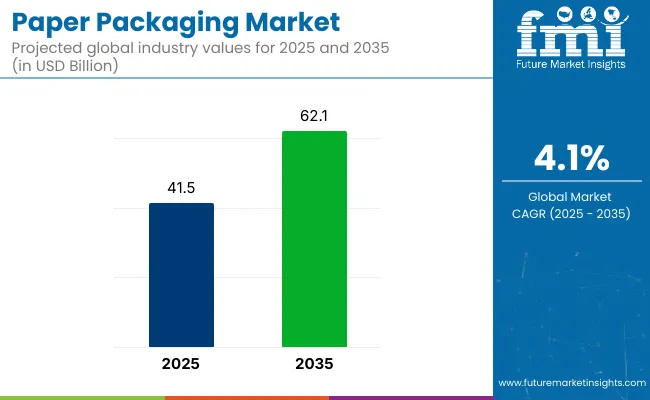
The global paper packaging market is projected to reach USD 41.5 billion by 2025 and is expected to grow at a CAGR of 4.1%, attaining USD 62.0 billion by 2035.

The expansion is being driven by a widespread shift toward sustainable, biodegradable, and recyclable packaging solutions, particularly across the food & beverage, pharmaceutical, personal care, and e-commerce sectors. Paper-based materials are increasingly preferred due to their high tensile strength, lightweight nature, and environmental advantages over single-use plastic packaging.

Paper Packaging Market

In markets with stringent regulations on plastic consumption, such as the European Union, Canada, and parts of Asia, paper packaging is being adopted not just as a regulatory necessity but as a competitive brand differentiator.

Governmental initiatives encouraging circular economy practices and extended producer responsibility (EPR) frameworks are reinforcing the demand. According to a 2024 report by the World Packaging Organization (WPO), more than 70 countries had introduced regulatory roadmaps targeting single-use plastics, indirectly supporting the growth of the paper packaging sector.

In a 2024 press statement, Andrew King, CEO of Mondi Group, highlighted the company’s acquisition of the Hinton Pulp Mill in Alberta, Canada, as a pivotal move in expanding the group’s sustainable production footprint.

“This acquisition significantly increases our corrugated converting capacity, extends our reach across Western Europe, and offers strong downstream integration opportunities,” King noted. The deal was viewed as a strategic response to rising European demand for recycled and semi-chemical corrugated packaging materials.
Analyzing Paper Packaging Market by Top Investment Segments

Corrugated Paper Packaging: Market Leader in Durable and Eco-Friendly Solutions

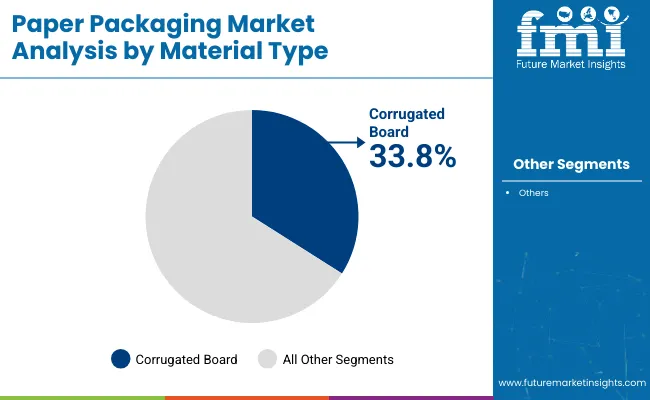
Corrugated paper packaging is projected to hold a 51.3% value share of the global paper packaging market in 2025. Its dominance is attributed to growing demand for durable, cost-effective, and eco-friendly shipping and secondary packaging formats. Industries such as electronics, food delivery, e-commerce, and logistics continue to rely heavily on corrugated formats due to their high stacking strength and structural resilience.

Key market players, including International Paper, WestRock, and DS Smith, have made significant investments in fiber reinforcement technologies, moisture-resistant liners, and biodegradable glues. These upgrades are improving the functional strength of corrugated boxes while maintaining recyclability. WestRock’s 2024 sustainability report highlighted a 17% reduction in fiber content through AI-powered optimization without compromising on package integrity.

Technological advancements such as lightweight high-compression boards, AI-based load optimization, and automated box design platforms are being widely deployed. These tools are especially relevant for e-commerce, where the volume of single-use shipping materials is high, and any reduction in weight can deliver significant cost and carbon savings.

Key Demand Drivers: Food & Beverage and E-Commerce Industries

The food & beverage and e-commerce sectors are together expected to account for 58.2% of the global demand for corrugated paper packaging by 2025. These industries are increasingly seeking lightweight, protective, and recyclable packaging formats to meet regulatory compliance and consumer expectations for sustainable products. In the food & beverage space, global brands such as Nestlé, Unilever, and Coca-Cola have publicly committed to shifting away from plastic-based outer packaging.

Corrugated boxes are being used for shipping bulk food items, meal kits, and even refrigerated goods, thanks to grease-resistant and humidity-proof corrugated variants. Nestlé’s 2025 sustainability roadmap reported that over 85% of its outer secondary packaging has transitioned to recyclable paper-based materials.

The e-commerce industry, led by companies like Amazon, Alibaba, and Walmart, is heavily investing in corrugated packaging that minimizes dimensional weight and offers tamper-resistance. Corrugated mailers and modular box systems are enabling cost-effective last-mile delivery while supporting sustainability goals. Amazon’s 2025 ESG report cited over 75,000 metric tons of packaging material saved annually through automated package size optimization and smarter corrugated formats.

Regional Market Trends

Asia-Pacific

Asia-Pacific will lead the paper packaging market, spurred by swift industrialization, surging e-commerce activity, and heightened demand for environmentally friendly packaging solutions. China, India, and Japan are seeing high demand for paper packaging in food packaging, personal care items, and pharmaceuticals.

The growth in the region's market is supplemented by advances in flexible paper packing, affordable manufacturing methods, and automation of package processes. Other regulatory policies such as plastic waste reduction and EPR schemes also encourage manufacturers to invest in recycle-friendly paper packaging solutions.

More global FMCG companies and manufacturers of packaging units are also putting up operations in Asia-Pacific to increase local capacities. In addition, R&D in grease-proof and water-resistant paper packaging are likely to open new avenues of growth for the industry in the region.

North America

North America remains a significant market for paper packaging due to strong demand from the food & beverage, pharmaceutical, and e-commerce sectors. The United States and Canada are leading the way in the region with innovation in recyclable paper packaging, tamper-evident caps, and bio-based barrier coatings. Additionally, massive investment in automation and AI-driven defect detection is driving efficiency and reducing material loss throughout the industry.

The use of compost and recyclable paper packaging is picking up speed, spurred by regulatory mandates to reduce plastic waste and promote circular economy initiatives. Increased research and development expenditure in leak-proof, high-barrier, and lightweight paper packaging solutions is also fueling market growth.

Growing demand for sustainable and resealable packaging in food delivery, cosmetics, and household product industries is also spurring product innovation. A number of North American businesses also want to integrate antimicrobial coatings and intelligent labeling into paper packaging for enhanced food safety and traceability. Developments in lightweight yet robust paper packaging with improved recyclability are likely to further influence the market in the next few years.

Europe

Europe is accounted for a remarkable proportion of paper packaging market shares due to high environmental regulations, growing circular economy practices adoption, and rising demands for compostable products. France, Germany, and the UK are among top economies leading development in fiber packaging technology, carbon-low production methodology, and hydrophobic waterproof coatings.

Expenditures toward advanced polymer sciences are also expanding the effectiveness of paper packaging functions. Construction of closed-loop recycling systems for post-consumer flexible packaging waste is also propelling the transformation of the region's practices towards the circular economy.

Strict policies favoring plastic-free food packaging, extended producer responsibility (EPR), and sustainable material development are defining the future of the market. Increasing consumer knowledge and demand for premium, resealable, and totally recyclable paper packaging are also slated to drive long-term market growth.

The region is also seeing more partnerships between food producers, personal care companies, and sustainable organizations to create next-generation paper packaging solutions. In addition, European research organizations are funding AI-based production optimization, moisture-resistant coatings, and intelligent packaging films. All these are set to increase the overall efficiency and uptake of paper packaging in many industries.

Challenges and Opportunities

Challenges

  • Regulatory restrictions on plastic coatings in paper packaging: Increasing bans on conventional plastic-lined paper and mandates for fully recyclable alternatives pose challenges for manufacturers.
  • Fluctuating raw material prices: Price volatility in pulp, bio-based coatings, and recycled fiber impacts production costs and profitability.

Opportunities

  • Expansion in recyclable and compostable paper packaging solutions: Growing demand for eco-friendly, reusable, and fully recyclable packaging solutions presents significant opportunities for manufacturers.
  • Advancements in AI-driven packaging tracking and smart packaging designs: Increasing research in tamper-evident security, IoT-enabled freshness tracking, and digital authentication is expected to drive market growth.

Market Shifts: A Comparative Analysis 2020 to 2024 vs. 2025 to 2035

Market Shift 2020 to 2024 Trends
Regulatory Landscape Initial focus on improving recyclability and reducing plastic waste.
Material and Formulation Innovations Development of lightweight, high-barrier fiber-based packaging.
Industry Adoption Widely used in food service, e-commerce, and personal care packaging.
Market Competition Dominated by traditional flexible packaging manufacturers.
Market Growth Drivers Growth driven by demand for lightweight, resealable paper packaging.
Sustainability and Environmental Impact Early-stage adoption of recyclable and lightweight paper packaging.
Integration of AI and Process Optimization Limited AI use in defect detection and packaging optimization.
Advancements in Packaging Technology Basic improvements in sealing and moisture resistance.
Market Shift 2025 to 2035 Projections
Regulatory Landscape Stricter global policies mandating fully recyclable and compostable paper packaging.
Material and Formulation Innovations Expansion of AI-driven, biodegradable, and tamper-proof paper packaging technologies.
Industry Adoption Increased adoption in premium food packaging, refillable personal care solutions, and high-barrier medical packaging.
Market Competition Rise of sustainability-focused startups and AI-driven packaging firms.
Market Growth Drivers Market expansion fueled by automation, AI integration, and plastic-free fiber-based packaging technologies.
Sustainability and Environmental Impact Large-scale transition to biodegradable, reusable, and fiber-based packaging solutions.
Integration of AI and Process Optimization AI-driven predictive analytics, automated packaging manufacturing, and real-time defect tracking.
Advancements in Packaging Technology Development of smart paper packaging with QR codes, RFID-enabled tracking, and IoT-connected freshness monitoring.

Country-wise Outlook

United States

In the paper packaging industry, the United States is at the forefront with a likely growing demand for sustainable, cost-efficient, and long-lived packaging solutions by consumers from various industries like food & beverages, healthcare, and e-commerce. The demand for green alternatives, alongside some government strict rules against single-use plastics, create a space for innovation concerning recyclable and biodegradable paper packaging.

Companies are investing heavily in corrugated packaging designed especially to be high-strength, molded fiber trays, and water-resistant paper coatings to better protect and place their products more sustainably. Additional investments are being made into artificial intelligence (AI) packaging automation, intelligent tracking solutions, and digital printing technologies to maximize efficiency and consumer interaction. Lastly, the USA's growing popularity of recyclable and plant-based materials will further drive the market for paper packaging in the country.

Country CAGR (2025 to 2035)
United States 6.0%

United Kingdom

The UK paper packaging industry is witnessing swift growth because of regulatory measures to curb plastic waste and foster circular economy approaches. The introduction of extended producer responsibility (EPR) schemes, plastic taxes, and sustainability pledges by large brands is speeding up the transition towards recyclable, compostable, and reusable paper-based packaging.

Businesses are investing in light-weight yet robust paperboard, food-grade coatings, and fiber-based flexible packaging to address changing industry demands. In addition, advancements in waterproof paper wraps, grease-proof film coatings, and tamper-evident packages are picking up pace. Growing demand for custom and digitally printed packaging for labeling is also driving innovation in the UK paper packaging industry.

Country CAGR (2025 to 2035)
United Kingdom 5.7%

Japan

Japan's paper packaging industry is recording stable growth through high consumer education, stringent recycling rules, and innovations in paper-based materials through technological improvements. Lightweight, neat, and practical packaging solutions to the food, cosmetic, and electronic industries are stimulating paper package innovation.

Such firms are inventing high-barrier paper packages, water-barrier paperboard, and antimicrobial paper treatments for improved protection of products. Also, developments in AI-driven quality control, robot-based packaging automation, and RFID-enabled smart labels are enhancing efficiency and traceability. The shift towards minimalist, plastic-free, and compostable packaging is also in line with Japan's sustainability agenda and reinforcing its paper packaging sector.

Country CAGR (2025 to 2035)
Japan 5.3%

South Korea

South Korea's paper packaging industry, according to government initiatives on green packaging and extended recycling programs combined with business commitment to sustainability, has a good growth prospect. An increasing demand and popularity for biodegradable and lightweight paper packaging among consumers, e-commerce food delivery, and consumer goods sectors are consequently propelling the market's growth.

Add to that, coated barrier paper, plant-based ink, and recyclable adhesives these companies are investing into the packaging industry to improve functionality and minimize negative environmental impacts. Such innovations include digital printing, automated packaging lines, and smart supply chains. The South Korean paper packaging industry is poised to grow due to an increasing preference for bio-based materials in packaging and novel fiber-based forms for packaging.

Country CAGR (2025 to 2035)
South Korea 5.8%

Competitive Outlook

The paper packaging industry is driven by growing demand in food & beverage, e-commerce, and retail sectors. The industry is being led by innovation in the form of developments in new materials, including water-resistant paper, bio-based coatings, and AI-driven printing optimization, to mitigate efficiency, sustainability, and performance concerns.

There are also developments in automated paper packaging manufacturing and AI-assisted quality control driving industry patterns. The increasing demand for compostable and high-barrier paper packaging is also driving market growth. Additionally, growing investments in sustainable paperboard manufacturing and smart packaging integration are enhancing product efficiency and broadening market opportunities.

Hybrid packaging solutions that combine high-strength paper with moisture-resistant barriers are also being developed by companies for greater usability. Further, partnerships among consumer brands and packaging manufacturers are fuelling innovation for tailored paper-based packaging solutions with varied industry demands.

Market Share Analysis by Company

Company Name Estimated Market Share (%)
International Paper 12-16%
WestRock Company 8-12%
Mondi Group 6-10%
Smurfit Kappa Group 4-8%
DS Smith Plc 3-7%
Other Companies (combined) 45-55%

Key Company Offerings and Activities

Company Name Key Offerings/Activities
International Paper Develops high-performance, recyclable paper packaging solutions for food, retail, and e-commerce industries.
WestRock Company Specializes in lightweight, high-barrier paper packaging with sustainable coatings for food and beverage applications.
Mondi Group Produces AI-driven, high-performance paper packaging optimized for industrial, retail, and flexible applications.
Smurfit Kappa Group Expands its product line with sustainable and bio-based paper packaging solutions for logistics and consumer goods.
DS Smith Plc Focuses on innovative paper packaging solutions with AI-powered quality control for premium retail and e-commerce applications.

Key Company Insights

  • International Paper (12-16%): International Paper leads in high-performance paper packaging solutions, emphasizing sustainability and innovation in recyclable materials.
  • WestRock Company (8-12%): WestRock is a dominant player, offering lightweight, high-barrier paper packaging with advanced coatings for food, beverage, and e-commerce applications.
  • Mondi Group (6-10%): Mondi enhances its portfolio with AI-driven, high-performance paper packaging optimized for industrial, retail, and flexible applications.
  • Smurfit Kappa Group (4-8%): Smurfit Kappa strengthens its market presence with sustainable and bio-based paper packaging solutions tailored for logistics and consumer goods.
  • DS Smith Plc (3-7%): DS Smith focuses on innovative, moisture-resistant paper packaging solutions with AI-powered quality control for premium retail and e-commerce applications.

Other Key Players (45-55% Combined) Several specialty paper packaging manufacturers contribute to the expanding market. These include:

  • Stora Enso: Develops high-strength, recyclable paper packaging solutions for food service, e-commerce, and retail applications.
  • Graphic Packaging International: Specializes in lightweight and sustainable paperboard packaging with innovative moisture-resistant coatings.
  • Kruger Packaging: Produces advanced, eco-friendly paper packaging for high-performance consumer and industrial applications.
  • Sonoco Products Company: Focuses on AI-integrated paper packaging technologies for food safety and extended shelf-life applications.
  • BioPak: Innovates with compostable and biodegradable paper packaging solutions tailored for environmentally conscious brands.

Key Segments Covered in Paper Packaging Industry Research

By Material Type:

  • Corrugated Board
  • Specialty Paper
  • Box-board/Carton Board
  • Kraft Papers
  • Molded Pulp

By Packaging Type:

  • Corrugated Boxes
  • Cartons
  • Wrapping Paper
  • Inserts & Dividers
  • Bottle & Cup Carriers
  • Cups & Trays
  • Clamshell
  • Display Packaging
  • Bags & Sacks
  • Tapes & Labels

By Level of Packaging:

  • Primary Packaging
  • Secondary Packaging
  • Tertiary Packaging

By End Use:

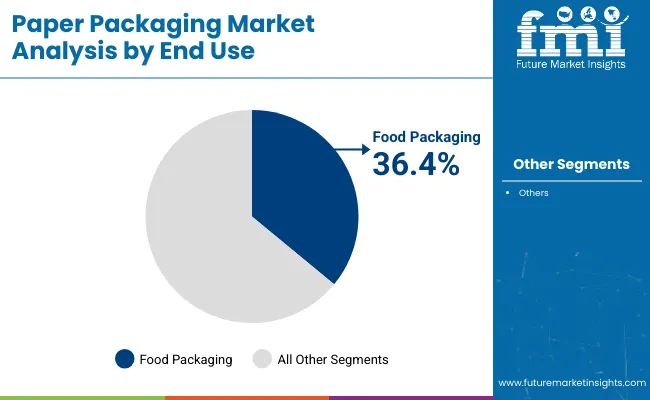
  • Food Packaging
  • Beverage Packaging
  • Tobacco Packaging
  • Healthcare Packaging
  • Personal Care & Cosmetics
  • Homecare & Toiletries
  • Electrical & Electronics
  • Industrial Packaging
  • E-Commerce Packaging
  • Chemical & Fertilizers

By Region:

  • North America
  • Latin America
  • Europe
  • East Asia
  • South Asia
  • Oceania
  • The Middle East & Africa

Table of Content

  1. Executive Summary
  2. Industry Introduction, including Taxonomy and Market Definition
  3. Market Trends and Success Factors, including Macro-economic Factors, Market Dynamics, and Recent Industry Developments
  4. Global Market Demand Analysis 2020 to 2024 and Forecast 2025 to 2035, including Historical Analysis and Future Projections
  5. Global Market Analysis 2020 to 2024 and Forecast 2025 to 2035
    • Material
    • Packaging Type
    • End Use
  6. Global Market Analysis 2020 to 2024 and Forecast 2025 to 2035, By Material
    • Corrugated Board
    • Specialty Paper
    • Box-board/Carton Board
    • Kraft Papers
    • Molded Pulp
  7. Global Market Analysis 2020 to 2024 and Forecast 2025 to 2035, By Packaging Type
    • Corrugated Boxes
    • Cartons
    • Wrapping Paper
    • Inserts & Dividers
    • Bottle & Cup Carriers
    • Cups & Trays
    • Clamshell
    • Display Packaging
    • Bags & Sacks
    • Tapes & Labels
  8. Global Market Analysis 2020 to 2024 and Forecast 2025 to 2035, By End Use
    • Food & Beverage
    • Healthcare Packaging
    • Personal Care & Cosmetics
    • Homecare & Toiletries
    • Electrical & Electronics
    • Industrial Packaging
    • E-Commerce Packaging
    • Chemical & Fertilizers
  9. Global Paper Packaging Market Analysis 2020 to 2024 and Forecast 2025 to 2035, By Region
    • North America
    • Latin America
    • East Asia
    • South Asia & Pacific
    • Eastern Europe
    • Western Europe
    • Middle East & Africa
  10. North America Sales Analysis 2020 to 2024 and Forecast 2025 to 2035, by Key Segments and Countries
  11. Latin America Sales Analysis 2020 to 2024 and Forecast 2025 to 2035, by Key Segments and Countries
  12. East Asia Sales Analysis 2020 to 2024 and Forecast 2025 to 2035, by Key Segments and Countries
  13. South Asia & Pacific Sales Analysis 2020 to 2024 and Forecast 2025 to 2035, by Key Segments and Countries
  14. Eastern Europe Sales Analysis 2020 to 2024 and Forecast 2025 to 2035, by Key Segments and Countries
  15. Western Europe Sales Analysis 2020 to 2024 and Forecast 2025 to 2035, by Key Segments and Countries
  16. Middle East & Africa Sales Analysis 2020 to 2024 and Forecast 2025 to 2035, by Key Segments and Countries
  17. Sales Forecast 2025 to 2035 by Material, Packaging Type, and End Use for 30 Countries
  18. Competition Outlook, including Market Structure Analysis, Company Share Analysis by Key Players, and Competition Dashboard
  19. Company Profile
    • International Paper
    • WestRock Company
    • Mondi Group
    • Smurfit Kappa Group
    • DS Smith Plc
    • Stora Enso
    • Graphic Packaging International
    • Kruger Packaging
    • Sonoco Products Company
    • BioPak

List of Tables

Table 1: Global Market Value (US$ Million) Forecast by Region, 2018 to 2033

Table 2: Global Market Volume (Tonnes) Forecast by Region, 2018 to 2033

Table 3: Global Market Value (US$ Million) Forecast by Material Type, 2018 to 2033

Table 4: Global Market Volume (Tonnes) Forecast by Material Type, 2018 to 2033

Table 5: Global Market Value (US$ Million) Forecast by Packaging Type, 2018 to 2033

Table 6: Global Market Volume (Tonnes) Forecast by Packaging Type, 2018 to 2033

Table 7: Global Market Value (US$ Million) Forecast by End-use, 2018 to 2033

Table 8: Global Market Volume (Tonnes) Forecast by End-use, 2018 to 2033

Table 9: North America Market Value (US$ Million) Forecast by Country, 2018 to 2033

Table 10: North America Market Volume (Tonnes) Forecast by Country, 2018 to 2033

Table 11: North America Market Value (US$ Million) Forecast by Material Type, 2018 to 2033

Table 12: North America Market Volume (Tonnes) Forecast by Material Type, 2018 to 2033

Table 13: North America Market Value (US$ Million) Forecast by Packaging Type, 2018 to 2033

Table 14: North America Market Volume (Tonnes) Forecast by Packaging Type, 2018 to 2033

Table 15: North America Market Value (US$ Million) Forecast by End-use, 2018 to 2033

Table 16: North America Market Volume (Tonnes) Forecast by End-use, 2018 to 2033

Table 17: Latin America Market Value (US$ Million) Forecast by Country, 2018 to 2033

Table 18: Latin America Market Volume (Tonnes) Forecast by Country, 2018 to 2033

Table 19: Latin America Market Value (US$ Million) Forecast by Material Type, 2018 to 2033

Table 20: Latin America Market Volume (Tonnes) Forecast by Material Type, 2018 to 2033

Table 21: Latin America Market Value (US$ Million) Forecast by Packaging Type, 2018 to 2033

Table 22: Latin America Market Volume (Tonnes) Forecast by Packaging Type, 2018 to 2033

Table 23: Latin America Market Value (US$ Million) Forecast by End-use, 2018 to 2033

Table 24: Latin America Market Volume (Tonnes) Forecast by End-use, 2018 to 2033

Table 25: Europe Market Value (US$ Million) Forecast by Country, 2018 to 2033

Table 26: Europe Market Volume (Tonnes) Forecast by Country, 2018 to 2033

Table 27: Europe Market Value (US$ Million) Forecast by Material Type, 2018 to 2033

Table 28: Europe Market Volume (Tonnes) Forecast by Material Type, 2018 to 2033

Table 29: Europe Market Value (US$ Million) Forecast by Packaging Type, 2018 to 2033

Table 30: Europe Market Volume (Tonnes) Forecast by Packaging Type, 2018 to 2033

Table 31: Europe Market Value (US$ Million) Forecast by End-use, 2018 to 2033

Table 32: Europe Market Volume (Tonnes) Forecast by End-use, 2018 to 2033

Table 33: Asia Pacific Market Value (US$ Million) Forecast by Country, 2018 to 2033

Table 34: Asia Pacific Market Volume (Tonnes) Forecast by Country, 2018 to 2033

Table 35: Asia Pacific Market Value (US$ Million) Forecast by Material Type, 2018 to 2033

Table 36: Asia Pacific Market Volume (Tonnes) Forecast by Material Type, 2018 to 2033

Table 37: Asia Pacific Market Value (US$ Million) Forecast by Packaging Type, 2018 to 2033

Table 38: Asia Pacific Market Volume (Tonnes) Forecast by Packaging Type, 2018 to 2033

Table 39: Asia Pacific Market Value (US$ Million) Forecast by End-use, 2018 to 2033

Table 40: Asia Pacific Market Volume (Tonnes) Forecast by End-use, 2018 to 2033

Table 41: MEA Market Value (US$ Million) Forecast by Country, 2018 to 2033

Table 42: MEA Market Volume (Tonnes) Forecast by Country, 2018 to 2033

Table 43: MEA Market Value (US$ Million) Forecast by Material Type, 2018 to 2033

Table 44: MEA Market Volume (Tonnes) Forecast by Material Type, 2018 to 2033

Table 45: MEA Market Value (US$ Million) Forecast by Packaging Type, 2018 to 2033

Table 46: MEA Market Volume (Tonnes) Forecast by Packaging Type, 2018 to 2033

Table 47: MEA Market Value (US$ Million) Forecast by End-use, 2018 to 2033

Table 48: MEA Market Volume (Tonnes) Forecast by End-use, 2018 to 2033

List of Figures

Figure 1: Global Market Value (US$ Million) by Material Type, 2023 to 2033

Figure 2: Global Market Value (US$ Million) by Packaging Type, 2023 to 2033

Figure 3: Global Market Value (US$ Million) by End-use, 2023 to 2033

Figure 4: Global Market Value (US$ Million) by Region, 2023 to 2033

Figure 5: Global Market Value (US$ Million) Analysis by Region, 2018 to 2033

Figure 6: Global Market Volume (Tonnes) Analysis by Region, 2018 to 2033

Figure 7: Global Market Value Share (%) and BPS Analysis by Region, 2023 to 2033

Figure 8: Global Market Y-o-Y Growth (%) Projections by Region, 2023 to 2033

Figure 9: Global Market Value (US$ Million) Analysis by Material Type, 2018 to 2033

Figure 10: Global Market Volume (Tonnes) Analysis by Material Type, 2018 to 2033

Figure 11: Global Market Value Share (%) and BPS Analysis by Material Type, 2023 to 2033

Figure 12: Global Market Y-o-Y Growth (%) Projections by Material Type, 2023 to 2033

Figure 13: Global Market Value (US$ Million) Analysis by Packaging Type, 2018 to 2033

Figure 14: Global Market Volume (Tonnes) Analysis by Packaging Type, 2018 to 2033

Figure 15: Global Market Value Share (%) and BPS Analysis by Packaging Type, 2023 to 2033

Figure 16: Global Market Y-o-Y Growth (%) Projections by Packaging Type, 2023 to 2033

Figure 17: Global Market Value (US$ Million) Analysis by End-use, 2018 to 2033

Figure 18: Global Market Volume (Tonnes) Analysis by End-use, 2018 to 2033

Figure 19: Global Market Value Share (%) and BPS Analysis by End-use, 2023 to 2033

Figure 20: Global Market Y-o-Y Growth (%) Projections by End-use, 2023 to 2033

Figure 21: Global Market Attractiveness by Material Type, 2023 to 2033

Figure 22: Global Market Attractiveness by Packaging Type, 2023 to 2033

Figure 23: Global Market Attractiveness by End-use, 2023 to 2033

Figure 24: Global Market Attractiveness by Region, 2023 to 2033

Figure 25: North America Market Value (US$ Million) by Material Type, 2023 to 2033

Figure 26: North America Market Value (US$ Million) by Packaging Type, 2023 to 2033

Figure 27: North America Market Value (US$ Million) by End-use, 2023 to 2033

Figure 28: North America Market Value (US$ Million) by Country, 2023 to 2033

Figure 29: North America Market Value (US$ Million) Analysis by Country, 2018 to 2033

Figure 30: North America Market Volume (Tonnes) Analysis by Country, 2018 to 2033

Figure 31: North America Market Value Share (%) and BPS Analysis by Country, 2023 to 2033

Figure 32: North America Market Y-o-Y Growth (%) Projections by Country, 2023 to 2033

Figure 33: North America Market Value (US$ Million) Analysis by Material Type, 2018 to 2033

Figure 34: North America Market Volume (Tonnes) Analysis by Material Type, 2018 to 2033

Figure 35: North America Market Value Share (%) and BPS Analysis by Material Type, 2023 to 2033

Figure 36: North America Market Y-o-Y Growth (%) Projections by Material Type, 2023 to 2033

Figure 37: North America Market Value (US$ Million) Analysis by Packaging Type, 2018 to 2033

Figure 38: North America Market Volume (Tonnes) Analysis by Packaging Type, 2018 to 2033

Figure 39: North America Market Value Share (%) and BPS Analysis by Packaging Type, 2023 to 2033

Figure 40: North America Market Y-o-Y Growth (%) Projections by Packaging Type, 2023 to 2033

Figure 41: North America Market Value (US$ Million) Analysis by End-use, 2018 to 2033

Figure 42: North America Market Volume (Tonnes) Analysis by End-use, 2018 to 2033

Figure 43: North America Market Value Share (%) and BPS Analysis by End-use, 2023 to 2033

Figure 44: North America Market Y-o-Y Growth (%) Projections by End-use, 2023 to 2033

Figure 45: North America Market Attractiveness by Material Type, 2023 to 2033

Figure 46: North America Market Attractiveness by Packaging Type, 2023 to 2033

Figure 47: North America Market Attractiveness by End-use, 2023 to 2033

Figure 48: North America Market Attractiveness by Country, 2023 to 2033

Figure 49: Latin America Market Value (US$ Million) by Material Type, 2023 to 2033

Figure 50: Latin America Market Value (US$ Million) by Packaging Type, 2023 to 2033

Figure 51: Latin America Market Value (US$ Million) by End-use, 2023 to 2033

Figure 52: Latin America Market Value (US$ Million) by Country, 2023 to 2033

Figure 53: Latin America Market Value (US$ Million) Analysis by Country, 2018 to 2033

Figure 54: Latin America Market Volume (Tonnes) Analysis by Country, 2018 to 2033

Figure 55: Latin America Market Value Share (%) and BPS Analysis by Country, 2023 to 2033

Figure 56: Latin America Market Y-o-Y Growth (%) Projections by Country, 2023 to 2033

Figure 57: Latin America Market Value (US$ Million) Analysis by Material Type, 2018 to 2033

Figure 58: Latin America Market Volume (Tonnes) Analysis by Material Type, 2018 to 2033

Figure 59: Latin America Market Value Share (%) and BPS Analysis by Material Type, 2023 to 2033

Figure 60: Latin America Market Y-o-Y Growth (%) Projections by Material Type, 2023 to 2033

Figure 61: Latin America Market Value (US$ Million) Analysis by Packaging Type, 2018 to 2033

Figure 62: Latin America Market Volume (Tonnes) Analysis by Packaging Type, 2018 to 2033

Figure 63: Latin America Market Value Share (%) and BPS Analysis by Packaging Type, 2023 to 2033

Figure 64: Latin America Market Y-o-Y Growth (%) Projections by Packaging Type, 2023 to 2033

Figure 65: Latin America Market Value (US$ Million) Analysis by End-use, 2018 to 2033

Figure 66: Latin America Market Volume (Tonnes) Analysis by End-use, 2018 to 2033

Figure 67: Latin America Market Value Share (%) and BPS Analysis by End-use, 2023 to 2033

Figure 68: Latin America Market Y-o-Y Growth (%) Projections by End-use, 2023 to 2033

Figure 69: Latin America Market Attractiveness by Material Type, 2023 to 2033

Figure 70: Latin America Market Attractiveness by Packaging Type, 2023 to 2033

Figure 71: Latin America Market Attractiveness by End-use, 2023 to 2033

Figure 72: Latin America Market Attractiveness by Country, 2023 to 2033

Figure 73: Europe Market Value (US$ Million) by Material Type, 2023 to 2033

Figure 74: Europe Market Value (US$ Million) by Packaging Type, 2023 to 2033

Figure 75: Europe Market Value (US$ Million) by End-use, 2023 to 2033

Figure 76: Europe Market Value (US$ Million) by Country, 2023 to 2033

Figure 77: Europe Market Value (US$ Million) Analysis by Country, 2018 to 2033

Figure 78: Europe Market Volume (Tonnes) Analysis by Country, 2018 to 2033

Figure 79: Europe Market Value Share (%) and BPS Analysis by Country, 2023 to 2033

Figure 80: Europe Market Y-o-Y Growth (%) Projections by Country, 2023 to 2033

Figure 81: Europe Market Value (US$ Million) Analysis by Material Type, 2018 to 2033

Figure 82: Europe Market Volume (Tonnes) Analysis by Material Type, 2018 to 2033

Figure 83: Europe Market Value Share (%) and BPS Analysis by Material Type, 2023 to 2033

Figure 84: Europe Market Y-o-Y Growth (%) Projections by Material Type, 2023 to 2033

Figure 85: Europe Market Value (US$ Million) Analysis by Packaging Type, 2018 to 2033

Figure 86: Europe Market Volume (Tonnes) Analysis by Packaging Type, 2018 to 2033

Figure 87: Europe Market Value Share (%) and BPS Analysis by Packaging Type, 2023 to 2033

Figure 88: Europe Market Y-o-Y Growth (%) Projections by Packaging Type, 2023 to 2033

Figure 89: Europe Market Value (US$ Million) Analysis by End-use, 2018 to 2033

Figure 90: Europe Market Volume (Tonnes) Analysis by End-use, 2018 to 2033

Figure 91: Europe Market Value Share (%) and BPS Analysis by End-use, 2023 to 2033

Figure 92: Europe Market Y-o-Y Growth (%) Projections by End-use, 2023 to 2033

Figure 93: Europe Market Attractiveness by Material Type, 2023 to 2033

Figure 94: Europe Market Attractiveness by Packaging Type, 2023 to 2033

Figure 95: Europe Market Attractiveness by End-use, 2023 to 2033

Figure 96: Europe Market Attractiveness by Country, 2023 to 2033

Figure 97: Asia Pacific Market Value (US$ Million) by Material Type, 2023 to 2033

Figure 98: Asia Pacific Market Value (US$ Million) by Packaging Type, 2023 to 2033

Figure 99: Asia Pacific Market Value (US$ Million) by End-use, 2023 to 2033

Figure 100: Asia Pacific Market Value (US$ Million) by Country, 2023 to 2033

Figure 101: Asia Pacific Market Value (US$ Million) Analysis by Country, 2018 to 2033

Figure 102: Asia Pacific Market Volume (Tonnes) Analysis by Country, 2018 to 2033

Figure 103: Asia Pacific Market Value Share (%) and BPS Analysis by Country, 2023 to 2033

Figure 104: Asia Pacific Market Y-o-Y Growth (%) Projections by Country, 2023 to 2033

Figure 105: Asia Pacific Market Value (US$ Million) Analysis by Material Type, 2018 to 2033

Figure 106: Asia Pacific Market Volume (Tonnes) Analysis by Material Type, 2018 to 2033

Figure 107: Asia Pacific Market Value Share (%) and BPS Analysis by Material Type, 2023 to 2033

Figure 108: Asia Pacific Market Y-o-Y Growth (%) Projections by Material Type, 2023 to 2033

Figure 109: Asia Pacific Market Value (US$ Million) Analysis by Packaging Type, 2018 to 2033

Figure 110: Asia Pacific Market Volume (Tonnes) Analysis by Packaging Type, 2018 to 2033

Figure 111: Asia Pacific Market Value Share (%) and BPS Analysis by Packaging Type, 2023 to 2033

Figure 112: Asia Pacific Market Y-o-Y Growth (%) Projections by Packaging Type, 2023 to 2033

Figure 113: Asia Pacific Market Value (US$ Million) Analysis by End-use, 2018 to 2033

Figure 114: Asia Pacific Market Volume (Tonnes) Analysis by End-use, 2018 to 2033

Figure 115: Asia Pacific Market Value Share (%) and BPS Analysis by End-use, 2023 to 2033

Figure 116: Asia Pacific Market Y-o-Y Growth (%) Projections by End-use, 2023 to 2033

Figure 117: Asia Pacific Market Attractiveness by Material Type, 2023 to 2033

Figure 118: Asia Pacific Market Attractiveness by Packaging Type, 2023 to 2033

Figure 119: Asia Pacific Market Attractiveness by End-use, 2023 to 2033

Figure 120: Asia Pacific Market Attractiveness by Country, 2023 to 2033

Figure 121: MEA Market Value (US$ Million) by Material Type, 2023 to 2033

Figure 122: MEA Market Value (US$ Million) by Packaging Type, 2023 to 2033

Figure 123: MEA Market Value (US$ Million) by End-use, 2023 to 2033

Figure 124: MEA Market Value (US$ Million) by Country, 2023 to 2033

Figure 125: MEA Market Value (US$ Million) Analysis by Country, 2018 to 2033

Figure 126: MEA Market Volume (Tonnes) Analysis by Country, 2018 to 2033

Figure 127: MEA Market Value Share (%) and BPS Analysis by Country, 2023 to 2033

Figure 128: MEA Market Y-o-Y Growth (%) Projections by Country, 2023 to 2033

Figure 129: MEA Market Value (US$ Million) Analysis by Material Type, 2018 to 2033

Figure 130: MEA Market Volume (Tonnes) Analysis by Material Type, 2018 to 2033

Figure 131: MEA Market Value Share (%) and BPS Analysis by Material Type, 2023 to 2033

Figure 132: MEA Market Y-o-Y Growth (%) Projections by Material Type, 2023 to 2033

Figure 133: MEA Market Value (US$ Million) Analysis by Packaging Type, 2018 to 2033

Figure 134: MEA Market Volume (Tonnes) Analysis by Packaging Type, 2018 to 2033

Figure 135: MEA Market Value Share (%) and BPS Analysis by Packaging Type, 2023 to 2033

Figure 136: MEA Market Y-o-Y Growth (%) Projections by Packaging Type, 2023 to 2033

Figure 137: MEA Market Value (US$ Million) Analysis by End-use, 2018 to 2033

Figure 138: MEA Market Volume (Tonnes) Analysis by End-use, 2018 to 2033

Figure 139: MEA Market Value Share (%) and BPS Analysis by End-use, 2023 to 2033

Figure 140: MEA Market Y-o-Y Growth (%) Projections by End-use, 2023 to 2033

Figure 141: MEA Market Attractiveness by Material Type, 2023 to 2033

Figure 142: MEA Market Attractiveness by Packaging Type, 2023 to 2033

Figure 143: MEA Market Attractiveness by End-use, 2023 to 2033

Figure 144: MEA Market Attractiveness by Country, 2023 to 2033

Frequently Asked Questions

What was the overall size of the Paper Packaging Market in 2025?

The overall market size for the Paper Packaging Market was USD 41.5 Billion in 2025.

How big is the Sustainable Paper Packaging Market expected to be in 2035?

The Paper Packaging Market is expected to reach USD 62.0 Billion in 2035.

What will drive the demand for the Paper Packaging Market during the forecast period?

The market will be driven by increasing demand from food & beverage, e-commerce, and sustainable retail packaging industries. Innovations in water-resistant coatings, AI-driven material optimization, and improvements in high-performance paperboard packaging will further propel market expansion.

What are the key challenges in the Paper Packaging Market?

Key challenges include fluctuating raw material costs, the need for improved moisture resistance, and regulatory compliance with sustainable packaging initiatives. However, advancements in biodegradable coatings, AI-powered defect detection, and high-strength kraft paper innovations are addressing these concerns and supporting market growth.

Which regions are expected to dominate the Paper Packaging Market?

North America and Europe are expected to dominate due to stringent environmental regulations, increased consumer preference for eco-friendly packaging, and investments in paper recycling infrastructure. Meanwhile, Asia-Pacific is experiencing rapid growth driven by expanding e-commerce, rising disposable incomes, and increased demand for sustainable consumer goods packaging.

Explore Paper Packaging Insights

Future Market Insights

Paper Packaging Market