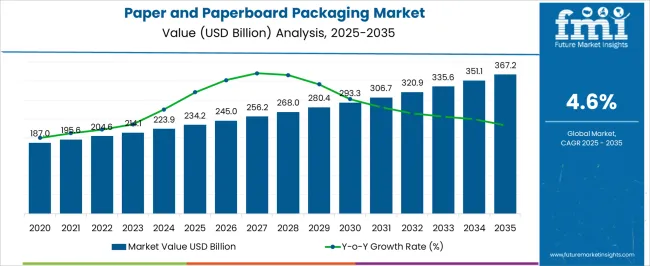
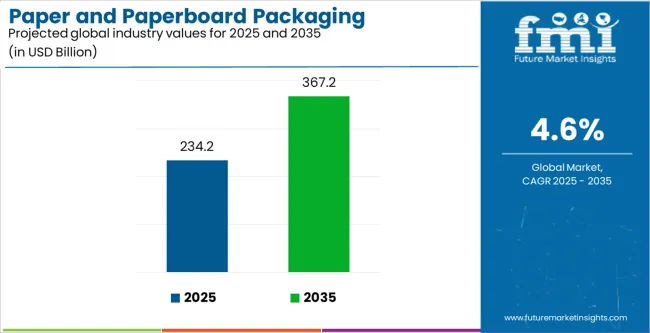
The Paper and Paperboard Packaging Market is estimated to be valued at USD 234.2 billion in 2025 and is projected to reach USD 367.2 billion by 2035, registering a compound annual growth rate (CAGR) of 4.6% over the forecast period.
The paper and paperboard packaging market is expanding rapidly due to growing environmental awareness, government regulations on plastic reduction, and rising demand for sustainable packaging solutions. The market benefits from increased consumption in food, beverage, and e-commerce industries, where lightweight and recyclable materials are prioritized.
Innovations in barrier coatings, printing technologies, and structural design have improved functionality and aesthetic appeal, broadening application across sectors. The transition toward circular economy practices and brand commitments to eco-friendly packaging have further fueled market expansion.
With increasing global pressure to minimize plastic waste, paper and paperboard packaging continues to emerge as a key alternative, offering both environmental and commercial advantages.
| Metric | Value |
|---|---|
| Paper and Paperboard Packaging Market Estimated Value in (2025 E) | USD 234.2 billion |
| Paper and Paperboard Packaging Market Forecast Value in (2035 F) | USD 367.2 billion |
| Forecast CAGR (2025 to 2035) | 4.6% |
The market is segmented by Type and Grade and region. By Type, the market is divided into Corrugated Boxes, Boxboard, and Paper Bag. In terms of Grade, the market is classified into Folding Boxboard, Solid Bleached Sulfate, White Line Chipboard, Coated Unbleached Kraft Board, and Others. Regionally, the market is classified into North America, Latin America, Western Europe, Eastern Europe, Balkan & Baltic Countries, Russia & Belarus, Central Asia, East Asia, South Asia & Pacific, and the Middle East & Africa.
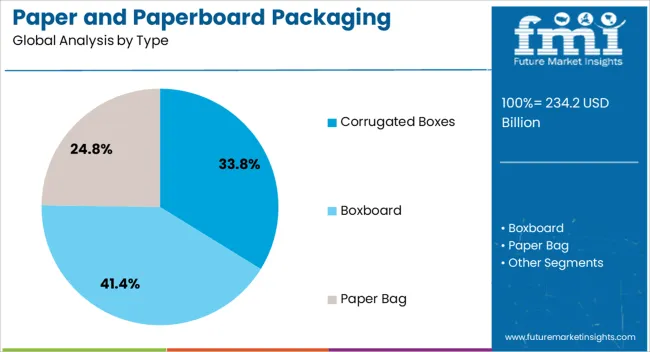
The corrugated boxes segment dominates the type category, holding approximately 33.80% share, supported by surging demand in e-commerce, logistics, and retail distribution. Their durability, cost-effectiveness, and recyclability make them a preferred solution for product transportation and storage.
Growing online retail activity has significantly boosted consumption of corrugated boxes worldwide. Manufacturers are investing in lightweight yet high-strength designs to optimize material use and reduce carbon footprint.
With continued expansion in global trade and e-commerce logistics, the corrugated boxes segment is expected to sustain its leading market share.
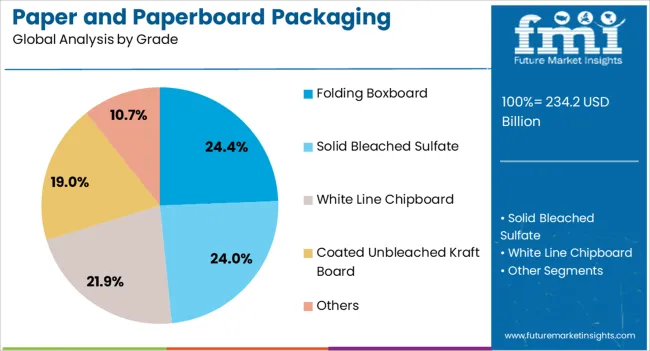
The folding boxboard segment accounts for approximately 24.40% share in the grade category, favored for its superior printability, stiffness, and smooth surface finish. Widely used in cosmetics, pharmaceuticals, and premium food packaging, folding boxboard supports brand differentiation through high-quality printing and visual appeal.
Sustainability initiatives have also accelerated adoption, as the material is renewable and easily recyclable. Technological advances in multilayer board production have enhanced barrier protection and strength, further extending its usability.
With growing consumer preference for environmentally responsible packaging and premium presentation, the folding boxboard segment is projected to maintain consistent growth.
The scope for global paper and paperboard packaging market insights expanded at a 5.8% CAGR between 2020 and 2025. The market is anticipated to develop at a CAGR of 4.6% over the forecast period from 2025 to 2035.
| Historical CAGR from 2020 to 2025 | 5.8% |
|---|---|
| Forecasted CAGR from 2025 to 2035 | 4.6% |
Between 2020 and 2025, the global market demonstrated significant expansion, marked by a CAGR of 5.8%. This growth was attributed to increased demand for sustainable packaging solutions across various industries. During this period, the market's robust performance reflected a heightened focus on eco-friendly materials and recyclable packaging.
The forecast for the subsequent period from 2025 to 2035 indicates a slightly moderated growth trajectory, with an anticipated CAGR of 4.6%. This adjustment reflects factors such as evolving market dynamics, changing consumer preferences, and potential challenges in the global economic landscape.
The market expansion from 2020 to 2025 was driven by a surge in awareness regarding environmental sustainability, prompting a shift towards paper and paperboard packaging. In the forecast period, while the demand for sustainable solutions remains strong, the projected CAGR of 4.6% suggests a more measured pace of growth.
Factors such as market maturity, regulatory influences, and evolving industry trends likely contribute to this adjusted growth rate, emphasizing the need for industry players to navigate a landscape influenced by continuity and change.
| Attributes | Details |
|---|---|
| Opportunities |
|
The table highlights the CAGRs of five key countries, with the United States, Japan, China, the United Kingdom, and South Korea leading the forefront. South Korea stands out as a dynamic market, poised for substantial growth, with an impressive 6.6% CAGR expected by 2035.
Renowned for its dedication to innovation, the country plays a pivotal role across diverse industries, showcasing a thriving economic landscape in continuous evolution.
The noteworthy CAGR emphasizes South Korea's proactive approach to adopting and spearheading advancements, positioning itself as a significant contributor to the global sustainable materials industry.
| Countries | Forecast CAGRs from 2025 to 2035 |
|---|---|
| The United States | 4.9% |
| Japan | 5.1% |
| China | 5.3% |
| The United Kingdom | 5% |
| South Korea | 6.6% |
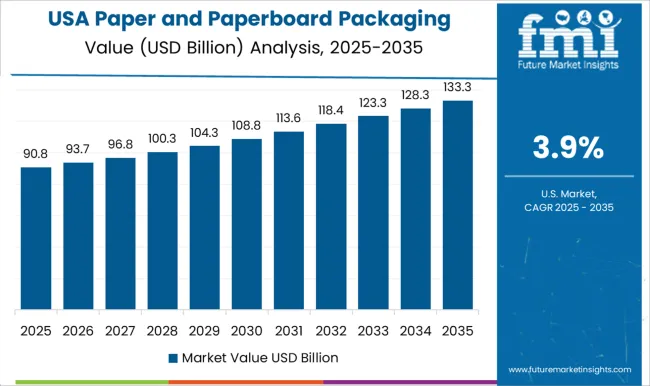
The diverse consumer-oriented market drives the extensive use of paper and paperboard packaging in the United States.
Packaging is widely employed in food and beverage, retail, and e-commerce, leveraging its eco-friendly nature and versatility. The emphasis on sustainable practices and recyclability aligns with consumer preferences, contributing to the continued market utilization.
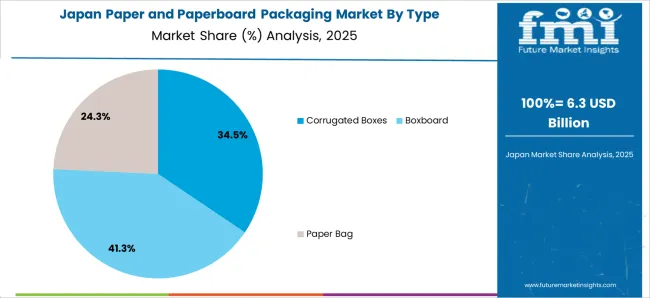
In Japan, the preference for paper and paperboard packaging is rooted in its reliability and adaptability. Packaging is extensively used in the meticulous manufacturing processes, particularly in the pharmaceutical and electronics industries. The commitment to precision and quality aligns with paper and paperboard packaging characteristics, making it a staple for various applications.
The widespread adoption of paper and paperboard packaging in China is fueled by rapid industrialization and an expanding consumer market. Due to the booming online retail industry, packaging is extensively utilized in the food and beverage sector and e-commerce packaging.
The versatility, cost-effectiveness, and recyclability of paper and paperboard packaging contribute to its prominence in China.
In the United Kingdom, paper and paperboard packaging is ingrained due to the commitment to sustainability. Widely employed in the retail and food industries, the packaging aligns with the focus on reducing environmental impact.
The demand for eco-friendly and recyclable materials drive the market prevalence in various packaging applications.
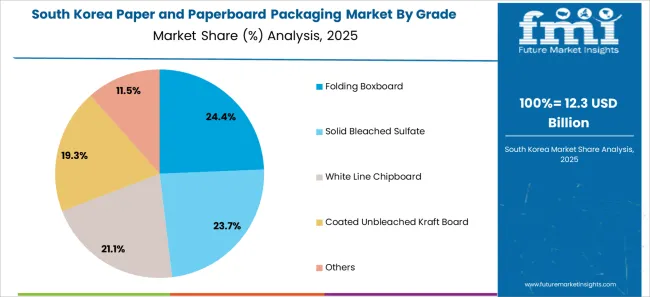
The robust adoption of paper and paperboard packaging indicates its dynamic economic landscape and commitment to innovation. The packaging is extensively used across diverse industries, including electronics, cosmetics, and retail.
The emphasis on cutting-edge technology and sustainable solutions aligns with the characteristics of paper and paperboard packaging, driving its substantial usage in the market.
The table below provides an overview of the paper and paperboard packaging landscape on the basis of type and grade. Corrugated boxes are projected to lead the type of market at a 4.5% CAGR by 2035 while folding boxboards in the grade category are likely to expand at a CAGR of 4.4% by 2035.
The widespread adoption of corrugated boxes is driven by their inherent strength and durability. The driver for the growth of folding boxboards lies in their versatility and printability. Folding boxboards offer a high-quality surface that allows for intricate printing and branding, making them ideal for packaging applications where visual appeal is crucial.
| Category | CAGR by 2035 |
|---|---|
| Corrugated Boxes | 4.5% |
| Folding Boxboard | 4.4% |
Corrugated boxes are anticipated to lead in the type category, demonstrating a projected CAGR of 4.5% by 2035. This leadership can be attributed to the widespread use of corrugated boxes across various industries, driven by their durability and suitability for shipping and transportation.
In the grade category, folding boxboards are poised for significant growth, with an estimated CAGR of 4.4% by 2035. This projection highlights the increasing demand for high-quality packaging solutions, especially in industries like cosmetics and food, where folding boxboards find extensive use due to their strength and printability.
The anticipated growth in corrugated boxes and folding boxboards underscores their crucial roles in the evolving landscape of paper and paperboard packaging.
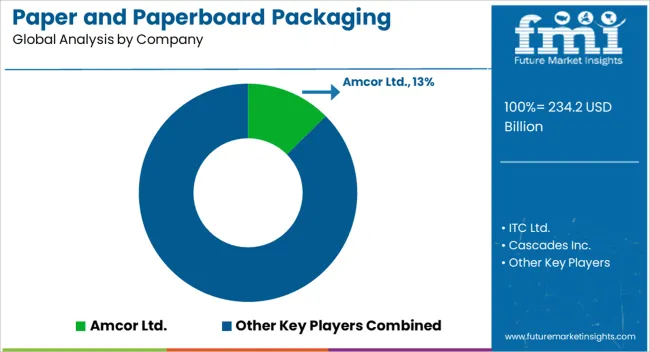
The competitive landscape of the paper and paperboard packaging industry is characterized by the presence of key players engaged in intense market competition. Major companies within this landscape strategically position themselves to address the growing demand for sustainable packaging solutions.
These industry participants focus on product innovation, ensuring a diverse range of packaging solutions to meet the needs of various sectors such as food and beverage, pharmaceuticals, and e-commerce.
Strategic collaborations and partnerships are common within the competitive dynamics, enabling companies to leverage shared resources and enhance their market presence. Mergers and acquisitions contribute to the consolidation of market players, allowing for increased efficiency and a broader product portfolio.
Key Market Developments
| Attributes | Details |
|---|---|
| Estimated Market Size in 2025 | USD 223.9 billion |
| Projected Market Valuation in 2035 | USD 351 billion |
| CAGR Share from 2025 to 2035 | 4.6% |
| Forecast Period | 2025 to 2035 |
| Historical Data Available for | 2020 to 2025 |
| Market Analysis | Value in USD billion |
| Key Regions Covered | North America; Latin America; Western Europe; Eastern Europe; South Asia and Pacific; East Asia; Middle East and Africa |
| Key Market Segments Covered | By Type, By Grade, By Region |
| Key Countries Profiled | The United States, Canada, Brazil, Mexico, Argentina, Germany, United Kingdom, France, Spain, Italy, Poland, Russia, Czech Republic, Romania, India, Bangladesh, Australia, New Zealand, China, Japan, South Korea, GCC Countries, South Africa, Israel |
| Key Companies Profiled | Amcor Ltd.; ITC Ltd.; Cascades Inc.; RockTenn Company; Clearwater Paper Corporation; Packaging Corporation of America; DS Smith Plc.; Mondi Group; Metsa Group; Nippon Paper Industries Co., Ltd; Georgia-Pacific LLC |
The global paper and paperboard packaging market is estimated to be valued at USD 234.2 billion in 2025.
The market size for the paper and paperboard packaging market is projected to reach USD 367.2 billion by 2035.
The paper and paperboard packaging market is expected to grow at a 4.6% CAGR between 2025 and 2035.
The key product types in paper and paperboard packaging market are corrugated boxes, boxboard and paper bag.
In terms of grade, folding boxboard segment to command 24.4% share in the paper and paperboard packaging market in 2025.


Our Research Products

The "Full Research Suite" delivers actionable market intel, deep dives on markets or technologies, so clients act faster, cut risk, and unlock growth.

The Leaderboard benchmarks and ranks top vendors, classifying them as Established Leaders, Leading Challengers, or Disruptors & Challengers.

Locates where complements amplify value and substitutes erode it, forecasting net impact by horizon

We deliver granular, decision-grade intel: market sizing, 5-year forecasts, pricing, adoption, usage, revenue, and operational KPIs—plus competitor tracking, regulation, and value chains—across 60 countries broadly.

Spot the shifts before they hit your P&L. We track inflection points, adoption curves, pricing moves, and ecosystem plays to show where demand is heading, why it is changing, and what to do next across high-growth markets and disruptive tech

Real-time reads of user behavior. We track shifting priorities, perceptions of today’s and next-gen services, and provider experience, then pace how fast tech moves from trial to adoption, blending buyer, consumer, and channel inputs with social signals (#WhySwitch, #UX).

Partner with our analyst team to build a custom report designed around your business priorities. From analysing market trends to assessing competitors or crafting bespoke datasets, we tailor insights to your needs.
Supplier Intelligence
Discovery & Profiling
Capacity & Footprint
Performance & Risk
Compliance & Governance
Commercial Readiness
Who Supplies Whom
Scorecards & Shortlists
Playbooks & Docs
Category Intelligence
Definition & Scope
Demand & Use Cases
Cost Drivers
Market Structure
Supply Chain Map
Trade & Policy
Operating Norms
Deliverables
Buyer Intelligence
Account Basics
Spend & Scope
Procurement Model
Vendor Requirements
Terms & Policies
Entry Strategy
Pain Points & Triggers
Outputs
Pricing Analysis
Benchmarks
Trends
Should-Cost
Indexation
Landed Cost
Commercial Terms
Deliverables
Brand Analysis
Positioning & Value Prop
Share & Presence
Customer Evidence
Go-to-Market
Digital & Reputation
Compliance & Trust
KPIs & Gaps
Outputs
Full Research Suite comprises of:
Market outlook & trends analysis
Interviews & case studies
Strategic recommendations
Vendor profiles & capabilities analysis
5-year forecasts
8 regions and 60+ country-level data splits
Market segment data splits
12 months of continuous data updates
DELIVERED AS:
PDF EXCEL ONLINE
Paperboard Packaging Market Size and Share Forecast Outlook 2025 to 2035
Aseptic Packaging Paperboard Market Size and Share Forecast Outlook 2025 to 2035
Paperboard Partition Market Size and Share Forecast Outlook 2025 to 2035
Paperboard Mailer Market Growth - Demand & Forecast 2025 to 2035
Paperboard Tray Market Growth - Trends & Forecast 2025 to 2035
Paperboard Jar Market Analysis – Size, Demand & Forecast 2024-2034
Paperboard Jewellery Box Market Growth & Trends Forecast 2024-2034
Paperboard Clamshell Boxes Market
Paperboard Bowl Market
Paper Packaging Tapes Market Size and Share Forecast Outlook 2025 to 2035
Paper Paperboard Wood Recycling Market Size and Share Forecast Outlook 2025 to 2035
Paper Packaging Market Size, Share & Forecast 2025 to 2035
Market Share Breakdown of Paper Packaging Industry
Push-up Paperboard Tube Market Size and Share Forecast Outlook 2025 to 2035
Industry Share & Competitive Positioning in Push-up Paperboard Tube Market
Folding Paperboard Boxes Market
Waxed Paper Packaging Market
coated-paper-packaging-box-market-market-value-analysis
Recycled Paper Packaging Market Size and Share Forecast Outlook 2025 to 2035
Flowpack Paper Packaging Market

Thank you!
You will receive an email from our Business Development Manager. Please be sure to check your SPAM/JUNK folder too.
Chat With
MaRIA