Reports

- Global Locations -

Headquarters

Future Market Insights, Inc.

Christiana Corporate, 200
Continental Drive, Suite 401,
Newark, Delaware - 19713,
United States

T: +1-845-579-5705

Americas

Future Market Insights, Inc.

616 Corporate Way, Suite 2-9018,
Valley Cottage, NY 10989, United States

T: +1-347-918-3531

MEA

Future Market Insights

1602-6 Jumeirah Bay X2 Tower, Plot No: JLT-PH2-X2A,
Jumeirah Lakes Towers, Dubai,
United Arab Emirates

Europe

Future Market Insights

3rd Floor, 207 Regent Street,
W1B 3HH London
United Kingdom

T: + 44 (0) 20 8123 9659
D: +44 (0) 20 3287 4268

Asia Pacific

Future Market Insights

IndiaLand Global Tech Park, Unit UG-1, Behind Grand HighStreet, Phase 1, Hinjawadi, MH, Pune – 411057, India

Paper Release Liners Market Snapshot (2023 to 2033)

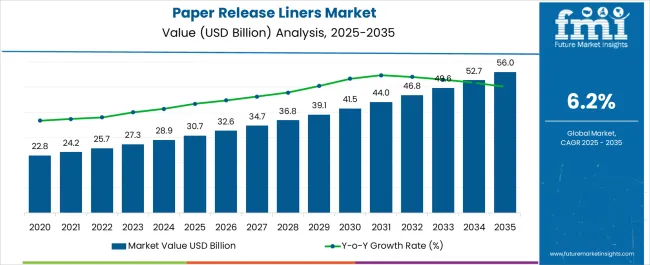
The global paper release liners market size is expected to be valued at US$ 27.1 billion in 2023. Integration with automation, bolsters the overall scope for paper release liners market, which is projected to grow at a CAGR of 6.5% between 2023 and 2033, totaling around US$ 50.9 billion by 2033.

Data Points Key Statistics
Paper Release Liners Market Value 2023 US$ 27.1 billion
Paper Release Liners Market Projected Value (2033) US$ 50.9 billion
Paper Release Liners Market CAGR (2023 to 2033) 6.5%

The trend toward sustainable packaging solutions has gained significant momentum in recent years, driven by consumer demand for environmentally friendly products and increased awareness of the environmental impact of packaging materials. Paper release liners, with their biodegradability and recyclability, are emerging as a key component of sustainable packaging strategies for brands and industries worldwide.

Paper release liners are made from natural materials, primarily paper fibers derived from sustainable sources such as certified forests or recycled paper. The liners are designed to break down naturally over time, avoiding the accumulation of non-biodegradable waste in landfills. They have a reduced environmental impact, as a result, compared to non-biodegradable alternatives, contributing to a more circular and eco-friendly packaging lifecycle.

Paper release liners can be easily recycled along with other paper-based materials, creating opportunities for closed-loop recycling systems. Recycled paper fibers can be used to produce new paper products, reducing the demand for virgin materials and conserving natural resources. Brands and manufacturers that incorporate paper release liners into their packaging designs contribute to the promotion of a circular economy by supporting recycling infrastructure.

Sustainable packaging has become an important factor influencing consumer purchasing decisions. Brands that adopt eco-friendly packaging materials like paper release liners can enhance their brand image by demonstrating a commitment to environmental responsibility, which can attract environmentally conscious consumers and foster brand loyalty among those who prioritize sustainability.

Don't pay for what you don't need

Customize your report by selecting specific countries or regions and save 30%!

Global Paper Release Liners Market Historical Analysis (2018 To 2022) Vs. Forecast Outlook (2023 To 2033)

The global demand for paper release liners increased at a CAGR of 3.1% during the forecast period between 2018 and 2022, reaching a total of US$ 50.9 billion in 2033.

According to Future Market Insights, a market research and competitive intelligence provider, the paper release liners market was valued at US$ 25.5 billion in 2022.

The rapid expansion of e-commerce has brought about significant changes in the way products are packaged, shipped, and received by consumers. In this evolving landscape, the role of packaging materials, including paper release liners, has become increasingly crucial in ensuring that products are well-protected, visually appealing, and capable of providing a positive unboxing experience for customers.

One of the challenges in e-commerce packaging is preventing adhesive labels, such as shipping labels or barcodes, from adhering to the actual product or its packaging. Paper release liners play a vital role in acting as a barrier between adhesive labels and the product itself. The liners have a special coating that prevents labels from sticking directly to the product or the package, thereby maintaining the product's integrity and aesthetics.

The unboxing experience is a critical touchpoint in the customer journey, especially for e-commerce customers who may not have the opportunity to physically interact with products before purchase. Paper release liners ensure that when customers receive their orders and open the packages, they can do so without any frustration or difficulty caused by labels sticking to the product. The seamless unboxing experience enhances customer satisfaction and contributes to positive brand perception.

In the digital age, where social media and online reviews can quickly amplify customer experiences, brands are increasingly focused on delivering memorable and share-worthy unboxing moments. Packaging that is easy to open, visually appealing, and free from adhesive label residue contributes to a positive and memorable unboxing experience, enhancing the brand's image and fostering customer loyalty.

Factors Driving the Market for Paper Release Liners

Innovation in Labelling Technology is Likely to be Beneficial for Market Growth

In recent years, the field of labeling technology has experienced significant innovation, driven by the need for more efficient, sustainable, and cost-effective packaging solutions. The innovations have led to the development of thinner and more efficient release liners, which play a critical role in optimizing the labeling process, improving product performance, and reducing environmental impact.

Innovations in materials science and manufacturing processes have enabled the creation of thinner yet highly functional release liners. The advanced materials offer the same or even improved performance compared to traditional thicker liners. Thinner release liners retain their ability to prevent labels from sticking to the product, ensuring smooth label application and a seamless unboxing experience for consumers.

Thinner release liners are easier to handle and apply during the labeling process. Their reduced thickness allows for more precise and consistent label placement on products, resulting in a higher efficiency rate during labeling operations. The improved efficiency contributes to increased productivity in manufacturing and packaging facilities, ultimately reducing labor costs and production time.

Thinner release liners require fewer raw materials for production, resulting in reduced material usage and waste generation, which is particularly significant in the context of sustainability and environmental responsibility. Manufacturers, by using less material, can minimize their ecological footprint and contribute to the reduction of waste in landfills.

Shift to Digital Printing to Fuel the Market Growth

The advent of digital printing has significantly transformed the landscape of label production and packaging customization. The technological revolution has not only streamlined the label manufacturing process but also opened up a realm of possibilities for brands seeking highly customized, vibrant, and short-run label solutions. Paper release liners, in particular, have seamlessly integrated into this digital printing ecosystem, offering a range of benefits that cater to the evolving needs of modern packaging and labeling requirements.

Digital printing allows brands to create labels that are uniquely tailored to their products, promotions, or even individual consumers. The level of customization can include variable data printing, such as QR codes, barcodes, serialization, and personalized messages. Paper release liners enable this degree of flexibility by providing a stable and reliable substrate that interacts seamlessly with digital printing technologies.

Traditional printing methods often entail longer setup times and higher costs for short print runs. Digital printing eliminates these barriers, enabling on-demand label production with rapid turnaround times. Paper release liners complement this feature by accommodating the quick and efficient printing of labels for small batches, limited-time promotions, seasonal offerings, and special events.

Digital printing eliminates the need for expensive plates or cylinders required in conventional printing methods. The cost-saving advantage is particularly beneficial for small and medium-sized businesses that may have budget constraints. Paper release liners contribute to the overall cost-effectiveness of digital printing by providing a reliable and economical substrate.

Ismail Sutaria
Ismail Sutaria

Principal Consultant

Talk to Analyst

Find your sweet spots for generating winning opportunities in this market.

Category-wise Insights

Silicone-Coated Paper to Take the Lion’s Share

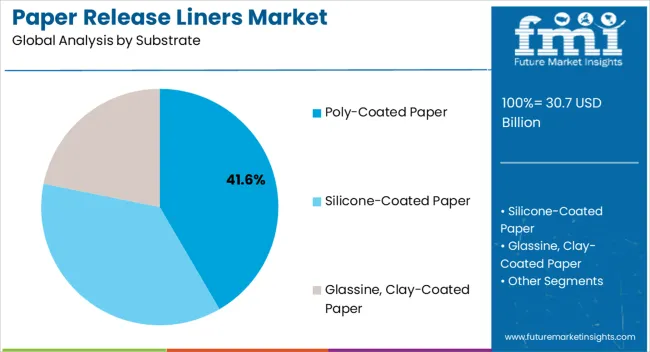
By substrate, silicone-coated paper segment is estimated to be the leading segment at a CAGR of 6.4% during the forecast period.

Silicone-coated paper release liners are highly versatile and find applications in various industries such as labels, tapes, medical products, graphic arts, and industrial applications. Their ability to provide a consistent and controlled release of adhesives makes them a preferred choice for many packaging and labeling needs.

The label industry is a significant driver of the silicone-coated paper release liners market. The demand for high-quality and reliable release liners is on the rise, as labels continue to play a crucial role in branding, information dissemination, and consumer engagement. Silicone-coated paper meets these requirements by ensuring easy label release, even for intricate and detailed designs.

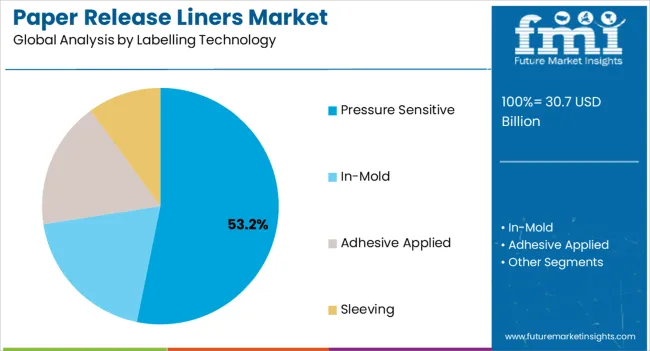
Pressure-sensitive adhesives (PSAs) are widely used in various industries due to their convenience and ease of use. Silicone-coated paper release liners are essential components in PSA applications as they allow for efficient and consistent release of adhesives, making them indispensable for industries like packaging, medical devices, automotive, and more.

The growth of e-commerce and online retail has led to increased demand for packaging materials, including labels and tapes. Silicone-coated paper release liners play a critical role in ensuring that labels and tapes can be easily applied and removed without any residue, enhancing the consumer experience.

Labels to be the Most Lucrative End Use Segment

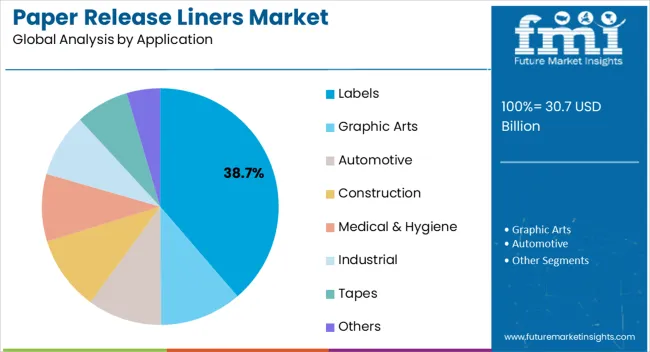
By application, labels segment is estimated to be the leading segment at a CAGR of 6.4% during the forecast period.

The labeling industry is a significant driver of the paper release liners market, with labels being used extensively in various sectors such as consumer goods, pharmaceuticals, food and beverages, and logistics. The increasing demand for product identification, branding, and information dissemination is fueling the need for high-quality release liners to ensure smooth label application.

The consumer goods sector relies heavily on labels for product differentiation, information communication, and branding. Labels play a critical role in attracting consumers and providing essential details, whether it's food packaging, personal care products, household items, or electronics. Paper release liners are essential components in label production to ensure precise and residue-free application.

The booming e-commerce industry has led to an uptick in demand for labels used in shipping, logistics, and packaging. Labels help in tracking and identifying packages, ensuring efficient handling and delivery. The demand for labels and, consequently, paper release liners is on the rise, as e-commerce continues to expand globally.

In the pharmaceutical and healthcare sectors, labels are crucial for accurately conveying dosage instructions, safety information, and regulatory compliance. Paper release liners facilitate the precise application of these critical labels on various medical products, ensuring readability and adherence to industry standards.

Region-wise Insights

Rising Demand for Packaged Food to Uplift the Sales of Paper Release Liners in Asia Pacific Excluding Japan

As per FMI, Asia Pacific excluding Japan is estimated to continue dominating the global paper release liners during the forecast period 2023 to 2033

The demand for packaged and ready-to-eat food products is rapidly surging, with increasing working population and surging trend of single living across the Asia Pacific. Increasing availability of ready-to-cook packed and rising consumption of thermoformed container packed fresh products such as fruits and vegetables are augmenting the demand for labels and food quality stickers, which is, in turn, bolstering the sales of paper release liners in the market.

Automotive vehicle manufacturers are increasingly inclining toward using automotive adhesive tapes from conventional mechanical fasteners to cut down the production time, and costs, and reduce automobile weight. Accelerating demand for light-weight and fuel-efficient automotive vehicles, due to the growing fuel price, is anticipated to favor the paper release liners sales in the Asia Pacific excluding Japan market. The region is expected to hold a CAGR of 6.4% over the analysis period.
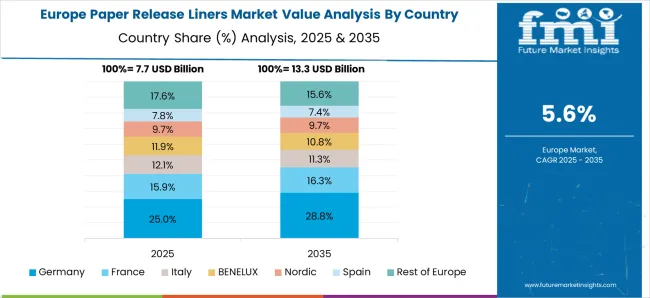
Increasing Applications from Various Industries to Increase Paper Release Liners Sales in Western Europe

Future Market Insights reveals that Western Europe is projected to account for a significant share in the global paper release liners market between 2022 and 2032.

Demand for labels, tapes, and stickers is increasing at a rapid pace, owing to the increasing application across various industries such as medical, pharmaceuticals, personal care & cosmetics, construction, and automobiles among others, which, in addition to the ban on toxic plastics films such as PVC film across the European Union countries, is creating strong demand for paper release liners.

Leading players in the global market are emphasizing on launches novel products to cater to this increasing demand. For instance, in 2021, Mondi, a multinational packaging and paper group based in the United Kingdom announced introducing a new range of sustainable paper-based release liners, EverLiner, comprising liners manufactured from light-weight solutions and recycled paper. A slew of such new product launches is expected to elevate the sales paper release liners in the Western Europe market. The region is expected to hold a CAGR of 6.3% over the analysis period.
Get the data you need at a Fraction of the cost

Personalize your report by choosing insights you need
and save 40%!

Competitive Landscape

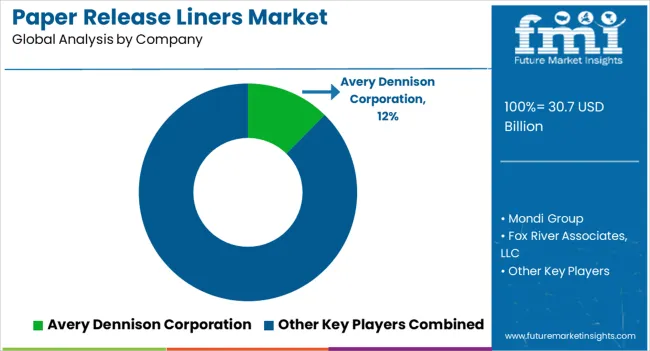
Key players in the paper release liners market are strongly focusing on profit generation from their existing product portfolios along while exploring potential new applications. The players are emphasizing on increasing their paper release liners production capacities, to cater to the demand from numerous end use industries. Prominent players are also pushing for geographical expansion to decrease the dependency on imported paper release liners.

Recent Developments

  • In 2022, Essentra Tapes launched EasiLiner, a new line of paper-based release liners for e-commerce packaging.
  • In 2022, Mondi switched its entire portfolio of glassine-based release liners to certified base paper.
  • In 2021, 3M launched Hi-Tack Silicon adhesive, a new release liner adhesive that provides superior performance in demanding applications.

Scope of the Report

Attribute Details
Forecast Period 2023 to 2033
Historical Data Available for 2018 to 2022
Market Analysis USD Billion for value and Tons for Volume
Key Regions Covered North America, Latin America, Western Europe, Eastern Europe, South Asia & Pacific, East Asia, and Middle East & Africa
Key Countries Covered United States, Canada, Brazil, Mexico, Germany, United Kingdom, France, Spain, Italy, Poland, Russia, Czech Republic, Romania, India, Bangladesh, Australia, New Zealand, China, Japan, South Korea, GCC Countries, South Africa, Israel.
Key Segments Covered Substrate, Labelling Technology, Application, and Region
Key Companies Profiled
  • Avery Dennison Corporation
  • Mondi Group
  • Fox River Associates, LLC
  • 3M
  • Loparex Holding B.V.
  • Gascogne Group
  • UPM
  • Rayven Inc.
  • Quanjiao Guangtai Adhesive Products Co. Ltd.
  • Elkem Silicones
Report Coverage Market Forecast, brand share analysis, competition intelligence, DROT analysis, Market Dynamics and Challenges, Strategic Growth Initiatives
Customization & Pricing Available upon Request

Key Segments Profiled In The Global Paper Release Liners Market

By Substrate:

  • Poly-coated Paper
  • Silicone-coated Paper
  • Glassine, Clay-coated Paper

By Labelling Technology:

  • In-mold
  • Pressure Sensitive
  • Adhesive Applied
  • Sleeving

By Application:

  • Graphic Arts
  • Labels
  • Automotive
  • Construction
  • Medical & Hygiene
  • Industrial
  • Tapes
  • Others

Region:

  • North America
  • Latin America
  • Western Europe
  • Eastern Europe
  • South Asia and Pacific
  • East Asia
  • Middle East and Africa (MEA)

Frequently Asked Questions

What Drives Sales of the Paper Release Liners Market?

Innovation in labeling technology drives sales of the market.

What is the Key Trend in the Market?

Consumer demand for environment-friendly products is the key trend in the market.

What is the Growth Forecast for the Paper Release Liners Market?

The market is forecast to register a CAGR of 6.5% through 2033.

What is the Current Market Valuation?

The market is estimated to attain a valuation of US$ 27.1 billion in 2023.

What is the Key Opportunity in the market?

The shift to digital printing fuels the market growth.

Table of Content

1. Executive Summary

    1.1. Global Market Outlook

    1.2. Demand-side Trends

    1.3. Supply-side Trends

    1.4. Technology Roadmap Analysis

    1.5. Analysis and Recommendations

2. Market Overview

    2.1. Market Coverage / Taxonomy

    2.2. Market Definition / Scope / Limitations

3. Market Background

    3.1. Market Dynamics

        3.1.1. Drivers

        3.1.2. Restraints

        3.1.3. Opportunity

        3.1.4. Trends

    3.2. Scenario Forecast

        3.2.1. Demand in Optimistic Scenario

        3.2.2. Demand in Likely Scenario

        3.2.3. Demand in Conservative Scenario

    3.3. Opportunity Map Analysis

    3.4. Product Life Cycle Analysis

    3.5. Supply Chain Analysis

        3.5.1. Supply Side Participants and their Roles

            3.5.1.1. Producers

            3.5.1.2. Mid-Level Participants (Traders/ Agents/ Brokers)

            3.5.1.3. Wholesalers and Distributors

        3.5.2. Value Added and Value Created at Node in the Supply Chain

        3.5.3. List of Raw Material Suppliers

        3.5.4. List of Existing and Potential Buyer’s

    3.6. Investment Feasibility Matrix

    3.7. Value Chain Analysis

        3.7.1. Profit Margin Analysis

        3.7.2. Wholesalers and Distributors

        3.7.3. Retailers

    3.8. PESTLE and Porter’s Analysis

    3.9. Regulatory Landscape

        3.9.1. By Key Regions

        3.9.2. By Key Countries

    3.10. Regional Parent Market Outlook

    3.11. Production and Consumption Statistics

    3.12. Import and Export Statistics

4. Global Market Analysis 2018 to 2022 and Forecast, 2023 to 2033

    4.1. Historical Market Size Value (US$ Million) & Volume (Tons) Analysis, 2018 to 2022

    4.2. Current and Future Market Size Value (US$ Million) & Volume (Tons) Projections, 2023 to 2033

        4.2.1. Y-o-Y Growth Trend Analysis

        4.2.2. Absolute $ Opportunity Analysis

5. Global Market Analysis 2018 to 2022 and Forecast 2023 to 2033, By Substrate

    5.1. Introduction / Key Findings

    5.2. Historical Market Size Value (US$ Million) & Volume (Tons) Analysis By Substrate, 2018 to 2022

    5.3. Current and Future Market Size Value (US$ Million) & Volume (Tons) Analysis and Forecast By Substrate, 2023 to 2033

        5.3.1. Poly-coated Paper

        5.3.2. Silicone-coated Paper

        5.3.3. Glassine, Clay-coated Paper

    5.4. Y-o-Y Growth Trend Analysis By Substrate, 2018 to 2022

    5.5. Absolute $ Opportunity Analysis By Substrate, 2023 to 2033

6. Global Market Analysis 2018 to 2022 and Forecast 2023 to 2033, By Labelling Technology

    6.1. Introduction / Key Findings

    6.2. Historical Market Size Value (US$ Million) & Volume (Tons) Analysis By Labelling Technology, 2018 to 2022

    6.3. Current and Future Market Size Value (US$ Million) & Volume (Tons) Analysis and Forecast By Labelling Technology, 2023 to 2033

        6.3.1. In-mold

        6.3.2. Pressure Sensitive

        6.3.3. Adhesive Applied

        6.3.4. Sleeving

    6.4. Y-o-Y Growth Trend Analysis By Labelling Technology, 2018 to 2022

    6.5. Absolute $ Opportunity Analysis By Labelling Technology, 2023 to 2033

7. Global Market Analysis 2018 to 2022 and Forecast 2023 to 2033, By Application

    7.1. Introduction / Key Findings

    7.2. Historical Market Size Value (US$ Million) & Volume (Tons) Analysis By Application, 2018 to 2022

    7.3. Current and Future Market Size Value (US$ Million) & Volume (Tons) Analysis and Forecast By Application, 2023 to 2033

        7.3.1. Graphic Arts

        7.3.2. Labels

        7.3.3. Automotive

        7.3.4. Construction

        7.3.5. Medical & Hygiene

        7.3.6. Industrial

        7.3.7. Tapes

        7.3.8. Others

    7.4. Y-o-Y Growth Trend Analysis By Application, 2018 to 2022

    7.5. Absolute $ Opportunity Analysis By Application, 2023 to 2033

8. Global Market Analysis 2018 to 2022 and Forecast 2023 to 2033, By Region

    8.1. Introduction

    8.2. Historical Market Size Value (US$ Million) & Volume (Tons) Analysis By Region, 2018 to 2022

    8.3. Current Market Size Value (US$ Million) & Volume (Tons) Analysis and Forecast By Region, 2023 to 2033

        8.3.1. North America

        8.3.2. Latin America

        8.3.3. Western Europe

        8.3.4. Eastern Europe

        8.3.5. South Asia and Pacific

        8.3.6. East Asia

        8.3.7. Middle East and Africa

    8.4. Market Attractiveness Analysis By Region

9. North America Market Analysis 2018 to 2022 and Forecast 2023 to 2033, By Country

    9.1. Historical Market Size Value (US$ Million) & Volume (Tons) Trend Analysis By Market Taxonomy, 2018 to 2022

    9.2. Market Size Value (US$ Million) & Volume (Tons) Forecast By Market Taxonomy, 2023 to 2033

        9.2.1. By Country

            9.2.1.1. The USA

            9.2.1.2. Canada

        9.2.2. By Substrate

        9.2.3. By Labelling Technology

        9.2.4. By Application

    9.3. Market Attractiveness Analysis

        9.3.1. By Country

        9.3.2. By Substrate

        9.3.3. By Labelling Technology

        9.3.4. By Application

    9.4. Key Takeaways

10. Latin America Market Analysis 2018 to 2022 and Forecast 2023 to 2033, By Country

    10.1. Historical Market Size Value (US$ Million) & Volume (Tons) Trend Analysis By Market Taxonomy, 2018 to 2022

    10.2. Market Size Value (US$ Million) & Volume (Tons) Forecast By Market Taxonomy, 2023 to 2033

        10.2.1. By Country

            10.2.1.1. Brazil

            10.2.1.2. Mexico

            10.2.1.3. Rest of Latin America

        10.2.2. By Substrate

        10.2.3. By Labelling Technology

        10.2.4. By Application

    10.3. Market Attractiveness Analysis

        10.3.1. By Country

        10.3.2. By Substrate

        10.3.3. By Labelling Technology

        10.3.4. By Application

    10.4. Key Takeaways

11. Western Europe Market Analysis 2018 to 2022 and Forecast 2023 to 2033, By Country

    11.1. Historical Market Size Value (US$ Million) & Volume (Tons) Trend Analysis By Market Taxonomy, 2018 to 2022

    11.2. Market Size Value (US$ Million) & Volume (Tons) Forecast By Market Taxonomy, 2023 to 2033

        11.2.1. By Country

            11.2.1.1. Germany

            11.2.1.2. United Kingdom

            11.2.1.3. France

            11.2.1.4. Spain

            11.2.1.5. Italy

            11.2.1.6. Rest of Western Europe

        11.2.2. By Substrate

        11.2.3. By Labelling Technology

        11.2.4. By Application

    11.3. Market Attractiveness Analysis

        11.3.1. By Country

        11.3.2. By Substrate

        11.3.3. By Labelling Technology

        11.3.4. By Application

    11.4. Key Takeaways

12. Eastern Europe Market Analysis 2018 to 2022 and Forecast 2023 to 2033, By Country

    12.1. Historical Market Size Value (US$ Million) & Volume (Tons) Trend Analysis By Market Taxonomy, 2018 to 2022

    12.2. Market Size Value (US$ Million) & Volume (Tons) Forecast By Market Taxonomy, 2023 to 2033

        12.2.1. By Country

            12.2.1.1. Poland

            12.2.1.2. Russia

            12.2.1.3. Czech Republic

            12.2.1.4. Romania

            12.2.1.5. Rest of Eastern Europe

        12.2.2. By Substrate

        12.2.3. By Labelling Technology

        12.2.4. By Application

    12.3. Market Attractiveness Analysis

        12.3.1. By Country

        12.3.2. By Substrate

        12.3.3. By Labelling Technology

        12.3.4. By Application

    12.4. Key Takeaways

13. South Asia and Pacific Market Analysis 2018 to 2022 and Forecast 2023 to 2033, By Country

    13.1. Historical Market Size Value (US$ Million) & Volume (Tons) Trend Analysis By Market Taxonomy, 2018 to 2022

    13.2. Market Size Value (US$ Million) & Volume (Tons) Forecast By Market Taxonomy, 2023 to 2033

        13.2.1. By Country

            13.2.1.1. India

            13.2.1.2. Bangladesh

            13.2.1.3. Australia

            13.2.1.4. New Zealand

            13.2.1.5. Rest of South Asia and Pacific

        13.2.2. By Substrate

        13.2.3. By Labelling Technology

        13.2.4. By Application

    13.3. Market Attractiveness Analysis

        13.3.1. By Country

        13.3.2. By Substrate

        13.3.3. By Labelling Technology

        13.3.4. By Application

    13.4. Key Takeaways

14. East Asia Market Analysis 2018 to 2022 and Forecast 2023 to 2033, By Country

    14.1. Historical Market Size Value (US$ Million) & Volume (Tons) Trend Analysis By Market Taxonomy, 2018 to 2022

    14.2. Market Size Value (US$ Million) & Volume (Tons) Forecast By Market Taxonomy, 2023 to 2033

        14.2.1. By Country

            14.2.1.1. China

            14.2.1.2. Japan

            14.2.1.3. South Korea

        14.2.2. By Substrate

        14.2.3. By Labelling Technology

        14.2.4. By Application

    14.3. Market Attractiveness Analysis

        14.3.1. By Country

        14.3.2. By Substrate

        14.3.3. By Labelling Technology

        14.3.4. By Application

    14.4. Key Takeaways

15. Middle East and Africa Market Analysis 2018 to 2022 and Forecast 2023 to 2033, By Country

    15.1. Historical Market Size Value (US$ Million) & Volume (Tons) Trend Analysis By Market Taxonomy, 2018 to 2022

    15.2. Market Size Value (US$ Million) & Volume (Tons) Forecast By Market Taxonomy, 2023 to 2033

        15.2.1. By Country

            15.2.1.1. GCC Countries

            15.2.1.2. South Africa

            15.2.1.3. Israel

            15.2.1.4. Rest of MEA

        15.2.2. By Substrate

        15.2.3. By Labelling Technology

        15.2.4. By Application

    15.3. Market Attractiveness Analysis

        15.3.1. By Country

        15.3.2. By Substrate

        15.3.3. By Labelling Technology

        15.3.4. By Application

    15.4. Key Takeaways

16. Key Countries Market Analysis

    16.1. USA

        16.1.1. Pricing Analysis

        16.1.2. Market Share Analysis, 2022

            16.1.2.1. By Substrate

            16.1.2.2. By Labelling Technology

            16.1.2.3. By Application

    16.2. Canada

        16.2.1. Pricing Analysis

        16.2.2. Market Share Analysis, 2022

            16.2.2.1. By Substrate

            16.2.2.2. By Labelling Technology

            16.2.2.3. By Application

    16.3. Brazil

        16.3.1. Pricing Analysis

        16.3.2. Market Share Analysis, 2022

            16.3.2.1. By Substrate

            16.3.2.2. By Labelling Technology

            16.3.2.3. By Application

    16.4. Mexico

        16.4.1. Pricing Analysis

        16.4.2. Market Share Analysis, 2022

            16.4.2.1. By Substrate

            16.4.2.2. By Labelling Technology

            16.4.2.3. By Application

    16.5. Germany

        16.5.1. Pricing Analysis

        16.5.2. Market Share Analysis, 2022

            16.5.2.1. By Substrate

            16.5.2.2. By Labelling Technology

            16.5.2.3. By Application

    16.6. United Kingdom

        16.6.1. Pricing Analysis

        16.6.2. Market Share Analysis, 2022

            16.6.2.1. By Substrate

            16.6.2.2. By Labelling Technology

            16.6.2.3. By Application

    16.7. France

        16.7.1. Pricing Analysis

        16.7.2. Market Share Analysis, 2022

            16.7.2.1. By Substrate

            16.7.2.2. By Labelling Technology

            16.7.2.3. By Application

    16.8. Spain

        16.8.1. Pricing Analysis

        16.8.2. Market Share Analysis, 2022

            16.8.2.1. By Substrate

            16.8.2.2. By Labelling Technology

            16.8.2.3. By Application

    16.9. Italy

        16.9.1. Pricing Analysis

        16.9.2. Market Share Analysis, 2022

            16.9.2.1. By Substrate

            16.9.2.2. By Labelling Technology

            16.9.2.3. By Application

    16.10. Poland

        16.10.1. Pricing Analysis

        16.10.2. Market Share Analysis, 2022

            16.10.2.1. By Substrate

            16.10.2.2. By Labelling Technology

            16.10.2.3. By Application

    16.11. Russia

        16.11.1. Pricing Analysis

        16.11.2. Market Share Analysis, 2022

            16.11.2.1. By Substrate

            16.11.2.2. By Labelling Technology

            16.11.2.3. By Application

    16.12. Czech Republic

        16.12.1. Pricing Analysis

        16.12.2. Market Share Analysis, 2022

            16.12.2.1. By Substrate

            16.12.2.2. By Labelling Technology

            16.12.2.3. By Application

    16.13. Romania

        16.13.1. Pricing Analysis

        16.13.2. Market Share Analysis, 2022

            16.13.2.1. By Substrate

            16.13.2.2. By Labelling Technology

            16.13.2.3. By Application

    16.14. India

        16.14.1. Pricing Analysis

        16.14.2. Market Share Analysis, 2022

            16.14.2.1. By Substrate

            16.14.2.2. By Labelling Technology

            16.14.2.3. By Application

    16.15. Bangladesh

        16.15.1. Pricing Analysis

        16.15.2. Market Share Analysis, 2022

            16.15.2.1. By Substrate

            16.15.2.2. By Labelling Technology

            16.15.2.3. By Application

    16.16. Australia

        16.16.1. Pricing Analysis

        16.16.2. Market Share Analysis, 2022

            16.16.2.1. By Substrate

            16.16.2.2. By Labelling Technology

            16.16.2.3. By Application

    16.17. New Zealand

        16.17.1. Pricing Analysis

        16.17.2. Market Share Analysis, 2022

            16.17.2.1. By Substrate

            16.17.2.2. By Labelling Technology

            16.17.2.3. By Application

    16.18. China

        16.18.1. Pricing Analysis

        16.18.2. Market Share Analysis, 2022

            16.18.2.1. By Substrate

            16.18.2.2. By Labelling Technology

            16.18.2.3. By Application

    16.19. Japan

        16.19.1. Pricing Analysis

        16.19.2. Market Share Analysis, 2022

            16.19.2.1. By Substrate

            16.19.2.2. By Labelling Technology

            16.19.2.3. By Application

    16.20. South Korea

        16.20.1. Pricing Analysis

        16.20.2. Market Share Analysis, 2022

            16.20.2.1. By Substrate

            16.20.2.2. By Labelling Technology

            16.20.2.3. By Application

    16.21. GCC Countries

        16.21.1. Pricing Analysis

        16.21.2. Market Share Analysis, 2022

            16.21.2.1. By Substrate

            16.21.2.2. By Labelling Technology

            16.21.2.3. By Application

    16.22. South Africa

        16.22.1. Pricing Analysis

        16.22.2. Market Share Analysis, 2022

            16.22.2.1. By Substrate

            16.22.2.2. By Labelling Technology

            16.22.2.3. By Application

    16.23. Israel

        16.23.1. Pricing Analysis

        16.23.2. Market Share Analysis, 2022

            16.23.2.1. By Substrate

            16.23.2.2. By Labelling Technology

            16.23.2.3. By Application

17. Market Structure Analysis

    17.1. Competition Dashboard

    17.2. Competition Benchmarking

    17.3. Market Share Analysis of Top Players

        17.3.1. By Regional

        17.3.2. By Substrate

        17.3.3. By Labelling Technology

        17.3.4. By Application

18. Competition Analysis

    18.1. Competition Deep Dive

        18.1.1. Avery Dennison Corporation

            18.1.1.1. Overview

            18.1.1.2. Product Portfolio

            18.1.1.3. Profitability by Market Segments

            18.1.1.4. Sales Footprint

            18.1.1.5. Strategy Overview

                18.1.1.5.1. Marketing Strategy

                18.1.1.5.2. Product Strategy

                18.1.1.5.3. Channel Strategy

        18.1.2. Mondi Group

            18.1.2.1. Overview

            18.1.2.2. Product Portfolio

            18.1.2.3. Profitability by Market Segments

            18.1.2.4. Sales Footprint

            18.1.2.5. Strategy Overview

                18.1.2.5.1. Marketing Strategy

                18.1.2.5.2. Product Strategy

                18.1.2.5.3. Channel Strategy

        18.1.3. Fox River Associates, LLC

            18.1.3.1. Overview

            18.1.3.2. Product Portfolio

            18.1.3.3. Profitability by Market Segments

            18.1.3.4. Sales Footprint

            18.1.3.5. Strategy Overview

                18.1.3.5.1. Marketing Strategy

                18.1.3.5.2. Product Strategy

                18.1.3.5.3. Channel Strategy

        18.1.4. 3M

            18.1.4.1. Overview

            18.1.4.2. Product Portfolio

            18.1.4.3. Profitability by Market Segments

            18.1.4.4. Sales Footprint

            18.1.4.5. Strategy Overview

                18.1.4.5.1. Marketing Strategy

                18.1.4.5.2. Product Strategy

                18.1.4.5.3. Channel Strategy

        18.1.5. Loparex Holding B.V.

            18.1.5.1. Overview

            18.1.5.2. Product Portfolio

            18.1.5.3. Profitability by Market Segments

            18.1.5.4. Sales Footprint

            18.1.5.5. Strategy Overview

                18.1.5.5.1. Marketing Strategy

                18.1.5.5.2. Product Strategy

                18.1.5.5.3. Channel Strategy

        18.1.6. Gascogne Group

            18.1.6.1. Overview

            18.1.6.2. Product Portfolio

            18.1.6.3. Profitability by Market Segments

            18.1.6.4. Sales Footprint

            18.1.6.5. Strategy Overview

                18.1.6.5.1. Marketing Strategy

                18.1.6.5.2. Product Strategy

                18.1.6.5.3. Channel Strategy

        18.1.7. UPM

            18.1.7.1. Overview

            18.1.7.2. Product Portfolio

            18.1.7.3. Profitability by Market Segments

            18.1.7.4. Sales Footprint

            18.1.7.5. Strategy Overview

                18.1.7.5.1. Marketing Strategy

                18.1.7.5.2. Product Strategy

                18.1.7.5.3. Channel Strategy

        18.1.8. Rayven Inc.

            18.1.8.1. Overview

            18.1.8.2. Product Portfolio

            18.1.8.3. Profitability by Market Segments

            18.1.8.4. Sales Footprint

            18.1.8.5. Strategy Overview

                18.1.8.5.1. Marketing Strategy

                18.1.8.5.2. Product Strategy

                18.1.8.5.3. Channel Strategy

        18.1.9. Quanjiao Guangtai Adhesive Products Co., Ltd.

            18.1.9.1. Overview

            18.1.9.2. Product Portfolio

            18.1.9.3. Profitability by Market Segments

            18.1.9.4. Sales Footprint

            18.1.9.5. Strategy Overview

                18.1.9.5.1. Marketing Strategy

                18.1.9.5.2. Product Strategy

                18.1.9.5.3. Channel Strategy

        18.1.10. Elkem Silicones

            18.1.10.1. Overview

            18.1.10.2. Product Portfolio

            18.1.10.3. Profitability by Market Segments

            18.1.10.4. Sales Footprint

            18.1.10.5. Strategy Overview

                18.1.10.5.1. Marketing Strategy

                18.1.10.5.2. Product Strategy

                18.1.10.5.3. Channel Strategy

        18.1.11. Cheever Specialty Paper & Film

            18.1.11.1. Overview

            18.1.11.2. Product Portfolio

            18.1.11.3. Profitability by Market Segments

            18.1.11.4. Sales Footprint

            18.1.11.5. Strategy Overview

                18.1.11.5.1. Marketing Strategy

                18.1.11.5.2. Product Strategy

                18.1.11.5.3. Channel Strategy

19. Assumptions & Acronyms Used

20. Research Methodology

Don't pay for what you don't need

Customize your report by selecting specific countries or regions and save 30%!

List of Tables

Table 1: Global Market Value (US$ Million) Forecast by Region, 2018 to 2033

Table 2: Global Market Volume (Tons) Forecast by Region, 2018 to 2033

Table 3: Global Market Value (US$ Million) Forecast by Substrate, 2018 to 2033

Table 4: Global Market Volume (Tons) Forecast by Substrate, 2018 to 2033

Table 5: Global Market Value (US$ Million) Forecast by Labelling Technology, 2018 to 2033

Table 6: Global Market Volume (Tons) Forecast by Labelling Technology, 2018 to 2033

Table 7: Global Market Value (US$ Million) Forecast by Application, 2018 to 2033

Table 8: Global Market Volume (Tons) Forecast by Application, 2018 to 2033

Table 9: North America Market Value (US$ Million) Forecast by Country, 2018 to 2033

Table 10: North America Market Volume (Tons) Forecast by Country, 2018 to 2033

Table 11: North America Market Value (US$ Million) Forecast by Substrate, 2018 to 2033

Table 12: North America Market Volume (Tons) Forecast by Substrate, 2018 to 2033

Table 13: North America Market Value (US$ Million) Forecast by Labelling Technology, 2018 to 2033

Table 14: North America Market Volume (Tons) Forecast by Labelling Technology, 2018 to 2033

Table 15: North America Market Value (US$ Million) Forecast by Application, 2018 to 2033

Table 16: North America Market Volume (Tons) Forecast by Application, 2018 to 2033

Table 17: Latin America Market Value (US$ Million) Forecast by Country, 2018 to 2033

Table 18: Latin America Market Volume (Tons) Forecast by Country, 2018 to 2033

Table 19: Latin America Market Value (US$ Million) Forecast by Substrate, 2018 to 2033

Table 20: Latin America Market Volume (Tons) Forecast by Substrate, 2018 to 2033

Table 21: Latin America Market Value (US$ Million) Forecast by Labelling Technology, 2018 to 2033

Table 22: Latin America Market Volume (Tons) Forecast by Labelling Technology, 2018 to 2033

Table 23: Latin America Market Value (US$ Million) Forecast by Application, 2018 to 2033

Table 24: Latin America Market Volume (Tons) Forecast by Application, 2018 to 2033

Table 25: Western Europe Market Value (US$ Million) Forecast by Country, 2018 to 2033

Table 26: Western Europe Market Volume (Tons) Forecast by Country, 2018 to 2033

Table 27: Western Europe Market Value (US$ Million) Forecast by Substrate, 2018 to 2033

Table 28: Western Europe Market Volume (Tons) Forecast by Substrate, 2018 to 2033

Table 29: Western Europe Market Value (US$ Million) Forecast by Labelling Technology, 2018 to 2033

Table 30: Western Europe Market Volume (Tons) Forecast by Labelling Technology, 2018 to 2033

Table 31: Western Europe Market Value (US$ Million) Forecast by Application, 2018 to 2033

Table 32: Western Europe Market Volume (Tons) Forecast by Application, 2018 to 2033

Table 33: Eastern Europe Market Value (US$ Million) Forecast by Country, 2018 to 2033

Table 34: Eastern Europe Market Volume (Tons) Forecast by Country, 2018 to 2033

Table 35: Eastern Europe Market Value (US$ Million) Forecast by Substrate, 2018 to 2033

Table 36: Eastern Europe Market Volume (Tons) Forecast by Substrate, 2018 to 2033

Table 37: Eastern Europe Market Value (US$ Million) Forecast by Labelling Technology, 2018 to 2033

Table 38: Eastern Europe Market Volume (Tons) Forecast by Labelling Technology, 2018 to 2033

Table 39: Eastern Europe Market Value (US$ Million) Forecast by Application, 2018 to 2033

Table 40: Eastern Europe Market Volume (Tons) Forecast by Application, 2018 to 2033

Table 41: South Asia and Pacific Market Value (US$ Million) Forecast by Country, 2018 to 2033

Table 42: South Asia and Pacific Market Volume (Tons) Forecast by Country, 2018 to 2033

Table 43: South Asia and Pacific Market Value (US$ Million) Forecast by Substrate, 2018 to 2033

Table 44: South Asia and Pacific Market Volume (Tons) Forecast by Substrate, 2018 to 2033

Table 45: South Asia and Pacific Market Value (US$ Million) Forecast by Labelling Technology, 2018 to 2033

Table 46: South Asia and Pacific Market Volume (Tons) Forecast by Labelling Technology, 2018 to 2033

Table 47: South Asia and Pacific Market Value (US$ Million) Forecast by Application, 2018 to 2033

Table 48: South Asia and Pacific Market Volume (Tons) Forecast by Application, 2018 to 2033

Table 49: East Asia Market Value (US$ Million) Forecast by Country, 2018 to 2033

Table 50: East Asia Market Volume (Tons) Forecast by Country, 2018 to 2033

Table 51: East Asia Market Value (US$ Million) Forecast by Substrate, 2018 to 2033

Table 52: East Asia Market Volume (Tons) Forecast by Substrate, 2018 to 2033

Table 53: East Asia Market Value (US$ Million) Forecast by Labelling Technology, 2018 to 2033

Table 54: East Asia Market Volume (Tons) Forecast by Labelling Technology, 2018 to 2033

Table 55: East Asia Market Value (US$ Million) Forecast by Application, 2018 to 2033

Table 56: East Asia Market Volume (Tons) Forecast by Application, 2018 to 2033

Table 57: Middle East and Africa Market Value (US$ Million) Forecast by Country, 2018 to 2033

Table 58: Middle East and Africa Market Volume (Tons) Forecast by Country, 2018 to 2033

Table 59: Middle East and Africa Market Value (US$ Million) Forecast by Substrate, 2018 to 2033

Table 60: Middle East and Africa Market Volume (Tons) Forecast by Substrate, 2018 to 2033

Table 61: Middle East and Africa Market Value (US$ Million) Forecast by Labelling Technology, 2018 to 2033

Table 62: Middle East and Africa Market Volume (Tons) Forecast by Labelling Technology, 2018 to 2033

Table 63: Middle East and Africa Market Value (US$ Million) Forecast by Application, 2018 to 2033

Table 64: Middle East and Africa Market Volume (Tons) Forecast by Application, 2018 to 2033
Ismail Sutaria
Ismail Sutaria

Principal Consultant

Talk to Analyst

Find your sweet spots for generating winning opportunities in this market.

List of Charts

Figure 1: Global Market Value (US$ Million) by Substrate, 2023 to 2033

Figure 2: Global Market Value (US$ Million) by Labelling Technology, 2023 to 2033

Figure 3: Global Market Value (US$ Million) by Application, 2023 to 2033

Figure 4: Global Market Value (US$ Million) by Region, 2023 to 2033

Figure 5: Global Market Value (US$ Million) Analysis by Region, 2018 to 2033

Figure 6: Global Market Volume (Tons) Analysis by Region, 2018 to 2033

Figure 7: Global Market Value Share (%) and BPS Analysis by Region, 2023 to 2033

Figure 8: Global Market Y-o-Y Growth (%) Projections by Region, 2023 to 2033

Figure 9: Global Market Value (US$ Million) Analysis by Substrate, 2018 to 2033

Figure 10: Global Market Volume (Tons) Analysis by Substrate, 2018 to 2033

Figure 11: Global Market Value Share (%) and BPS Analysis by Substrate, 2023 to 2033

Figure 12: Global Market Y-o-Y Growth (%) Projections by Substrate, 2023 to 2033

Figure 13: Global Market Value (US$ Million) Analysis by Labelling Technology, 2018 to 2033

Figure 14: Global Market Volume (Tons) Analysis by Labelling Technology, 2018 to 2033

Figure 15: Global Market Value Share (%) and BPS Analysis by Labelling Technology, 2023 to 2033

Figure 16: Global Market Y-o-Y Growth (%) Projections by Labelling Technology, 2023 to 2033

Figure 17: Global Market Value (US$ Million) Analysis by Application, 2018 to 2033

Figure 18: Global Market Volume (Tons) Analysis by Application, 2018 to 2033

Figure 19: Global Market Value Share (%) and BPS Analysis by Application, 2023 to 2033

Figure 20: Global Market Y-o-Y Growth (%) Projections by Application, 2023 to 2033

Figure 21: Global Market Attractiveness by Substrate, 2023 to 2033

Figure 22: Global Market Attractiveness by Labelling Technology, 2023 to 2033

Figure 23: Global Market Attractiveness by Application, 2023 to 2033

Figure 24: Global Market Attractiveness by Region, 2023 to 2033

Figure 25: North America Market Value (US$ Million) by Substrate, 2023 to 2033

Figure 26: North America Market Value (US$ Million) by Labelling Technology, 2023 to 2033

Figure 27: North America Market Value (US$ Million) by Application, 2023 to 2033

Figure 28: North America Market Value (US$ Million) by Country, 2023 to 2033

Figure 29: North America Market Value (US$ Million) Analysis by Country, 2018 to 2033

Figure 30: North America Market Volume (Tons) Analysis by Country, 2018 to 2033

Figure 31: North America Market Value Share (%) and BPS Analysis by Country, 2023 to 2033

Figure 32: North America Market Y-o-Y Growth (%) Projections by Country, 2023 to 2033

Figure 33: North America Market Value (US$ Million) Analysis by Substrate, 2018 to 2033

Figure 34: North America Market Volume (Tons) Analysis by Substrate, 2018 to 2033

Figure 35: North America Market Value Share (%) and BPS Analysis by Substrate, 2023 to 2033

Figure 36: North America Market Y-o-Y Growth (%) Projections by Substrate, 2023 to 2033

Figure 37: North America Market Value (US$ Million) Analysis by Labelling Technology, 2018 to 2033

Figure 38: North America Market Volume (Tons) Analysis by Labelling Technology, 2018 to 2033

Figure 39: North America Market Value Share (%) and BPS Analysis by Labelling Technology, 2023 to 2033

Figure 40: North America Market Y-o-Y Growth (%) Projections by Labelling Technology, 2023 to 2033

Figure 41: North America Market Value (US$ Million) Analysis by Application, 2018 to 2033

Figure 42: North America Market Volume (Tons) Analysis by Application, 2018 to 2033

Figure 43: North America Market Value Share (%) and BPS Analysis by Application, 2023 to 2033

Figure 44: North America Market Y-o-Y Growth (%) Projections by Application, 2023 to 2033

Figure 45: North America Market Attractiveness by Substrate, 2023 to 2033

Figure 46: North America Market Attractiveness by Labelling Technology, 2023 to 2033

Figure 47: North America Market Attractiveness by Application, 2023 to 2033

Figure 48: North America Market Attractiveness by Country, 2023 to 2033

Figure 49: Latin America Market Value (US$ Million) by Substrate, 2023 to 2033

Figure 50: Latin America Market Value (US$ Million) by Labelling Technology, 2023 to 2033

Figure 51: Latin America Market Value (US$ Million) by Application, 2023 to 2033

Figure 52: Latin America Market Value (US$ Million) by Country, 2023 to 2033

Figure 53: Latin America Market Value (US$ Million) Analysis by Country, 2018 to 2033

Figure 54: Latin America Market Volume (Tons) Analysis by Country, 2018 to 2033

Figure 55: Latin America Market Value Share (%) and BPS Analysis by Country, 2023 to 2033

Figure 56: Latin America Market Y-o-Y Growth (%) Projections by Country, 2023 to 2033

Figure 57: Latin America Market Value (US$ Million) Analysis by Substrate, 2018 to 2033

Figure 58: Latin America Market Volume (Tons) Analysis by Substrate, 2018 to 2033

Figure 59: Latin America Market Value Share (%) and BPS Analysis by Substrate, 2023 to 2033

Figure 60: Latin America Market Y-o-Y Growth (%) Projections by Substrate, 2023 to 2033

Figure 61: Latin America Market Value (US$ Million) Analysis by Labelling Technology, 2018 to 2033

Figure 62: Latin America Market Volume (Tons) Analysis by Labelling Technology, 2018 to 2033

Figure 63: Latin America Market Value Share (%) and BPS Analysis by Labelling Technology, 2023 to 2033

Figure 64: Latin America Market Y-o-Y Growth (%) Projections by Labelling Technology, 2023 to 2033

Figure 65: Latin America Market Value (US$ Million) Analysis by Application, 2018 to 2033

Figure 66: Latin America Market Volume (Tons) Analysis by Application, 2018 to 2033

Figure 67: Latin America Market Value Share (%) and BPS Analysis by Application, 2023 to 2033

Figure 68: Latin America Market Y-o-Y Growth (%) Projections by Application, 2023 to 2033

Figure 69: Latin America Market Attractiveness by Substrate, 2023 to 2033

Figure 70: Latin America Market Attractiveness by Labelling Technology, 2023 to 2033

Figure 71: Latin America Market Attractiveness by Application, 2023 to 2033

Figure 72: Latin America Market Attractiveness by Country, 2023 to 2033

Figure 73: Western Europe Market Value (US$ Million) by Substrate, 2023 to 2033

Figure 74: Western Europe Market Value (US$ Million) by Labelling Technology, 2023 to 2033

Figure 75: Western Europe Market Value (US$ Million) by Application, 2023 to 2033

Figure 76: Western Europe Market Value (US$ Million) by Country, 2023 to 2033

Figure 77: Western Europe Market Value (US$ Million) Analysis by Country, 2018 to 2033

Figure 78: Western Europe Market Volume (Tons) Analysis by Country, 2018 to 2033

Figure 79: Western Europe Market Value Share (%) and BPS Analysis by Country, 2023 to 2033

Figure 80: Western Europe Market Y-o-Y Growth (%) Projections by Country, 2023 to 2033

Figure 81: Western Europe Market Value (US$ Million) Analysis by Substrate, 2018 to 2033

Figure 82: Western Europe Market Volume (Tons) Analysis by Substrate, 2018 to 2033

Figure 83: Western Europe Market Value Share (%) and BPS Analysis by Substrate, 2023 to 2033

Figure 84: Western Europe Market Y-o-Y Growth (%) Projections by Substrate, 2023 to 2033

Figure 85: Western Europe Market Value (US$ Million) Analysis by Labelling Technology, 2018 to 2033

Figure 86: Western Europe Market Volume (Tons) Analysis by Labelling Technology, 2018 to 2033

Figure 87: Western Europe Market Value Share (%) and BPS Analysis by Labelling Technology, 2023 to 2033

Figure 88: Western Europe Market Y-o-Y Growth (%) Projections by Labelling Technology, 2023 to 2033

Figure 89: Western Europe Market Value (US$ Million) Analysis by Application, 2018 to 2033

Figure 90: Western Europe Market Volume (Tons) Analysis by Application, 2018 to 2033

Figure 91: Western Europe Market Value Share (%) and BPS Analysis by Application, 2023 to 2033

Figure 92: Western Europe Market Y-o-Y Growth (%) Projections by Application, 2023 to 2033

Figure 93: Western Europe Market Attractiveness by Substrate, 2023 to 2033

Figure 94: Western Europe Market Attractiveness by Labelling Technology, 2023 to 2033

Figure 95: Western Europe Market Attractiveness by Application, 2023 to 2033

Figure 96: Western Europe Market Attractiveness by Country, 2023 to 2033

Figure 97: Eastern Europe Market Value (US$ Million) by Substrate, 2023 to 2033

Figure 98: Eastern Europe Market Value (US$ Million) by Labelling Technology, 2023 to 2033

Figure 99: Eastern Europe Market Value (US$ Million) by Application, 2023 to 2033

Figure 100: Eastern Europe Market Value (US$ Million) by Country, 2023 to 2033

Figure 101: Eastern Europe Market Value (US$ Million) Analysis by Country, 2018 to 2033

Figure 102: Eastern Europe Market Volume (Tons) Analysis by Country, 2018 to 2033

Figure 103: Eastern Europe Market Value Share (%) and BPS Analysis by Country, 2023 to 2033

Figure 104: Eastern Europe Market Y-o-Y Growth (%) Projections by Country, 2023 to 2033

Figure 105: Eastern Europe Market Value (US$ Million) Analysis by Substrate, 2018 to 2033

Figure 106: Eastern Europe Market Volume (Tons) Analysis by Substrate, 2018 to 2033

Figure 107: Eastern Europe Market Value Share (%) and BPS Analysis by Substrate, 2023 to 2033

Figure 108: Eastern Europe Market Y-o-Y Growth (%) Projections by Substrate, 2023 to 2033

Figure 109: Eastern Europe Market Value (US$ Million) Analysis by Labelling Technology, 2018 to 2033

Figure 110: Eastern Europe Market Volume (Tons) Analysis by Labelling Technology, 2018 to 2033

Figure 111: Eastern Europe Market Value Share (%) and BPS Analysis by Labelling Technology, 2023 to 2033

Figure 112: Eastern Europe Market Y-o-Y Growth (%) Projections by Labelling Technology, 2023 to 2033

Figure 113: Eastern Europe Market Value (US$ Million) Analysis by Application, 2018 to 2033

Figure 114: Eastern Europe Market Volume (Tons) Analysis by Application, 2018 to 2033

Figure 115: Eastern Europe Market Value Share (%) and BPS Analysis by Application, 2023 to 2033

Figure 116: Eastern Europe Market Y-o-Y Growth (%) Projections by Application, 2023 to 2033

Figure 117: Eastern Europe Market Attractiveness by Substrate, 2023 to 2033

Figure 118: Eastern Europe Market Attractiveness by Labelling Technology, 2023 to 2033

Figure 119: Eastern Europe Market Attractiveness by Application, 2023 to 2033

Figure 120: Eastern Europe Market Attractiveness by Country, 2023 to 2033

Figure 121: South Asia and Pacific Market Value (US$ Million) by Substrate, 2023 to 2033

Figure 122: South Asia and Pacific Market Value (US$ Million) by Labelling Technology, 2023 to 2033

Figure 123: South Asia and Pacific Market Value (US$ Million) by Application, 2023 to 2033

Figure 124: South Asia and Pacific Market Value (US$ Million) by Country, 2023 to 2033

Figure 125: South Asia and Pacific Market Value (US$ Million) Analysis by Country, 2018 to 2033

Figure 126: South Asia and Pacific Market Volume (Tons) Analysis by Country, 2018 to 2033

Figure 127: South Asia and Pacific Market Value Share (%) and BPS Analysis by Country, 2023 to 2033

Figure 128: South Asia and Pacific Market Y-o-Y Growth (%) Projections by Country, 2023 to 2033

Figure 129: South Asia and Pacific Market Value (US$ Million) Analysis by Substrate, 2018 to 2033

Figure 130: South Asia and Pacific Market Volume (Tons) Analysis by Substrate, 2018 to 2033

Figure 131: South Asia and Pacific Market Value Share (%) and BPS Analysis by Substrate, 2023 to 2033

Figure 132: South Asia and Pacific Market Y-o-Y Growth (%) Projections by Substrate, 2023 to 2033

Figure 133: South Asia and Pacific Market Value (US$ Million) Analysis by Labelling Technology, 2018 to 2033

Figure 134: South Asia and Pacific Market Volume (Tons) Analysis by Labelling Technology, 2018 to 2033

Figure 135: South Asia and Pacific Market Value Share (%) and BPS Analysis by Labelling Technology, 2023 to 2033

Figure 136: South Asia and Pacific Market Y-o-Y Growth (%) Projections by Labelling Technology, 2023 to 2033

Figure 137: South Asia and Pacific Market Value (US$ Million) Analysis by Application, 2018 to 2033

Figure 138: South Asia and Pacific Market Volume (Tons) Analysis by Application, 2018 to 2033

Figure 139: South Asia and Pacific Market Value Share (%) and BPS Analysis by Application, 2023 to 2033

Figure 140: South Asia and Pacific Market Y-o-Y Growth (%) Projections by Application, 2023 to 2033

Figure 141: South Asia and Pacific Market Attractiveness by Substrate, 2023 to 2033

Figure 142: South Asia and Pacific Market Attractiveness by Labelling Technology, 2023 to 2033

Figure 143: South Asia and Pacific Market Attractiveness by Application, 2023 to 2033

Figure 144: South Asia and Pacific Market Attractiveness by Country, 2023 to 2033

Figure 145: East Asia Market Value (US$ Million) by Substrate, 2023 to 2033

Figure 146: East Asia Market Value (US$ Million) by Labelling Technology, 2023 to 2033

Figure 147: East Asia Market Value (US$ Million) by Application, 2023 to 2033

Figure 148: East Asia Market Value (US$ Million) by Country, 2023 to 2033

Figure 149: East Asia Market Value (US$ Million) Analysis by Country, 2018 to 2033

Figure 150: East Asia Market Volume (Tons) Analysis by Country, 2018 to 2033

Figure 151: East Asia Market Value Share (%) and BPS Analysis by Country, 2023 to 2033

Figure 152: East Asia Market Y-o-Y Growth (%) Projections by Country, 2023 to 2033

Figure 153: East Asia Market Value (US$ Million) Analysis by Substrate, 2018 to 2033

Figure 154: East Asia Market Volume (Tons) Analysis by Substrate, 2018 to 2033

Figure 155: East Asia Market Value Share (%) and BPS Analysis by Substrate, 2023 to 2033

Figure 156: East Asia Market Y-o-Y Growth (%) Projections by Substrate, 2023 to 2033

Figure 157: East Asia Market Value (US$ Million) Analysis by Labelling Technology, 2018 to 2033

Figure 158: East Asia Market Volume (Tons) Analysis by Labelling Technology, 2018 to 2033

Figure 159: East Asia Market Value Share (%) and BPS Analysis by Labelling Technology, 2023 to 2033

Figure 160: East Asia Market Y-o-Y Growth (%) Projections by Labelling Technology, 2023 to 2033

Figure 161: East Asia Market Value (US$ Million) Analysis by Application, 2018 to 2033

Figure 162: East Asia Market Volume (Tons) Analysis by Application, 2018 to 2033

Figure 163: East Asia Market Value Share (%) and BPS Analysis by Application, 2023 to 2033

Figure 164: East Asia Market Y-o-Y Growth (%) Projections by Application, 2023 to 2033

Figure 165: East Asia Market Attractiveness by Substrate, 2023 to 2033

Figure 166: East Asia Market Attractiveness by Labelling Technology, 2023 to 2033

Figure 167: East Asia Market Attractiveness by Application, 2023 to 2033

Figure 168: East Asia Market Attractiveness by Country, 2023 to 2033

Figure 169: Middle East and Africa Market Value (US$ Million) by Substrate, 2023 to 2033

Figure 170: Middle East and Africa Market Value (US$ Million) by Labelling Technology, 2023 to 2033

Figure 171: Middle East and Africa Market Value (US$ Million) by Application, 2023 to 2033

Figure 172: Middle East and Africa Market Value (US$ Million) by Country, 2023 to 2033

Figure 173: Middle East and Africa Market Value (US$ Million) Analysis by Country, 2018 to 2033

Figure 174: Middle East and Africa Market Volume (Tons) Analysis by Country, 2018 to 2033

Figure 175: Middle East and Africa Market Value Share (%) and BPS Analysis by Country, 2023 to 2033

Figure 176: Middle East and Africa Market Y-o-Y Growth (%) Projections by Country, 2023 to 2033

Figure 177: Middle East and Africa Market Value (US$ Million) Analysis by Substrate, 2018 to 2033

Figure 178: Middle East and Africa Market Volume (Tons) Analysis by Substrate, 2018 to 2033

Figure 179: Middle East and Africa Market Value Share (%) and BPS Analysis by Substrate, 2023 to 2033

Figure 180: Middle East and Africa Market Y-o-Y Growth (%) Projections by Substrate, 2023 to 2033

Figure 181: Middle East and Africa Market Value (US$ Million) Analysis by Labelling Technology, 2018 to 2033

Figure 182: Middle East and Africa Market Volume (Tons) Analysis by Labelling Technology, 2018 to 2033

Figure 183: Middle East and Africa Market Value Share (%) and BPS Analysis by Labelling Technology, 2023 to 2033

Figure 184: Middle East and Africa Market Y-o-Y Growth (%) Projections by Labelling Technology, 2023 to 2033

Figure 185: Middle East and Africa Market Value (US$ Million) Analysis by Application, 2018 to 2033

Figure 186: Middle East and Africa Market Volume (Tons) Analysis by Application, 2018 to 2033

Figure 187: Middle East and Africa Market Value Share (%) and BPS Analysis by Application, 2023 to 2033

Figure 188: Middle East and Africa Market Y-o-Y Growth (%) Projections by Application, 2023 to 2033

Figure 189: Middle East and Africa Market Attractiveness by Substrate, 2023 to 2033

Figure 190: Middle East and Africa Market Attractiveness by Labelling Technology, 2023 to 2033

Figure 191: Middle East and Africa Market Attractiveness by Application, 2023 to 2033

Figure 192: Middle East and Africa Market Attractiveness by Country, 2023 to 2033

Recommendations

Packaging

Intermediate Bulk Container (IBC) Market

Published : March 2024

Packaging

Drum Liner Market

Published : March 2024

Packaging

Liner Bags Market

Published : November 2022

Packaging

Inner Bulk Liners Market

Published : July 2022

Explore Packaging Insights

View Reports

Paper Release Liners Market