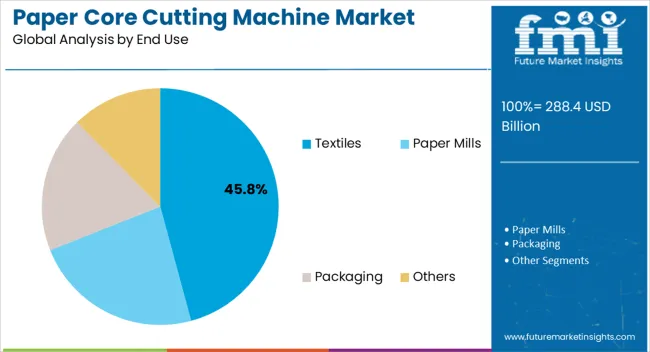
Paper Core Cutting Machine Market Outlook

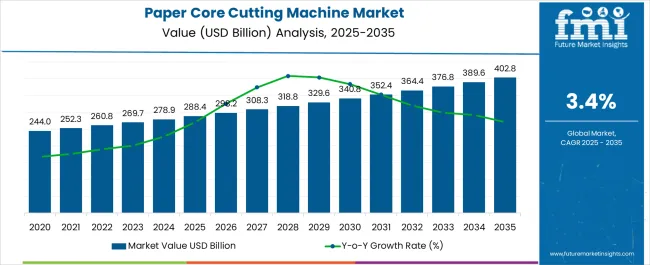
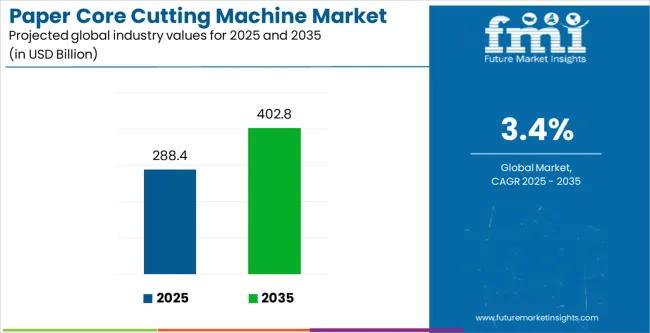
The paper core cutting machine market size is projected to be worth US$ 269.7 million in 2023. The market is likely to surpass US$ 376.7 million by 2033 at a CAGR of 3.4% during the forecast period. The core cutting machine is used for cutting the core of the paper into several sections. Paper core cutting machines play a very important role in the completion of any manufacturing process. These machines are employed for cutting paper tubes or cores around which the sheets of material will be wound. Core cutting machines are mostly available in variants such as manual, automatic, and semi-automatic. These machines are used to cut paper cores of various lengths and diameters for the conversion of master rolls into smaller ones.

Drivers Propelling the Demand for Paper Core Cutting Machine include:

  • The growth of the market is driven by the need for faster production rates and increased efficiency to achieve the target output. Many end-use industries are equipped with paper core cutting machines because of the demand for tubes and cores with various sizes according to the specific applications.
  • The paper core cutting machines market is the cost-effective solution for small and medium-scale companies which is also creating traction in the market. Small-scale companies can easily afford paper-core cutting machines for improving their manufacturing process and accurate results.
  • Manufacturers are looking forward to automating the manufacturing process which will help to reduce labor costs and maintain the quality of product. Thus, adoption of the automatic and semi-automatic machines due to technological developments is expected to drive the market. Demand for speed, accuracy, precision, and convenience are the major factor influencing the market.
  • Paper core cutting machines offer precise cutting which will help to reduce the waste generated from the cutting process. Reduction in paper waste will prove to be a cost-saving benefit to the manufacturers employing the machine. Overall, the benefits provided by the machine such as cost saving, waste reduction, high efficiency, and reduction of labor cost are expected to generate the demand for paper core cutting machines.

Challenges for Companies /Manufacturers in the Paper Core Cutting Machine Market:

  • Paper core cutting machines cannot be used for cores with very large diameters. The limitation to cut cores having specific diameters and lengths may act as a barrier for the market to grow.
  • Due to the advancement in technologies and innovations, the development of alternative machines for paper core cutting by machine manufacturers will affect the growth of the market in the future.
  • The paper core cutting machine would require proper maintenance for the machine to perform with optimal accuracy. Higher maintenance costs will indirectly affect the cost of production, thus it may limit the adoption of the machine.

Opportunities in the Paper Core Cutting Machine Industry:

  • Paper cores have huge applications in re-winding tapes, labels, stretch films, foam bags, and fabrics. Paper core cutting machines have opportunities to grow due to their wide applications in the packaging industry. Due to the significant growth in the packaging industry globally, the demand for the paper core is expected to surge which can drive the growth of the paper core cutting machine market.
  • Paper core is an important part of the electrical industry as they are used for bundling electric wires and similar materials. It acts as a space-saving material while the other methods may not be able to provide the same feature. Moreover, paper cores are also necessary to keep the electric materials in good condition and prevent it from crinkling, knotting, and tearing. Keeping in mind the application of paper cores in the electrical industry, growing digitization and increased need for electrical connection is expected to create opportunities for the paper core cutting machines market in the electrical and electronics sector.
  • Flexible packaging holds the maximum share of the packaging industry. Increased use of plastic films and tapes in packaging is subjected to an increase in the application of paper cores in the packaging industry. Considering the high demand for packaging films, tapes, and labels, the growth of the paper core cutting machine market is set to exceed in the forecast period.
  • The textile industry of one of the biggest sectors in the global market. Paper cores are used in textile industries for bundling and rolling the fabric as it makes it easy and convenient to use the fabric. Increasing demand for clothing’s & apparel and home décor textiles in the global market will significantly present the growth opportunities for the paper core cutting machine market.

Latest Trends in the Paper Core Cutting Machine Market:

  • Manufacturers are adopting the fully automated manufacturing processes to increase the production efficiency and reducing the overall production costs. Application of automation and robotics due to the industrial revolution in developing countries is creating traction in the market.
  • Customization and personalization have become essential for the consumers and thus manufacturers are providing the customized solutions to suit the specific needs of end users. Machine manufacturers are developing machines according to the required cutting dimensions. Recently, Havesino Company has developed a semi-automatic half inch paper core cutting machines for through the process of changing shaft thus makes it incredibly versatile and flexible device for the industries.
Attribute Details
Paper Core Cutting Machine Market Size (2023) US$ 269.7 million
Paper Core Cutting Machine Market Projected Size (2033) US$ 375.7 million
Value CAGR (2023 to 2033) 3.4%

Don't pay for what you don't need

Customize your report by selecting specific countries or regions and save 30%!

2018 to 2022 Paper Core Cutting Machine Demand Outlook Compared to 2023 to 2033 Forecast

From 2018 to 2022, the global paper core cutting machine market experienced a CAGR of 2.0%, reaching a market size of US$ 260.8 million in 2022 from US$ 240.6 million in 2018. Paper cores are basically the long tubes majorly used in many applications such as paper towels, cable reels, and others. Paper tubes are also called as spiral wound paper cores or paper tubes. Paper core cutting machines are employed in manufacturing industries for precise cutting and machining of the paper tubes. Increasing demand for paper cores from various industries such as textiles, adhesive tapes, and wires is one of the significant factor for the paper core cutting machines market growth. Furthermore, the paper cores are reusable, recyclable, and eco-friendly solutions makes it a sustainable option. As a result, the paper core cutting machines market has shown a significant growth. The waste generated from the paper core cutting machines is less and also it can be again reused and recycled further. The convenience provided by the paper cores and wide applications of the paper core are contributing to the growth of paper core cutting machine market.

Future Forecast for Paper Core Cutting Machine Industry

Looking ahead, the global paper core cutting machine market is expected to rise at a CAGR of 3.4% from 2023 to 2033. During the forecast period, the market size is expected to reach US$ 376.7 million in 2033.

With the increasing demand for paper cores from end use industries such as textiles, electrical, adhesive, converting, and shipping and storage industry, the demand for the paper core cutting machine is expected to be at the forefront during the projected years. The requirement for high speed machineries along with accurate results from the manufacturing industries is attributing towards the growth of the paper core cutting machine market. With the advancement in technology and the increasing adoption of automation in the manufacturing sector, the paper core cutting machine industry is expected to grow at a significant rate during the forecast period.
Ismail Sutaria
Ismail Sutaria

Principal Consultant

Talk to Analyst

Find your sweet spots for generating winning opportunities in this market.

Country-Wise Insights

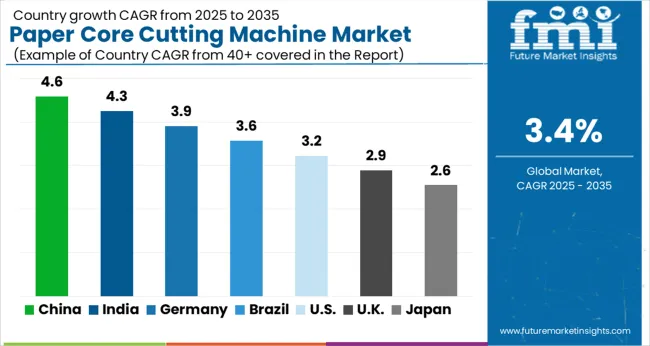
How China is Expected to Create Growth Opportunities for Paper Core Cutting Machine Market?

Country China
Market Size (US$ million) by End of Forecast Period (2033) US$ 84.0 million
CAGR % 2023 to End of Forecast (2033) 3.3%

According to World Integrated Trade Solutions (WITS), China is at the top in the import of textiles and clothing. China is the manufacturing hub with the establishment of various industries from different sectors. The manufacturing sector in China requires automated machines to meet the demand for products. Thus, China is expected to propel the paper-core cutting machine market.

Why the Paper and Packaging Sector in India Attributing Towards the Market Growth?

Country India
Market Size (US$ million) by End of Forecast Period (2033) US$ 37.7 million
CAGR % 2023 to End of Forecast (2033) 3.8%

India is one of the fastest-growing countries in the Asia Pacific. Paper and packaging Industry in India has shown significant growth in recent years and has a future growth potential for the industry. According to India Brand Equity Foundation (IBEF), the paper and packaging Sector in India is estimated to reach US$ 204.8 billion in 2025 expanding at a CAGR of 26.7%. The paper and packaging industry in India is the fifth largest sector of the Indian economy. Paper core cutting machine is an essential part of the packaging industry. As a result, India is expected to create growth opportunities for the paper core cutting machine market in the future.

Category-Wise Insights

Why Semi-automatic Automation Segment Dominates Paper Core Cutting Machine Market?

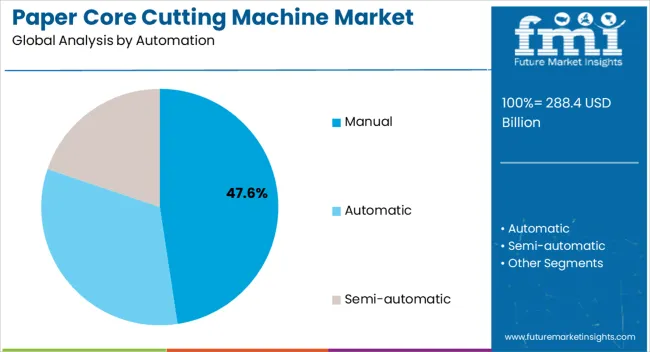
The semi-automatic machine type segment dominates the paper core cutting machine market with a market share of 52.2% in the estimated year. This segment captures a significant market share in 2023 due to its affordability and clean precise cutting. It is majorly preferred by small and medium-scale enterprises for paper core cutting. In most developing countries, the availability of cheap labor allows manufacturers to install the semi-automatic machine.

How Packaging Segment is Driving the Paper Core Cutting Machine Market?

The packing segment is expected to record a CAGR of 5.0% during the forecast period. The packaging industry is creating an enormous amount of opportunities for the paper core cutting market. Paper cores are being majorly used in tapes, labels, adhesives, and other applications. Also, with the growing concerns over plastic use and its environmental hazards, packaging manufacturers are moving towards the use of paper and paper boards. As a result, the packaging segment is anticipated to create growth in paper core cutting machines in the forecast years.
Get the data you need at a Fraction of the cost

Personalize your report by choosing insights you need
and save 40%!

How Key Players Stay Competitive in the Paper Core Cutting Machine Industry?

The key players in the paper core cutting machine market are focusing on innovative strategies by developing automatic machines providing maximum output and accurate results. Manufacturers are developing the machines according to the consumer’s demands for the cutting speed, size, and length of the cores.

Key Strategies Adopted by the Players

  • Strategic Partnerships and Collaborations

The major companies are trying to collaborate, which can help them gain competitive advantage, and also gain access to advanced technologies.

  • Increasing Product Efficiency and Accuracy

Companies are trying to improve their production efficiency and accuracy by highly investing in research and development. Some of the companies are trying to provide the product with minimum cost, which can be affordable for small and medium scale. This can eventually increase the adoption rate of the paper core cutting machine.

  • Expansion into Emerging Markets

The major key players are investing and expanding their channels into emerging economies which can help them gain market position. This strategy is helping them to increase their customer base.

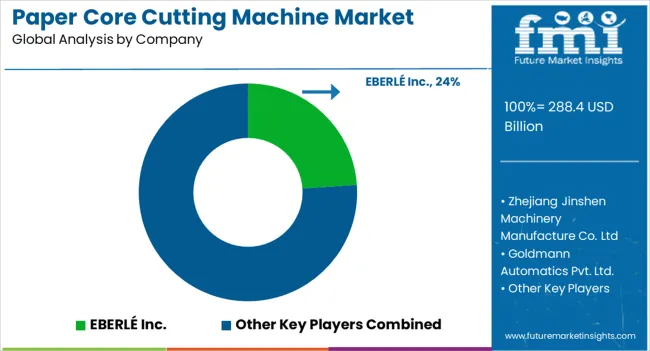
Key Players in the Paper Core Cutting Machine Industry

  • EBERLÉ Inc.
  • Zhejiang Jinshen Machinery Manufacture Co. Ltd
  • Goldmann Automatics Pvt. Ltd.
  • Eureka Machinery
  • Adroit Engineers
  • HCI Converting Equipment Co., Ltd.
  • J & D INDUSTRIES
  • K. U. SODALAMUTHU AND CO. PVT. LTD
  • Pinnacle Converting Equipment & Services, LLC
  • Orion Graphic Machinery
  • Parkland Machines Ltd
  • Zhejiang Deguang Machinery Co.,Ltd
  • Wenzhou Andy Machinery Co., Ltd
  • TOA DR ENTERPRISE CO.
  • Jota Machinery
  • KEW ENGG. & MFG. PVT. LTD.
  • Paperfox
  • Hero Impex India Private Limited
  • UBR Paper Machinery
  • HAVESINO
  • UNIMAX GROUP

Key Developments in the Paper Core Cutting Machine Market:

  • In April 2023, Jota Machinery announced that they will be showing their cutting edge technology at the JEC WORLD 2023 International Composites Show in Paris.
  • In May 2023, Havesino Company announced the development of its new product that is Copper Foil/Aluminum Foil Slitting Rewinding Machine specifically designed for precision cutting.

Segmentation Analysis of the Paper Core Cutting Machine Market

By Automation:

  • Manual
  • Automatic
  • Semi-automatic

By Operating Speed:

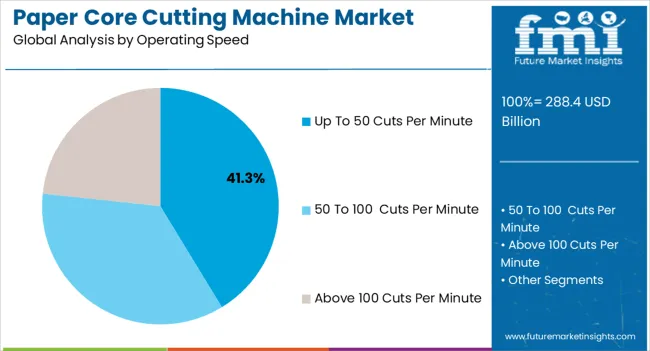
  • Up to 50 cuts per minute
  • 50 to 100 cuts per minute
  • Above 100 cuts per minute

By End Use:

  • Textiles
  • Paper Mills
  • Packaging
  • Others

By Region:

  • North America
  • Latin America
  • East Asia
  • South Asia & Pacific
  • Western Europe
  • Eastern Europe
  • Central Asia
  • Russia & Belarus
  • Balkan & Baltic Countries
  • Middle East and Africa (MEA)

Frequently Asked Questions

Which is the Top Trend in this Market?

Rising automation and the need for accurate and precise manufacturing are the top trends.

What Limits the Growth Potential of the Market?

Higher maintenance costs indirectly affect the cost of production and limit growth.

How China is Expected to Create Growth Opportunities for the Market?

The manufacturing sector in China requires automated machines and propels market growth.

What drives sales of this market?

The need for faster production rates drives sales.

What is the Growth Forecast for this Market?

The market is forecast to register a CAGR of 3.4% through 2033.

Table of Content
1. Executive Summary
    1.1. Global Market Outlook
    1.2. Market Analysis
    1.3. Analysis and Recommendations
2. Market Overview
    2.1. Market Coverage / Taxonomy
    2.2. Market Definition / Scope / Limitations
3. Key Market Trends
    3.1. Key Trends Impacting the Market
    3.2. Sustainable Trends
    3.3. Technological Trends
    3.4. Product Innovation / Development Trends
4. Key Success Factors
    4.1. Product Adoption / Usage Analysis
    4.2. Product USPs / Features
    4.3. Strategic Promotional Strategies
    4.4. Go-to-market Strategies
5. Global Market Demand Analysis 2018 to 2022 and Forecast, 2023 to 2033
    5.1. Historical Market Volume (Units) Analysis, 2018 to 2022
    5.2. Current and Future Market Volume (Units) Projections, 2023 to 2033
    5.3. Y-o-Y Growth Trend Analysis
6. Global Market - Pricing Analysis
    6.1. Regional Pricing Analysis
    6.2. Global Average Pricing Analysis Benchmark
7. Global Market Demand (in Value or Size in US$ Million) Analysis 2018 to 2022 and Forecast, 2023 to 2033
    7.1. Historical Market Value (US$ Million) Analysis, 2018 to 2022
    7.2. Current and Future Market Value (US$ Million) Projections, 2023 to 2033
        7.2.1. Y-o-Y Growth Trend Analysis
        7.2.2. Absolute $ Opportunity Analysis
8. Market Background
    8.1. Global Packaging Machinery Market Overview
    8.2. Forecast Factors - Relevance & Impact
    8.3. Value Chain Analysis & Profitability Margin
        8.3.1. Exhaustive List of Component Suppliers
        8.3.2. Exhaustive List of Distribution Machines/ Converters/Distributors
        8.3.3. Exhaustive List of Brand Owners/ Customer Base
    8.4. Case-based Scenario - Impact Assessment
        8.4.1. Current Statistics
        8.4.2. Short-Mid-Long Term Outlook
        8.4.3. Likely Rebound
    8.5. Market Dynamics
        8.5.1. Drivers
        8.5.2. Restraints
        8.5.3. Opportunity Analysis
    8.6. Supply Demand Analysis
        8.6.1. Import /Export Analysis
9. Global Market Analysis 2018 to 2022 and Forecast 2023 to 2033, By Automation
    9.1. Introduction/Key Findings
    9.2. Historical Market Size (US$ Million) and Volume (Units) Analysis By Machine Type, 2018-2022
    9.3. Current and Future Market Size (US$ Million) and Volume (Units) Analysis and Forecast By Machine Type, 2023-2033
        9.3.1. Manual
        9.3.2. Automatic
        9.3.3. Semi-automatic
    9.4. Market Attractiveness Analysis By Automation
10. Global Market Analysis 2018 to 2022 and Forecast 2023 to 2033, By Operating Speed
    10.1. Introduction / Key Findings
    10.2. Historical Market Size (US$ Million) and Volume (Units) Analysis By Operating Speed, 2018 to 2022
    10.3. Current and Future Market Size (US$ Million) and Volume (Units) Analysis and Forecast By Operating Speed, 2023 to 2033
        10.3.1. Up to 50 cuts per minute
        10.3.2. 50 to 100 cuts per minute
        10.3.3. Above 100 cuts per minute
    10.4. Market Attractiveness Analysis By Operating Speed
11. Global Market Analysis 2018 to 2022 and Forecast 2023 to 2033, By End Use
    11.1. Introduction / Key Findings
    11.2. Historical Market Size (US$ Million) and Volume (Units) Analysis By End Use, 2018 to 2022
    11.3. Current and Future Market Size (US$ Million) and Volume (Units) Analysis and Forecast By End Use, 2023 to 2033
        11.3.1. Textiles
        11.3.2. Paper Mills
        11.3.3. Packaging
        11.3.4. Others
    11.4. Market Attractiveness Analysis By End Use
12. Global Market Analysis 2018 to 2022 and Forecast 2023 to 2033, By Region
    12.1. Introduction / Key Findings
    12.2. Historical Market Size (US$ Million) and Volume (Units) Analysis By Region, 2018 to 2022
    12.3. Current and Future Market Size (US$ Million) and Volume (Units) Analysis and Forecast By Region, 2023 to 2033
        12.3.1. North America
        12.3.2. Latin America
        12.3.3. East Asia
        12.3.4. South Asia & Pacific
        12.3.5. Western Europe
        12.3.6. Eastern Europe
        12.3.7. Central Asia
        12.3.8. Russia & Belarus
        12.3.9. Balkan & Baltic Countries
        12.3.10. Middle East and Africa (MEA)
    12.4. Market Attractiveness Analysis By Region
13. North America Market Analysis 2018 to 2022 and Forecast 2023 to 2033
    13.1. Introduction / Key Findings
    13.2. Historical Market Size (US$ Million) and Volume (Units) Analysis by Market Taxonomy, 2018 to 2022
    13.3. Current Market Size (US$ Million) and Volume (Units) Analysis and Forecast by Market Taxonomy, 2023 to 2033
        13.3.1. By Country
            13.3.1.1. USA
            13.3.1.2. Canada
        13.3.2. By Automation
        13.3.3. By Operating Speed
        13.3.4. By End Use
    13.4. Market Attractiveness Analysis
        13.4.1. By Country
        13.4.2. By Automation
        13.4.3. By Operating Speed
        13.4.4. By End Use
14. Latin America Market Analysis 2018 to 2022 and Forecast 2023 to 2033
    14.1. Introduction / Key Findings
    14.2. Historical Market Size (US$ Million) and Volume (Units) Analysis by Market Taxonomy, 2018 to 2022
    14.3. Current Market Size (US$ Million) and Volume (Units) Analysis and Forecast by Market Taxonomy, 2023 to 2033
        14.3.1. By Country
            14.3.1.1. Brazil
            14.3.1.2. Mexico
            14.3.1.3. Argentina
            14.3.1.4. Rest of Latin America
        14.3.2. By Automation
        14.3.3. By Operating Speed
        14.3.4. By End Use
    14.4. Market Attractiveness Analysis
        14.4.1. By Country
        14.4.2. By Automation
        14.4.3. By Operating Speed
        14.4.4. By End Use
15. East Asia Market Analysis 2018 to 2022 and Forecast 2023 to 2033
    15.1. Introduction / Key Findings
    15.2. Historical Market Size (US$ Million) and Volume (Units) Analysis by Market Taxonomy, 2018 to 2022
    15.3. Current Market Size (US$ Million) and Volume (Units) Analysis and Forecast by Market Taxonomy, 2023 to 2033
        15.3.1. By Country
            15.3.1.1. China
            15.3.1.2. Japan
            15.3.1.3. South Korea
        15.3.2. By Automation
        15.3.3. By Operating Speed
        15.3.4. By End Use
    15.4. Market Attractiveness Analysis
        15.4.1. By Country
        15.4.2. By Automation
        15.4.3. By Operating Speed
        15.4.4. By End Use
16. South Asia & Pacific Market Analysis 2018 to 2022 and Forecast 2023 to 2033
    16.1. Introduction / Key Findings
    16.2. Historical Market Size (US$ Million) and Volume (Units) Analysis by Market Taxonomy, 2018 to 2022
    16.3. Current Market Size (US$ Million) and Volume (Units) Analysis and Forecast by Market Taxonomy, 2023 to 2033
        16.3.1. By Country
            16.3.1.1. India
            16.3.1.2. ASEAN
            16.3.1.3. Australia & New Zealand
        16.3.2. By Automation
        16.3.3. By Operating Speed
        16.3.4. By End Use
    16.4. Market Attractiveness Analysis
        16.4.1. By Country
        16.4.2. By Automation
        16.4.3. By Operating Speed
        16.4.4. By End Use
17. Western Europe Market Analysis 2018 to 2022 and Forecast 2023 to 2033
    17.1. Introduction / Key Findings
    17.2. Historical Market Size (US$ million) and Volume (Units) Analysis by Market Taxonomy, 2018 to 2022
    17.3. Current Market Size (US$ million) and Volume (Units) Analysis and Forecast by Market Taxonomy, 2023 to 2033
        17.3.1. By Country
            17.3.1.1. Germany
            17.3.1.2. France
            17.3.1.3. Spain
            17.3.1.4. Italy
            17.3.1.5. United Kingdom
            17.3.1.6. BENELUX
            17.3.1.7. Nordics
            17.3.1.8. Rest of Western Europe
        17.3.2. By Automation
        17.3.3. By Operating Speed
        17.3.4. By End Use
    17.4. Market Attractiveness Analysis
        17.4.1. By Country
        17.4.2. By Automation
        17.4.3. By Operating Speed
        17.4.4. By End Use
18. Eastern Europe Market Analysis 2018 to 2022 and Forecast 2023 to 2033
    18.1. Introduction / Key Findings
    18.2. Historical Market Size (US$ million) and Volume (Units) Analysis by Market Taxonomy, 2018 to 2022
    18.3. Current Market Size (US$ million) and Volume (Units) Analysis and Forecast by Market Taxonomy, 2023 to 2033
        18.3.1. By Country
            18.3.1.1. Poland
            18.3.1.2. Hungary
            18.3.1.3. Austria
            18.3.1.4. Czech Republic
            18.3.1.5. Rest of Eastern Europe
        18.3.2. By Automation
        18.3.3. By Operating Speed
        18.3.4. By End Use
    18.4. Market Attractiveness Analysis
        18.4.1. By Country
        18.4.2. By Automation
        18.4.3. By Operating Speed
        18.4.4. By End Use
19. Central Asia Market Analysis 2018 to 2022 and Forecast 2023 to 2033
    19.1. Introduction / Key Findings
    19.2. Historical Market Size (US$ million) and Volume (Units) Analysis by Market Taxonomy, 2018 to 2022
    19.3. Current Market Size (US$ million) and Volume (Units) Analysis and Forecast by Market Taxonomy, 2023 to 2033
        19.3.1. By Country
            19.3.1.1. Kazakhstan
            19.3.1.2. Kyrgyzstan
            19.3.1.3. Tajikistan
            19.3.1.4. Turkmenistan
            19.3.1.5. Uzbekistan
        19.3.2. By Automation
        19.3.3. By Operating Speed
        19.3.4. By End Use
    19.4. Market Attractiveness Analysis
        19.4.1. By Country
        19.4.2. By Automation
        19.4.3. By Operating Speed
        19.4.4. By End Use
20. Russia & Belarus Market Analysis 2018 to 2022 and Forecast 2023 to 2033
    20.1. Introduction / Key Findings
    20.2. Historical Market Size (US$ million) and Volume (Units) Analysis by Market Taxonomy, 2018 to 2022
    20.3. Current Market Size (US$ million) and Volume (Units) Analysis and Forecast by Market Taxonomy, 2023 to 2033
        20.3.1. By Country
            20.3.1.1. Russia
            20.3.1.2. Belarus
        20.3.2. By Automation
        20.3.3. By Operating Speed
        20.3.4. By End Use
    20.4. Market Attractiveness Analysis
        20.4.1. By Country
        20.4.2. By Automation
        20.4.3. By Operating Speed
        20.4.4. By End Use
21. Balkan & Baltic Countries Market Analysis 2018 to 2022 and Forecast 2023 to 2033
    21.1. Introduction / Key Findings
    21.2. Historical Market Size (US$ million) and Volume (Units) Analysis by Market Taxonomy, 2018 to 2022
    21.3. Current Market Size (US$ million) and Volume (Units) Analysis and Forecast by Market Taxonomy, 2023 to 2033
        21.3.1. By Country
            21.3.1.1. Romania
            21.3.1.2. Greece
            21.3.1.3. Bulgaria
        21.3.2. By Automation
        21.3.3. By Operating Speed
        21.3.4. By End Use
    21.4. Market Attractiveness Analysis
        21.4.1. By Country
        21.4.2. By Automation
        21.4.3. By Operating Speed
        21.4.4. By End Use
22. Middle East & Africa Market Analysis 2018 to 2022 and Forecast 2023 to 2033
    22.1. Introduction / Key Findings
    22.2. Historical Market Size (US$ million) and Volume (Units) Analysis by Market Taxonomy, 2018 to 2022
    22.3. Current Market Size (US$ million) and Volume (Units) Analysis and Forecast by Market Taxonomy, 2023 to 2033
        22.3.1. By Country
            22.3.1.1. GCC Countries
            22.3.1.2. Turkey
            22.3.1.3. Northern Africa
            22.3.1.4. South Africa
            22.3.1.5. Israel
        22.3.2. By Automation
        22.3.3. By Operating Speed
        22.3.4. By End Use
    22.4. Market Attractiveness Analysis
        22.4.1. By Country
        22.4.2. By Automation
        22.4.3. By Operating Speed
        22.4.4. By End Use
23. Country wise Market Analysis 2023 & 2033
    23.1. USA Market Analysis
        23.1.1. By Automation
        23.1.2. By Operating Speed
        23.1.3. By End Use
    23.2. Canada Market Analysis
        23.2.1. By Automation
        23.2.2. By Operating Speed
        23.2.3. By End Use
    23.3. Brazil Market Analysis
        23.3.1. By Automation
        23.3.2. By Operating Speed
        23.3.3. By End Use
    23.4. Mexico Market Analysis
        23.4.1. By Automation
        23.4.2. By Operating Speed
        23.4.3. By End Use
    23.5. Germany Market Analysis
        23.5.1. By Automation
        23.5.2. By Operating Speed
        23.5.3. By End Use
    23.6. UK Market Analysis
        23.6.1. By Automation
        23.6.2. By Operating Speed
        23.6.3. By End Use
    23.7. Spain Market Analysis
        23.7.1. By Automation
        23.7.2. By Operating Speed
        23.7.3. By End Use
    23.8. France Market Analysis
        23.8.1. By Automation
        23.8.2. By Operating Speed
        23.8.3. By End Use
    23.9. Italy Market Analysis
        23.9.1. By Automation
        23.9.2. By Operating Speed
        23.9.3. By End Use
    23.10. Russia Market Analysis
        23.10.1. By Automation
        23.10.2. By Operating Speed
        23.10.3. By End Use
    23.11. China Market Analysis
        23.11.1. By Automation
        23.11.2. By Operating Speed
        23.11.3. By End Use
    23.12. Japan Market Analysis
        23.12.1. By Automation
        23.12.2. By Operating Speed
        23.12.3. By End Use
    23.13. India Market Analysis
        23.13.1. By Automation
        23.13.2. By Operating Speed
        23.13.3. By End Use
    23.14. GCC Countries Market Analysis
        23.14.1. By Automation
        23.14.2. By Operating Speed
        23.14.3. By End Use
    23.15. Australia Market Analysis
        23.15.1. By Automation
        23.15.2. By Operating Speed
        23.15.3. By End Use
24. Market Structure Analysis
    24.1. Market Analysis by Tier of Companies
    24.2. Market Share Analysis of Top Players
    24.3. Market Presence Analysis
25. Competition Analysis
    25.1. Competition Dashboard
    25.2. Competition Benchmarking
    25.3. Competition Deep Dive
        25.3.1. EBERLÉ Inc.
            25.3.1.1. Overview
            25.3.1.2. Product Portfolio
            25.3.1.3. Profitability by Market Segments (Automation/Product/Region)
            25.3.1.4. Sales Footprint
            25.3.1.5. Strategy Overview
        25.3.2. Zhejiang Jinshen Machinery Manufacture Co. Ltd
            25.3.2.1. Overview
            25.3.2.2. Product Portfolio
            25.3.2.3. Profitability by Market Segments (Automation/Product/Region)
            25.3.2.4. Sales Footprint
            25.3.2.5. Strategy Overview
        25.3.3. Goldmann Automatics Pvt. Ltd.
            25.3.3.1. Overview
            25.3.3.2. Product Portfolio
            25.3.3.3. Profitability by Market Segments (Automation/Product/Region)
            25.3.3.4. Sales Footprint
            25.3.3.5. Strategy Overview
        25.3.4. Eureka Machinery
            25.3.4.1. Overview
            25.3.4.2. Product Portfolio
            25.3.4.3. Profitability by Market Segments (Automation/Product/Region)
            25.3.4.4. Sales Footprint
            25.3.4.5. Strategy Overview
        25.3.5. Adroit Engineers
            25.3.5.1. Overview
            25.3.5.2. Product Portfolio
            25.3.5.3. Profitability by Market Segments (Automation/Product/Region)
            25.3.5.4. Sales Footprint
            25.3.5.5. Strategy Overview
        25.3.6. HCI Converting Equipment Co., Ltd.
            25.3.6.1. Overview
            25.3.6.2. Product Portfolio
            25.3.6.3. Profitability by Market Segments (Automation/Product/Region)
            25.3.6.4. Sales Footprint
            25.3.6.5. Strategy Overview
        25.3.7. J & D INDUSTRIES
            25.3.7.1. Overview
            25.3.7.2. Product Portfolio
            25.3.7.3. Profitability by Market Segments (Automation/Product/Region)
            25.3.7.4. Sales Footprint
            25.3.7.5. Strategy Overview
        25.3.8. K. U. SODALAMUTHU AND CO. PVT. LTD
            25.3.8.1. Overview
            25.3.8.2. Product Portfolio
            25.3.8.3. Profitability by Market Segments (Automation/Product/Region)
            25.3.8.4. Sales Footprint
            25.3.8.5. Strategy Overview
        25.3.9. Pinnacle Converting Equipment & Services, LLC
            25.3.9.1. Overview
            25.3.9.2. Product Portfolio
            25.3.9.3. Profitability by Market Segments (Automation/Product/Region)
            25.3.9.4. Sales Footprint
            25.3.9.5. Strategy Overview
        25.3.10. Orion Graphic Machinery
            25.3.10.1. Overview
            25.3.10.2. Product Portfolio
            25.3.10.3. Profitability by Market Segments (Automation/Product/Region)
            25.3.10.4. Sales Footprint
            25.3.10.5. Strategy Overview
        25.3.11. Parkland Machines Ltd
            25.3.11.1. Overview
            25.3.11.2. Product Portfolio
            25.3.11.3. Profitability by Market Segments (Automation/Product/Region)
            25.3.11.4. Sales Footprint
            25.3.11.5. Strategy Overview
        25.3.12. Zhejiang Deguang Machinery Co.,Ltd
            25.3.12.1. Overview
            25.3.12.2. Product Portfolio
            25.3.12.3. Profitability by Market Segments (Automation/Product/Region)
            25.3.12.4. Sales Footprint
            25.3.12.5. Strategy Overview
        25.3.13. Wenzhou Andy Machinery Co., Ltd
            25.3.13.1. Overview
            25.3.13.2. Product Portfolio
            25.3.13.3. Profitability by Market Segments (Automation/Product/Region)
            25.3.13.4. Sales Footprint
            25.3.13.5. Strategy Overview
        25.3.14. TOA DR ENTERPRISE CO.
            25.3.14.1. Overview
            25.3.14.2. Product Portfolio
            25.3.14.3. Profitability by Market Segments (Automation/Product/Region)
            25.3.14.4. Sales Footprint
            25.3.14.5. Strategy Overview
        25.3.15. Jota Machinery
            25.3.15.1. Overview
            25.3.15.2. Product Portfolio
            25.3.15.3. Profitability by Market Segments (Automation/Product/Region)
            25.3.15.4. Sales Footprint
            25.3.15.5. Strategy Overview
        25.3.16. KEW ENGG. & MFG. PVT. LTD.
            25.3.16.1. Overview
            25.3.16.2. Product Portfolio
            25.3.16.3. Profitability by Market Segments (Automation/Product/Region)
            25.3.16.4. Sales Footprint
            25.3.16.5. Strategy Overview
        25.3.17. Paperfox
            25.3.17.1. Overview
            25.3.17.2. Product Portfolio
            25.3.17.3. Profitability by Market Segments (Automation/Product/Region)
            25.3.17.4. Sales Footprint
            25.3.17.5. Strategy Overview
        25.3.18. Hero Impex India Private Limited
            25.3.18.1. Overview
            25.3.18.2. Product Portfolio
            25.3.18.3. Profitability by Market Segments (Automation/Product/Region)
            25.3.18.4. Sales Footprint
            25.3.18.5. Strategy Overview
        25.3.19. UBR Paper Machinery
            25.3.19.1. Overview
            25.3.19.2. Product Portfolio
            25.3.19.3. Profitability by Market Segments (Automation/Product/Region)
            25.3.19.4. Sales Footprint
            25.3.19.5. Strategy Overview
        25.3.20. HAVESINO
            25.3.20.1. Overview
            25.3.20.2. Product Portfolio
            25.3.20.3. Profitability by Market Segments (Automation/Product/Region)
            25.3.20.4. Sales Footprint
            25.3.20.5. Strategy Overview
        25.3.21. UNIMAX GROUP
            25.3.21.1. Overview
            25.3.21.2. Product Portfolio
            25.3.21.3. Profitability by Market Segments (Automation/Product/Region)
            25.3.21.4. Sales Footprint
            25.3.21.5. Strategy Overview
26. Assumptions and Acronyms Used
27. Research Methodology

Explore Packaging Insights

View Reports
Future Market Insights

Paper Core Cutting Machine Market

Schedule a Call