The paper core market is projected to grow from USD 4.9 billion in 2025 to USD 8.8 billion by 2035, at a CAGR of 6.0%. Expansion is being driven by modernization of industrial winding systems and increasing adoption of material support solutions across textile, paper, film, and flexible packaging sectors. The rise from USD 4.9 billion to USD 8.8 billion underscores accelerating demand for precision-wound core systems that provide superior load handling and support in manufacturing facilities, converting operations, and distribution centers.
Between 2025 and 2030, the market is forecast to increase from USD 4.9 billion to about USD 6.4 billion, adding USD 1.5 billion in value and contributing nearly 39% of decade-long growth. This period will be marked by high-strength core adoption, with automated winding compatibility and enhanced load-bearing performance becoming industry standards. As per Future Market Insights, recognized worldwide for foresight in packaging circularity and regulatory adaptation, dimensional stability and crush resistance will no longer remain premium features but expected specifications across applications.
The expanding global e-commerce sector is one of the primary drivers of the paper core market. As online shopping continues to grow at an unprecedented rate, the demand for packaging materials that are both protective and sustainable has surged. Paper cores are widely used in the packaging of textiles, carpets, and other roll-based products, offering structural integrity and easy handling. Additionally, with growing pressure from consumers and governments to reduce plastic waste, the shift towards recyclable and biodegradable materials has significantly increased the demand for paper cores in packaging applications. This aligns with the broader trend of reducing plastic consumption, particularly in packaging, which is a major contributor to environmental pollution.
Technological advancements in paper manufacturing processes are contributing to the market's growth by improving the efficiency, strength, and quality of paper cores. Innovations such as the use of recycled paper and sustainable wood sources are helping to reduce the environmental impact of paper core production while increasing its cost-effectiveness. These improvements not only support the sustainability goals of businesses but also enhance the performance of paper cores in demanding industrial applications.
The competitive landscape of the paper core market is characterized by a growing number of players focusing on expanding their production capacities and improving the quality of their offerings. Manufacturers are increasingly investing in automation and process optimization to meet the rising demand for paper cores in various industries. Additionally, regional shifts towards local production and the emphasis on sustainability are reshaping the supply chain dynamics of the industry.
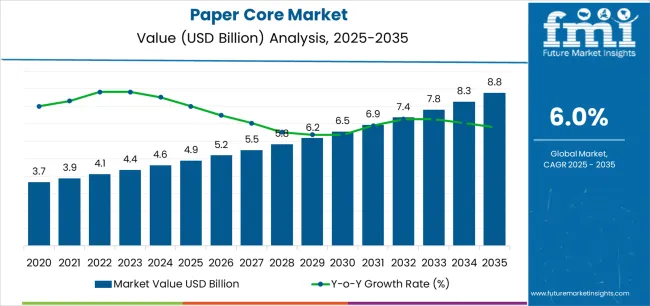
From 2030 to 2035, the market is expected to grow further from USD 6.4 billion to USD 8.8 billion, creating USD 2.4 billion in additional value, equivalent to around 61% of total growth. This phase will be characterized by widespread deployment of advanced core configurations, integration with modern converting platforms, and compatibility with high-speed winding and slitting operations. The shift signals structural change in how converters and manufacturers view material handling, with deeper penetration across multiple industrial segments.
Distinct phases highlight evolving competitive dynamics. Between 2025 and 2030, annual average growth of 5.5% will reflect the move from conventional core production to precision-wound systems, with load-bearing and dimensional accuracy gaining prominence. Market maturity factors will include standardized specifications, lower costs of precision production, and greater awareness of core performance benefits, reaching effectiveness levels of 70–75% in industrial use cases. Established firms such as Sonoco Products Company and Greif Inc. will expand their offerings, while new entrants pursue innovations in heavy-duty core designs and surface treatments.
From 2030 to 2035, USD 2.4 billion in added value will be driven by universal adoption of advanced core systems, integration with automated winding platforms, and deployment across diverse converting scenarios. Market focus will evolve from simple durability toward comprehensive performance metrics and compatibility with next-generation converting lines, defining the competitive landscape of the future.
| Metric | Value |
|---|---|
| Market Value (2025) | USD 4.9 billion |
| Market Forecast (2035) | USD 8.8 billion |
| Growth Rate | 6.00% CAGR |
| Leading Core Type | Spiral Wound Cores |
| Primary Application | Textile Industry |
The market demonstrates strong fundamentals with spiral wound core systems capturing a dominant share through superior strength-to-weight ratios and versatile configuration capabilities. Textile applications drive primary demand, supported by increasing flexible manufacturing requirements and automated winding management solutions. Geographic expansion remains concentrated in Asia Pacific with established textile and converting infrastructure, while North American and European markets show steady adoption rates driven by industrial modernization projects and specialty film converting activity.
The paper core market represents a compelling intersection of industrial winding innovation, material handling optimization, and manufacturing efficiency management. With robust growth projected from USD 4.9 billion in 2025 to USD 8.8 billion by 2035 at a 6.00% CAGR, this market is driven by increasing textile production expansion trends, flexible packaging requirements, and commercial demand for precision-wound material support formats.
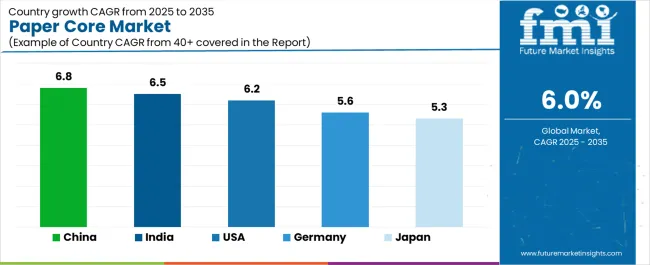
The market's expansion reflects a fundamental shift in how manufacturers and converters approach winding infrastructure. Strong growth opportunities exist across diverse applications, from textile operations requiring high-speed winding to film converting facilities demanding dimensional precision. Geographic expansion is particularly pronounced in Asia-Pacific markets, led by China (6.8% CAGR) and India (6.5% CAGR), while established markets in North America and Europe drive innovation and specialized segment development.
The dominance of spiral wound core systems and textile applications underscores the importance of proven construction technology and structural reliability in driving adoption. Core diameter consistency and production throughput remain key challenges, creating opportunities for companies that can deliver reliable performance while maintaining operational efficiency.
Market expansion rests on three fundamental shifts driving adoption across industrial and converting sectors. Textile manufacturing growth creates compelling advantages through paper core systems that provide comprehensive material support with consistent winding performance, enabling textile manufacturers to safeguard fabric quality and reduce production defects while maintaining throughput efficiency and justifying investment over alternative core materials. Flexible packaging expansion accelerates as film converters worldwide seek precision-wound core systems that deliver dimensional accuracy directly to high-speed slitting environments, enabling quality consistency that aligns with converter expectations and maximizes production efficiency. Industrial automation drives adoption from manufacturing facilities requiring standardized core dimensions that enable automated handling systems while maintaining structural integrity during transportation and storage operations.
The growth faces headwinds from raw material price variations that differ across pulp and paperboard markets regarding fiber availability and manufacturing costs, potentially limiting performance reliability in cost-sensitive industrial categories. Dimensional tolerance challenges also persist regarding roundness consistency and wall thickness uniformity that may increase rejection rates in markets with demanding precision standards.
Primary Classification: The market segments by core type into spiral wound cores, parallel wound cores, and convolute cores categories, representing the evolution from standard construction to specialized manufacturing techniques for comprehensive industrial operations.
Secondary Breakdown: Application segmentation divides the market into textile industry, paper & board, flexible packaging, films & foils, tapes & labels, and others sectors, reflecting distinct requirements for strength characteristics, dimensional precision, and surface quality.
Regional Classification: Geographic distribution covers North America, Europe, Asia Pacific, Latin America, and the Middle East & Africa, with Asia Pacific leading production volumes while developed markets show steady growth patterns driven by specialty application development programs.
The segmentation structure reveals technology progression from standard spiral wound cores toward integrated precision platforms with enhanced dimensional control and structural capabilities, while application diversity spans from textile operations to converting facilities requiring comprehensive material handling and high-speed winding solutions.
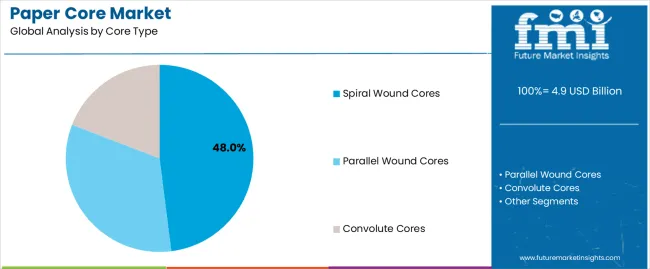
Spiral wound cores segment is estimated to account for 48% of the paper core market share in 2025. The segment's leading position stems from its fundamental role as a critical component in industrial winding applications and its extensive use across multiple textile and converting sectors. Spiral wound construction's dominance is attributed to its superior strength-to-weight ratio, including excellent crush resistance, reliable dimensional stability, and balanced cost-performance characteristics that make it indispensable for high-volume manufacturing operations.
Market Position: Spiral wound core systems command the leading position in the paper core market through advanced manufacturing technologies, including comprehensive ply control, uniform adhesive distribution, and reliable curing performance that enable manufacturers to deploy winding solutions across diverse industrial environments.
Value Drivers: The segment benefits from converter preference for proven construction methods that provide exceptional structural integrity without requiring excessive wall thickness. Efficient material usage enables deployment in textile winding, paper rolling, and film converting applications where dimensional consistency and load-bearing capacity represent critical selection requirements.
Competitive Advantages: Spiral wound core systems differentiate through excellent crush resistance, proven roundness accuracy, and compatibility with automated winding equipment that enhance material handling capabilities while maintaining economical manufacturing profiles suitable for diverse industrial winding applications.
Key market characteristics:
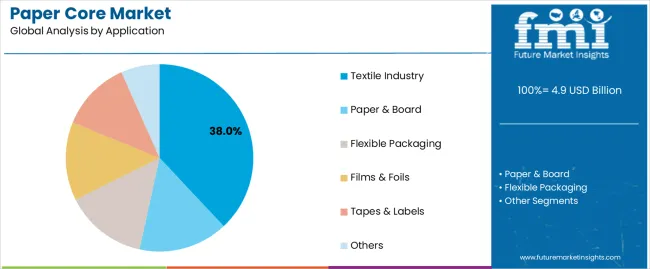
Textile industry segment is projected to hold 38% of the paper core market share in 2025. The segment's market leadership is driven by the extensive use of paper cores in yarn winding, fabric rolling, thread packaging, and textile material handling, where cores serve as both a structural support and material protection system. The textile industry's consistent investment in automated winding systems supports the segment's dominant position.
Market Context: Textile applications dominate the market due to widespread adoption of high-speed winding equipment and increasing focus on production efficiency, material quality, and automated handling that enhance manufacturing productivity while maintaining dimensional consistency.
Appeal Factors: Textile manufacturers prioritize crush resistance, dimensional accuracy, and integration with automated winding systems that enable coordinated deployment across multiple production lines. The segment benefits from substantial Asian textile production and global manufacturing standards that emphasize reliable core performance for yarn and fabric applications.
Growth Drivers: Synthetic fiber production programs incorporate paper cores as standard components for polyester, nylon, and specialty yarn winding. At the same time, natural fiber initiatives are increasing demand for precision-wound cores that comply with textile quality standards and enhance material handling efficiency.
Market Challenges: Regional price competition and alternative core material development may limit deployment flexibility in ultra-price-sensitive segments or markets with established plastic core preferences.
Application dynamics include:
Growth Accelerators: Textile manufacturing expansion drives primary adoption as paper core systems provide exceptional winding reliability that enables yarn protection without excessive weight penalties, supporting automated handling integration and quality enhancement that require consistent dimensional formats. Flexible packaging innovation accelerates market growth as film converters seek precision-wound core solutions that maintain dimensional accuracy during high-speed slitting while enhancing material yield through refined tolerances. Industrial automation increases worldwide, creating sustained demand for standardized core systems that complement robotic handling and provide competitive advantages in manufacturing efficiency.
Growth Inhibitors: Raw material cost volatility challenges differ across pulp markets regarding fiber availability and pricing dynamics, which may limit market penetration and profitability in price-sensitive categories with demanding cost requirements. Dimensional tolerance complexity persists regarding roundness control and concentricity maintenance that may increase quality control costs in precision applications with tight specification limits. Market fragmentation across multiple core diameters and construction types creates inventory management concerns for converters maintaining diverse product portfolios.
Market Evolution Patterns: Adoption accelerates in textile and flexible packaging sectors where performance reliability justifies material investments, with geographic concentration in Asia Pacific transitioning toward specialty application growth in developed markets driven by film converting and technical material expansion. Technology development focuses on enhanced dimensional control, improved crush resistance, and integration with automated handling systems that optimize production efficiency and material quality. The market could face disruption if alternative core materials or construction innovations significantly challenge paper core advantages in winding applications.
The paper core market demonstrates varied regional dynamics with Growth Leaders including China (6.8% CAGR) and India (6.5% CAGR) driving expansion through textile manufacturing growth and industrial modernization. Steady Performers encompass the USA (6.2% CAGR), Germany (5.6% CAGR), and Japan (5.3% CAGR), benefiting from established converting sectors and specialty application adoption.
| Country | CAGR (2025-2035) |
|---|---|
| China | 6.8% |
| India | 6.5% |
| USA | 6.2% |
| Germany | 5.6% |
| Japan | 5.3% |
Regional synthesis reveals Asia-Pacific markets leading growth through textile production and flexible packaging development, while European countries maintain steady expansion supported by specialized converting applications and precision manufacturing requirements. North American markets show strong growth driven by film converting and industrial automation applications.
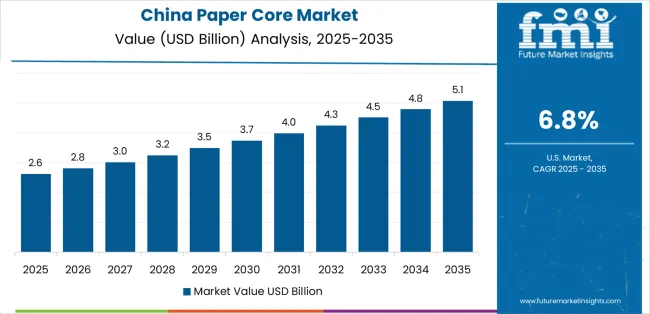
China establishes regional leadership through explosive textile production expansion and comprehensive industrial modernization, integrating advanced paper core systems as standard components in yarn winding and flexible packaging operations. The country's 6.8% CAGR through 2035 reflects manufacturing capacity growth promoting textile exports and domestic converting activity that mandate the use of reliable core systems in production operations. Growth concentrates in major textile hubs, including Jiangsu, Zhejiang, and Guangdong, where manufacturing networks showcase integrated core systems that appeal to domestic converters seeking enhanced dimensional accuracy and international quality standards.
Chinese manufacturers are developing innovative paper core solutions that combine local production advantages with international dimensional specifications, including precision-wound construction and advanced moisture-resistant capabilities.
Strategic Market Indicators:
The Indian market emphasizes textile applications, including rapid yarn production development and comprehensive manufacturing expansion that increasingly incorporates paper cores for spinning operations and fabric rolling applications. The country is projected to show a 6.5% CAGR through 2035, driven by massive textile manufacturing activity under export promotion initiatives and commercial demand for affordable, reliable core systems. Indian textile manufacturers prioritize cost-effectiveness with paper cores delivering structural support through economical material usage and efficient dimensional control.
Technology deployment channels include major spinning mills, textile converters, and packaging manufacturers that support high-volume usage for domestic and export applications.
Performance Metrics:
The USA market emphasizes advanced core features, including innovative construction technologies and integration with comprehensive converting platforms that manage film slitting, label production, and specialty material handling applications through unified winding systems. The country is projected to show a 6.2% CAGR through 2035, driven by flexible packaging expansion under consumer goods trends and commercial demand for precision-wound core systems. American converters prioritize production efficiency with paper cores delivering comprehensive dimensional accuracy through refined manufacturing and structural precision.
Technology deployment channels include major film manufacturers, label converters, and specialty material processors that support custom development for precision operations.
Performance Metrics:
In Bavaria, North Rhine-Westphalia, and Baden-Württemberg, German converting operations and industrial manufacturers are implementing advanced paper core systems to enhance production capabilities and support quality assurance that aligns with manufacturing protocols and industrial standards. The German market demonstrates sustained growth with a 5.6% CAGR through 2035, driven by specialty film innovation programs and converting equipment investments that emphasize precision-wound core systems for industrial and packaging applications. German manufacturing facilities are prioritizing paper core systems that provide exceptional dimensional consistency while maintaining compliance with handling standards and minimizing production waste, particularly important in flexible packaging converting and specialty film operations.
Market expansion benefits from quality assurance programs that mandate enhanced dimensional control in core specifications, creating sustained demand across Germany's converting and industrial sectors, where tolerance precision and structural reliability represent critical requirements.
Strategic Market Indicators:
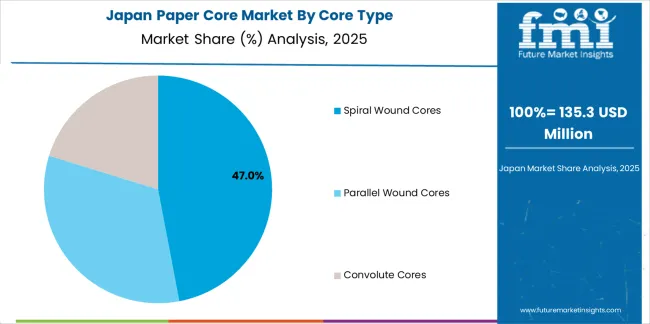
Japan's sophisticated manufacturing market demonstrates meticulous core deployment, growing at 5.3% CAGR, with documented operational excellence in dimensional precision and structural consistency applications through integration with existing converting systems and quality management infrastructure. The country leverages engineering expertise in precision manufacturing and dimensional control to maintain market leadership. Converting centers, including Osaka, Tokyo, and Nagoya, showcase advanced installations where paper core systems integrate with comprehensive slitting platforms and winding systems to optimize production efficiency and material quality.
Japanese converters prioritize dimensional precision and structural consistency in core development, creating demand for premium paper core systems with advanced features, including ultra-smooth surfaces and integration with automated handling protocols. The market benefits from established converting infrastructure and willingness to invest in specialized construction technologies that provide superior roundness accuracy and regulatory compliance.
Market Intelligence Brief:
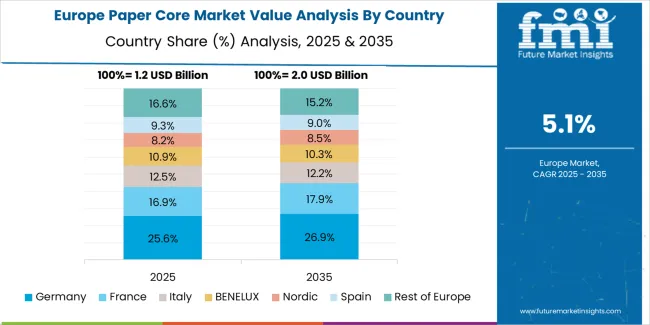
The paper core market in Europe is projected to grow from USD 1,289 million in 2025 to USD 2,087 million by 2035, registering a CAGR of 4.9% over the forecast period. Germany is expected to maintain its leadership position with a 39.4% market share in 2025, declining slightly to 38.9% by 2035, supported by its converting excellence and major manufacturing centers, including North Rhine-Westphalia and Bavaria.
Italy follows with a 21.8% share in 2025, projected to reach 22.3% by 2035, driven by comprehensive textile manufacturing and flexible packaging initiatives. The United Kingdom holds a 18.7% share in 2025, expected to maintain 19.1% by 2035 through established label converting sectors and specialty film adoption. France commands a 10.6% share, while Spain accounts for 7.2% in 2025. The Rest of Europe region is anticipated to gain momentum, expanding its collective share from 2.3% to 2.7% by 2035, attributed to increasing industrial development in Eastern European countries and emerging Nordic converting operations implementing precision core programs.
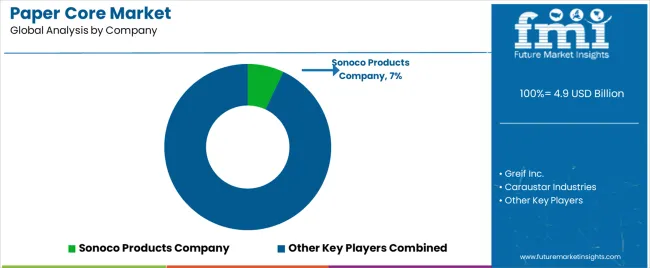
The Paper Core Market is expanding as manufacturers across textiles, films, adhesives, paper mills, and logistics increasingly rely on sturdy, customizable cores for winding, packaging, and transporting materials. Growth is supported by rising consumption of flexible packaging, continuous expansion of industrial manufacturing, and the shift toward recyclable, fiber-based packaging solutions. Paper cores are preferred for their durability, versatility, and sustainability, especially as companies reduce dependence on plastic-based winding and packaging components. Demand is also increasing from e-commerce and shipping sectors, where protective paper cores and tubes help safeguard products during handling and transit.
Sonoco Products Company, Greif Inc., and Caraustar Industries hold strong positions through wide product portfolios and global manufacturing networks that serve high-volume industrial clients. Smurfit Kappa Group and VPK Packaging Group continue strengthening their presence with engineered, lightweight cores designed for high-speed winding lines in films, textiles, and paper converting.
Specialized players such as Paramount Tube, Valk Industries, and Albert Eger GmbH cater to niche requirements, offering precision-made cores and tubes for demanding applications like metals, tapes, and specialty films. Meanwhile, regional producers including LCH Paper Tube and Core and Rae Products and Chemicals are supplying custom solutions for local converters and manufacturers, emphasizing quick turnaround, design flexibility, and cost efficiency. As sustainability gains priority, the market is witnessing increased adoption of recycled fiber cores and continuous innovation in strength-to-weight optimization.
| Item | Value |
|---|---|
| Quantitative Units | USD 4.9 billion |
| Core Type | Spiral Wound Cores, Parallel Wound Cores, Convolute Cores |
| Application | Textile Industry, Paper & Board, Flexible Packaging, Films & Foils, Tapes & Labels, Others |
| Regions Covered | North America, Europe, Asia Pacific, Latin America, Middle East & Africa |
| Countries Covered | USA, Germany, Japan, China, India, and 25+ additional countries |
| Key Companies Profiled | Sonoco Products Company, Greif Inc., Caraustar Industries, VPK Packaging Group, Smurfit Kappa Group, Paramount Tube, Valk Industries, Albert Eger GmbH, LCH Paper Tube and Core, Rae Products and Chemicals |
| Additional Attributes | Dollar sales by core type and application categories, regional adoption trends across Asia Pacific, North America, and Europe, competitive landscape with core manufacturers and converting specialists, converter preferences for dimensional accuracy and structural integrity, integration with winding equipment and slitting systems, innovations in construction technology and surface treatments, and development of specialized precision solutions with enhanced crush resistance and dimensional control features |
The global paper core market is estimated to be valued at USD 4.9 billion in 2025.
The market size for the paper core market is projected to reach USD 8.8 billion by 2035.
The paper core market is expected to grow at a 6.0% CAGR between 2025 and 2035.
The key product types in paper core market are spiral wound cores, parallel wound cores and convolute cores.
In terms of application, textile industry segment to command 38.0% share in the paper core market in 2025.


Our Research Products

The "Full Research Suite" delivers actionable market intel, deep dives on markets or technologies, so clients act faster, cut risk, and unlock growth.

The Leaderboard benchmarks and ranks top vendors, classifying them as Established Leaders, Leading Challengers, or Disruptors & Challengers.

Locates where complements amplify value and substitutes erode it, forecasting net impact by horizon

We deliver granular, decision-grade intel: market sizing, 5-year forecasts, pricing, adoption, usage, revenue, and operational KPIs—plus competitor tracking, regulation, and value chains—across 60 countries broadly.

Spot the shifts before they hit your P&L. We track inflection points, adoption curves, pricing moves, and ecosystem plays to show where demand is heading, why it is changing, and what to do next across high-growth markets and disruptive tech

Real-time reads of user behavior. We track shifting priorities, perceptions of today’s and next-gen services, and provider experience, then pace how fast tech moves from trial to adoption, blending buyer, consumer, and channel inputs with social signals (#WhySwitch, #UX).

Partner with our analyst team to build a custom report designed around your business priorities. From analysing market trends to assessing competitors or crafting bespoke datasets, we tailor insights to your needs.
Supplier Intelligence
Discovery & Profiling
Capacity & Footprint
Performance & Risk
Compliance & Governance
Commercial Readiness
Who Supplies Whom
Scorecards & Shortlists
Playbooks & Docs
Category Intelligence
Definition & Scope
Demand & Use Cases
Cost Drivers
Market Structure
Supply Chain Map
Trade & Policy
Operating Norms
Deliverables
Buyer Intelligence
Account Basics
Spend & Scope
Procurement Model
Vendor Requirements
Terms & Policies
Entry Strategy
Pain Points & Triggers
Outputs
Pricing Analysis
Benchmarks
Trends
Should-Cost
Indexation
Landed Cost
Commercial Terms
Deliverables
Brand Analysis
Positioning & Value Prop
Share & Presence
Customer Evidence
Go-to-Market
Digital & Reputation
Compliance & Trust
KPIs & Gaps
Outputs
Full Research Suite comprises of:
Market outlook & trends analysis
Interviews & case studies
Strategic recommendations
Vendor profiles & capabilities analysis
5-year forecasts
8 regions and 60+ country-level data splits
Market segment data splits
12 months of continuous data updates
DELIVERED AS:
PDF EXCEL ONLINE
Paper Core Cutting Machine Market Size and Share Forecast Outlook 2025 to 2035
Industry Share Analysis for Paper Core Companies
Paper Tubes & Core Industry Analysis in United States Trends, Size, and Forecast for 2025-2035
Paperboard Partition Market Size and Share Forecast Outlook 2025 to 2035
Paper Box Market Size and Share Forecast Outlook 2025 to 2035
Paper Edge Protector Market Size and Share Forecast Outlook 2025 to 2035
Paper Cup Lids Market Size and Share Forecast Outlook 2025 to 2035
Paper Pallet Market Size and Share Forecast Outlook 2025 to 2035
Paper and Paperboard Packaging Market Forecast and Outlook 2025 to 2035
Paper Wrap Market Size and Share Forecast Outlook 2025 to 2035
Paper Cups Market Size and Share Forecast Outlook 2025 to 2035
Paper Bags Market Size and Share Forecast Outlook 2025 to 2035
Paper Processing Resins Market Size and Share Forecast Outlook 2025 to 2035
Paper Tester Market Size and Share Forecast Outlook 2025 to 2035
Paper Napkin Converting Lines Market Size and Share Forecast Outlook 2025 to 2035
Paper Packaging Tapes Market Size and Share Forecast Outlook 2025 to 2035
Paper Napkins Converting Machines Market Size and Share Forecast Outlook 2025 to 2035
Paper Coating Binders Market Size and Share Forecast Outlook 2025 to 2035
Core Plate Varnishes Market Size and Share Forecast Outlook 2025 to 2035
Paper Recycling Market Size and Share Forecast Outlook 2025 to 2035

Thank you!
You will receive an email from our Business Development Manager. Please be sure to check your SPAM/JUNK folder too.
Chat With
MaRIA