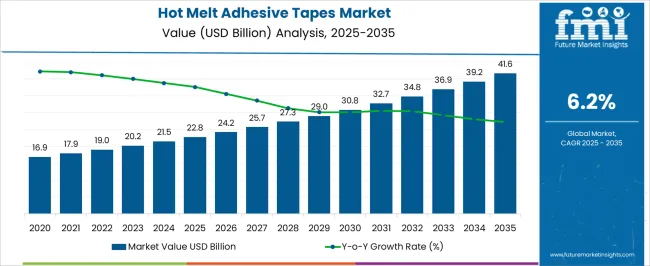
The Hot Melt Adhesive Tapes Market is estimated to be valued at USD 22.8 billion in 2025 and is projected to reach USD 41.6 billion by 2035, registering a compound annual growth rate (CAGR) of 6.2% over the forecast period.
| Metric | Value |
|---|---|
| Hot Melt Adhesive Tapes Market Estimated Value in (2025 E) | USD 22.8 billion |
| Hot Melt Adhesive Tapes Market Forecast Value in (2035 F) | USD 41.6 billion |
| Forecast CAGR (2025 to 2035) | 6.2% |
The hot melt adhesive tapes market is expanding steadily, driven by their increasing use in packaging, automotive, electronics, and construction industries. Industry publications and corporate announcements have highlighted the benefits of hot melt adhesive tapes, including strong bonding strength, quick setting time, and suitability for high-speed manufacturing lines. Rising demand for lightweight materials in automotive and electronics has further supported their adoption, as these tapes offer both structural reliability and design flexibility.
Manufacturers have also introduced advanced formulations resistant to temperature variations, chemicals, and moisture, broadening the application scope. Global supply chain modernization and the growth of e-commerce have stimulated packaging requirements, further reinforcing demand.
Sustainability trends have influenced producers to invest in recyclable materials and eco-friendly adhesive chemistries, aligning with tightening environmental regulations. Looking forward, the market is expected to benefit from ongoing technological advancements, wider end-use adoption, and increasing reliance on efficient bonding solutions in manufacturing.
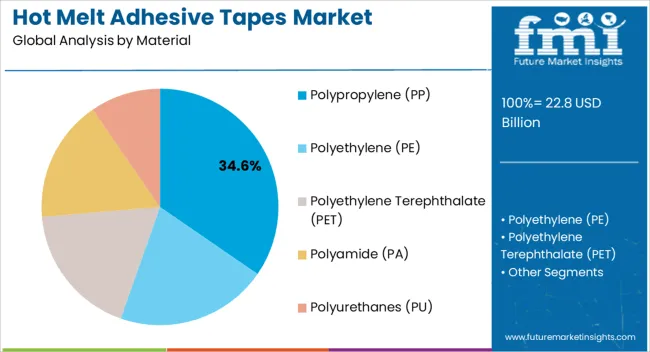
The Polypropylene (PP) segment is projected to account for 34.60% of the hot melt adhesive tapes market revenue in 2025, maintaining its leading role among materials. Growth of this segment has been supported by PP’s excellent balance of cost-effectiveness, tensile strength, and flexibility, which make it suitable for a wide range of industrial applications.
PP-based adhesive tapes are favored due to their resistance to moisture, chemicals, and wear, ensuring durability in demanding environments. Production scalability and wide availability of polypropylene as a raw material have further reinforced its market dominance.
Moreover, PP’s compatibility with various adhesive systems has allowed manufacturers to develop versatile tape solutions that meet the requirements of packaging, automotive, and electronics industries. With sustainability becoming a key priority, recyclable PP-based tapes are also gaining traction, securing the segment’s growth trajectory.
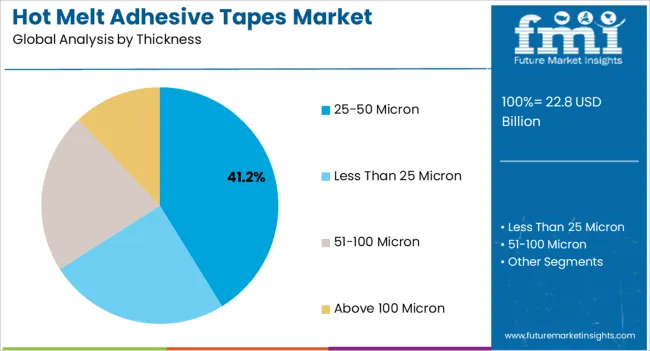
The 25–50 Micron segment is expected to contribute 41.20% of the hot melt adhesive tapes market revenue in 2025, establishing itself as the leading thickness category. This segment’s growth has been driven by its balance of strength, flexibility, and lightweight characteristics, making it ideal for applications where both performance and material efficiency are required.
Industry usage reports have shown that tapes within this thickness range provide reliable adhesion for medium-duty applications, particularly in automotive interiors, electronics assembly, and consumer packaging. Manufacturers have optimized production processes to deliver consistent quality in this range, catering to both large-scale industrial use and customized applications.
Additionally, the segment’s cost-effectiveness has positioned it as a preferred choice for industries seeking efficiency without compromising performance. As demand for lightweight yet durable bonding solutions increases, the 25–50 Micron segment is expected to retain its leadership position.
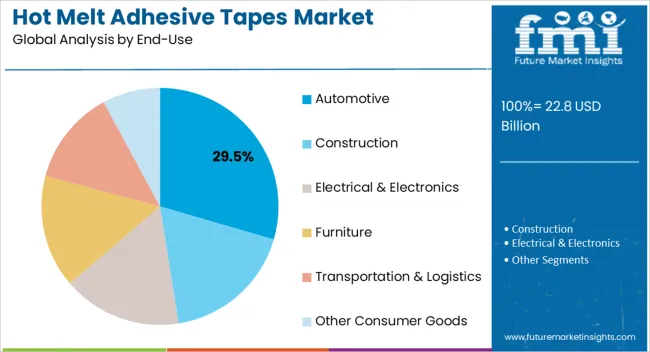
The Automotive segment is projected to capture 29.50% of the hot melt adhesive tapes market revenue in 2025, emerging as the leading end-use sector. Growth of this segment has been propelled by the rising adoption of lightweight bonding solutions in vehicle manufacturing and assembly.
Hot melt adhesive tapes have replaced traditional fastening methods in many areas due to their ability to reduce weight, enhance aesthetics, and simplify production processes. Automotive manufacturers have increasingly relied on these tapes for interior trims, wire harnessing, insulation, and surface protection.
Industry announcements have also underscored the growing demand for thermal and chemical-resistant adhesive tapes that withstand automotive operating conditions. The trend toward electric vehicles has further accelerated the need for high-performance tapes for battery assembly, insulation, and lightweight component bonding. These factors collectively support the automotive segment’s continued dominance in the market.
The global demand for hot melt adhesive tapes increased at a CAGR of 3.3% during the forecast period between 2020 and 2025, reaching a total of USD 41.6 billion in 2035. According to Future Market Insights, a market research and competitive intelligence provider, the hot melt adhesive tapes market was valued at USD 22.8 billion in 2025.
The electrical and electronics industry is one of the largest consumers of hot melt adhesive tapes, and its growth has a significant impact on the demand for these tapes. Hot melt adhesive tapes play a crucial role in various applications within this industry due to their unique properties and benefits.
Hot melt adhesive tapes are widely used for wire harnessing in electrical equipment and electronic devices. The tapes provide excellent insulation, protection, and bundling capabilities, ensuring that wires are organized and secure within the assembly. The use of hot melt adhesive tapes in wire harnessing reduces the risk of short circuits, enhances the overall safety of the electrical system, and simplifies the assembly process.
Hot melt adhesive tapes are used for attaching and mounting various components in electronic devices, such as sensors, PCBs (printed circuit boards), displays, and connectors. The tapes offer reliable bonding, which is critical to the performance and durability of electronic devices. Their ability to provide a strong and secure bond even on irregular or uneven surfaces makes them a preferred choice for component assembly in the electronics industry.
Hot melt adhesive tapes serve as excellent insulators for electrical components and connections. They provide a protective barrier against moisture, dust, and other environmental factors that could potentially damage sensitive electronics. The use of hot melt adhesive tapes ensures the longevity and reliability of electronic devices, even in challenging operating conditions.
Advancements in Material Science is Likely to be Beneficial for Market Growth
Advancements in material science have significantly contributed to the evolution of hot melt adhesive tapes, enabling them to meet the diverse and demanding requirements of modern industries. Manufacturers are continuously investing in research and development to explore innovative materials and formulations that enhance the overall performance and versatility of hot melt adhesive tapes.
One of the primary focuses of material advancements is to improve the adhesion properties of hot melt adhesive tapes. Adhesion refers to the ability of the tape to form a strong bond with different substrates, such as paper, cardboard, plastics, metals, and fabrics. Hot melt tapes can now achieve superior adhesion to a wide variety of surfaces, with the development of new adhesive formulations, even in challenging conditions.
Cohesion refers to the internal strength and bonding of the adhesive itself. Advancements in material science have led to the creation of tapes with increased cohesion, making them resistant to splitting, delamination, or weakening of the bond over time. Improved cohesion ensures that the tape maintains its integrity even under stress, providing reliable and durable bonding solutions.
The ability of hot melt adhesive tapes to withstand extreme temperatures is crucial, especially in industries such as automotive, electronics, and aerospace. Recent material advancements have resulted in tapes with enhanced temperature resistance, enabling them to perform well in both high and low-temperature environments without losing their adhesive properties.
Rise in eCommerce & Online Shopping to Fuel the Market Growth
The rise of e-commerce and online shopping has transformed the retail landscape, with consumers increasingly preferring the convenience of shopping from the comfort of their homes. There has been a significant surge in the demand for efficient and reliable packaging solutions to ensure the safe and secure delivery of products to customers' doorsteps.
Hot melt adhesive tapes have emerged as a preferred choice for e-commerce packaging due to their excellent bonding strength and secure sealing capabilities, addressing the unique requirements of the online retail industry.
One of the critical factors in e-commerce packaging is the need for secure sealing of packages to prevent damage and tampering during transit. Hot melt adhesive tapes offer strong bonding, ensuring that packages remain securely sealed throughout the shipping process. They create a durable bond between different surfaces, including cardboard boxes and plastics, reducing the risk of package opening or tearing.
Speed and efficiency are essential in the e-commerce industry, where large volumes of packages need to be processed and shipped quickly. Hot melt adhesive tapes are easy and quick to apply, which streamlines the packaging process and helps businesses meet the demands of fast-paced online retail operations.
Hot melt adhesive tapes come in various formulations and thicknesses, making them suitable for a wide range of packaging materials and substrates. They can effectively bond to different surfaces, including corrugated cardboard, plastic, paper, and other materials commonly used in e-commerce packaging.
Polypropylene (PP) to take the Lion’s Share
By material, polypropylene (PP) segment is estimated to be the leading segment at a CAGR of 6.4% during the forecast period. Polypropylene hot melt adhesive tapes offer excellent performance characteristics, including high tensile strength, good adhesion to various substrates, and resistance to moisture and chemicals. The properties make them suitable for a wide range of applications in industries such as packaging, automotive, electronics, and construction.
Polypropylene is a lightweight material, which is advantageous for reducing overall packaging weight and shipping costs. Polypropylene tapes are cost-effective compared to other materials, making them a popular choice for various applications where cost efficiency is crucial.
Polypropylene hot melt adhesive tapes provide strong bonding and sealing properties. They are used in carton sealing, box assembly, and other applications that require reliable and secure adhesion, ensuring that packaged goods remain intact during storage and transportation.
Polypropylene hot melt adhesive tapes can be easily applied using automated systems or handheld dispensers. The ease of application improves production efficiency and reduces the time required for packaging processes.
Electrical & Electronics to Take the Lion’s Share
Based on the end-use, the electrical & electronics segment holds the largest share of the market. The segment is expected to hold a CAGR of 6.4% during the forecast period. The electrical and electronics industry is witnessing a trend towards smaller and more compact devices. Hot melt adhesive tapes provide a reliable bonding solution for delicate and intricate components within electronic devices, ensuring secure attachment without adding significant weight or bulk.
Some hot melt adhesive tapes are designed with excellent thermal conductivity properties, making them suitable for applications that require efficient heat dissipation in electronic components such as circuit boards and heat sinks.
Hot melt adhesive tapes with insulating properties are used for electrical insulation purposes, safeguarding components from electrical currents and preventing short circuits. The tapes offer protection against environmental factors, such as moisture and dust.
The fast-curing properties of hot melt adhesive tapes facilitate rapid assembly and production processes in the electrical and electronics industry. The tapes can be applied quickly and securely, optimizing manufacturing efficiency.
Asia Pacific's emerging economies are anticipated to account for a major proportion of the hot melt adhesive tapes market over the analysis period. More than half of the Asia Pacific hot melt adhesive tapes market is acquired by China and India. The region is expected to hold a CAGR of 6.4% over the analysis period.
The burgeoning transport and logistics business in the region has also contributed to the region's growth. China is ranked 27th in the World Bank's Logistic Performance Index.
China represents new trade gateways between South America and Africa, enhancing the global logistics supply chain and benefiting the hot melt adhesive tapes market in the near future. During the forecast period, Latin America is expected to have a favorable impact on the hot melt adhesive tapes market.
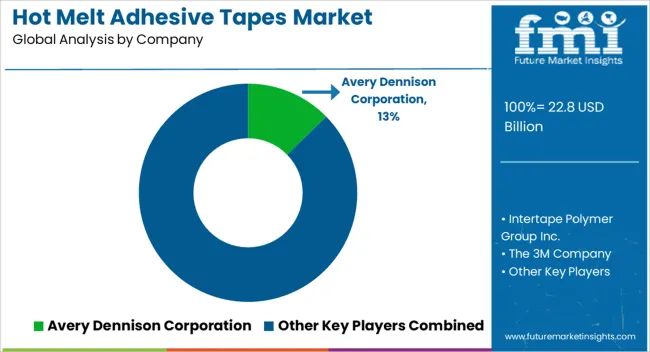
Key players in the hot melt adhesive tapes market are strongly focusing on profit generation from their existing product portfolios along while exploring potential new applications.
The players are emphasizing on increasing their hot melt adhesive tapes production capacities, to cater to the demand from numerous end use industries. Prominent players are also pushing for geographical expansion to decrease the dependency on imported hot melt adhesive tapes.
Recent Developments:
| Attribute | Details |
|---|---|
| Forecast Period | 2025 to 2035 |
| Historical Data Available for | 2020 to 2025 |
| Market Analysis | USD Billion for Value and Tons for Volume |
| Key Regions Covered | North America; Latin America; Western Europe; Eastern Europe; South Asia & Pacific; East Asia; Middle East & Africa |
| Key Countries Covered | United States, Canada, Brazil, Mexico, Germany, United Kingdom, France, Spain, Italy, Poland, Russia, Czech Republic, Romania, India, Bangladesh, Australia, New Zealand, China, Japan, South Korea, GCC Countries, South Africa, Israel |
| Key Segments Covered | Material, Thickness, End-Use, Region |
| Key Companies Profiled | Avery Dennison Corporation; Intertape Polymer Group Inc.; The 3M Company; Shurtape Technologies, LLC; Irplast S.p.A.; Mario Tapes; Hira Industries L.L.C; Scapa Group plc.; LINTEC Corporation; Intercol BV |
| Customization & Pricing | Available upon Request |
The global hot melt adhesive tapes market is estimated to be valued at USD 22.8 billion in 2025.
The market size for the hot melt adhesive tapes market is projected to reach USD 41.6 billion by 2035.
The hot melt adhesive tapes market is expected to grow at a 6.2% CAGR between 2025 and 2035.
The key product types in hot melt adhesive tapes market are polypropylene (pp), polyethylene (pe), polyethylene terephthalate (pet), polyamide (pa) and polyurethanes (pu).
In terms of thickness, 25-50 micron segment to command 41.2% share in the hot melt adhesive tapes market in 2025.


Our Research Products

The "Full Research Suite" delivers actionable market intel, deep dives on markets or technologies, so clients act faster, cut risk, and unlock growth.

The Leaderboard benchmarks and ranks top vendors, classifying them as Established Leaders, Leading Challengers, or Disruptors & Challengers.

Locates where complements amplify value and substitutes erode it, forecasting net impact by horizon

We deliver granular, decision-grade intel: market sizing, 5-year forecasts, pricing, adoption, usage, revenue, and operational KPIs—plus competitor tracking, regulation, and value chains—across 60 countries broadly.

Spot the shifts before they hit your P&L. We track inflection points, adoption curves, pricing moves, and ecosystem plays to show where demand is heading, why it is changing, and what to do next across high-growth markets and disruptive tech

Real-time reads of user behavior. We track shifting priorities, perceptions of today’s and next-gen services, and provider experience, then pace how fast tech moves from trial to adoption, blending buyer, consumer, and channel inputs with social signals (#WhySwitch, #UX).

Partner with our analyst team to build a custom report designed around your business priorities. From analysing market trends to assessing competitors or crafting bespoke datasets, we tailor insights to your needs.
Supplier Intelligence
Discovery & Profiling
Capacity & Footprint
Performance & Risk
Compliance & Governance
Commercial Readiness
Who Supplies Whom
Scorecards & Shortlists
Playbooks & Docs
Category Intelligence
Definition & Scope
Demand & Use Cases
Cost Drivers
Market Structure
Supply Chain Map
Trade & Policy
Operating Norms
Deliverables
Buyer Intelligence
Account Basics
Spend & Scope
Procurement Model
Vendor Requirements
Terms & Policies
Entry Strategy
Pain Points & Triggers
Outputs
Pricing Analysis
Benchmarks
Trends
Should-Cost
Indexation
Landed Cost
Commercial Terms
Deliverables
Brand Analysis
Positioning & Value Prop
Share & Presence
Customer Evidence
Go-to-Market
Digital & Reputation
Compliance & Trust
KPIs & Gaps
Outputs
Full Research Suite comprises of:
Market outlook & trends analysis
Interviews & case studies
Strategic recommendations
Vendor profiles & capabilities analysis
5-year forecasts
8 regions and 60+ country-level data splits
Market segment data splits
12 months of continuous data updates
DELIVERED AS:
PDF EXCEL ONLINE
Hot Melt Adhesives Market Growth - Trends & Forecast 2025 to 2035
Reactive Hot Melt Adhesive Market Forecast Outlook 2025 to 2035
Polyester Hot Melt Adhesives Market Size and Share Forecast Outlook 2025 to 2035
Hot Melt Intermediate Joint Market Size and Share Forecast Outlook 2025 to 2035
Hot Melt Equipment Market
Cloth Self-adhesive Tapes Market
Hot Air Sterilization Dust Mite Controller Market Size and Share Forecast Outlook 2025 to 2035
Hot and Cold System Market Forecast and Outlook 2025 to 2035
Adhesives for Electric Vehicle Power Batteries Market Forecast and Outlook 2025 to 2035
Hot Fill Packaging Market Size and Share Forecast Outlook 2025 to 2035
Melt Flow Meter Market Size and Share Forecast Outlook 2025 to 2035
Adhesive Films Market Size and Share Forecast Outlook 2025 to 2035
Hot Stamping Foil Market Size and Share Forecast Outlook 2025 to 2035
Melt Flow Tester Market Size and Share Forecast Outlook 2025 to 2035
Adhesive Tester Market Size and Share Forecast Outlook 2025 to 2035
Hot And Cold Therapy Packs Market Size and Share Forecast Outlook 2025 to 2035
Adhesives And Sealants Market Size and Share Forecast Outlook 2025 to 2035
Hotplate Stirrers Market Size and Share Forecast Outlook 2025 to 2035
Hot Runner Temperature Controller Market Size and Share Forecast Outlook 2025 to 2035
Hot Fill Food Packaging Market Size and Share Forecast Outlook 2025 to 2035

Thank you!
You will receive an email from our Business Development Manager. Please be sure to check your SPAM/JUNK folder too.
Chat With
MaRIA