Hot and Cold System Market Size and Share Forecast Outlook From 2024 to 2034

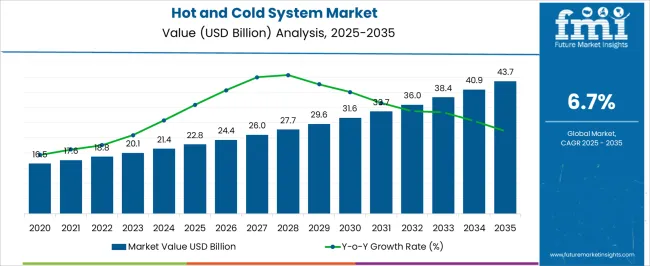
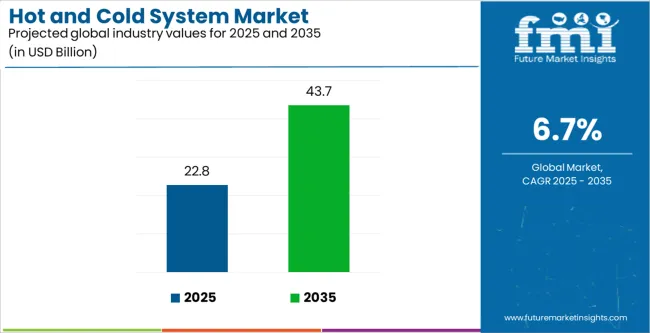
The global hot and cold system market size is projected to be USD 21.4 billion in 2024 and USD 41 billion by 2034. The forecasted CAGR for the global heating and cooling system market is 6.7% between 2024 and 2034.

Increased urbanization, problems posed by climate change, and rising awareness of sustainability and energy conservation contribute to the market growth of hot and cold systems. Things like expensive initial investments in sophisticated machinery and specific issues with hot and cold system performance constrain the hot and cold system market.

The hot and cold system industry is anticipated to grow due to the global trend toward smart and connected buildings and technology developments, such as IoT-enabled sensors and analytics tools with artificial intelligence.

Attributes Details
Market Value for 2024 USD 21.4 billion
Market Value for 2034 USD 41 billion
Market CAGR from 2024 to 2034 6.7%

Top Hot and Cold System Market Dynamics and Industry Trends

  • Global attention to sustainability and energy efficiency is increasing, fueling demand for hot and cold systems that meet strict guidelines and standards and promoting cutting-edge technologies.
  • The demand for hot and cold systems in commercial and residential buildings and industrial facilities is rising due to rapid urbanization and infrastructural development.
  • Greenhouse gas emissions are reduced, and eco-friendly alternatives are promoted by the growing demand for ecologically friendly heating and cooling systems due to growing knowledge of and worries about climate change.
  • The demand for hot and cold systems that offer ideal comfort levels and foster a healthier living and working environment is driven by growing knowledge of the effects of indoor environmental quality on health and well-being.
Attributes Details
Market Value for 2019 USD 14.4 billion
Market Value for 2023 USD 19.9 billion
Market CAGR from 2019 to 2023 8.4%

Factors Restraining the Demand for Hot and Cold Systems

  • Manufacturers of hot and cold systems have barriers because of strict requirements regarding energy efficiency, refrigerants, and environmental effects.
  • Technology is advancing quickly, which makes it problematic for hot and cold system vendors attempting to stay competitive, particularly if they lack the resources or know-how to adopt or develop new technologies.
  • In particular areas or industries, the adoption of hot and cold systems is restricted by inadequate infrastructure, such as obsolete electrical grids or a lack of dependable power sources.
  • Potential customers' ignorance of the advantages and correct operation of hot and cold systems restricts market expansion and adoption rates.

Hot and Cold System Industry Analysis by Top Investment Segments

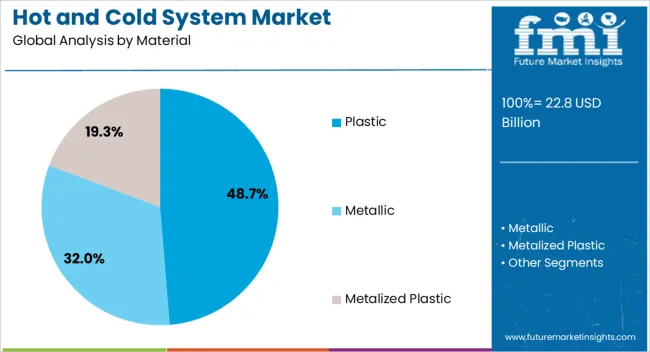
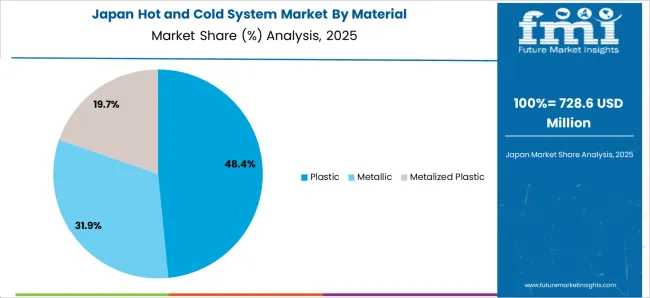
The following part provides a fully segmented market analysis of hot and cold systems based on extensive research. Based on a significant body of research, the plastics sector is the front-runner in the material category.

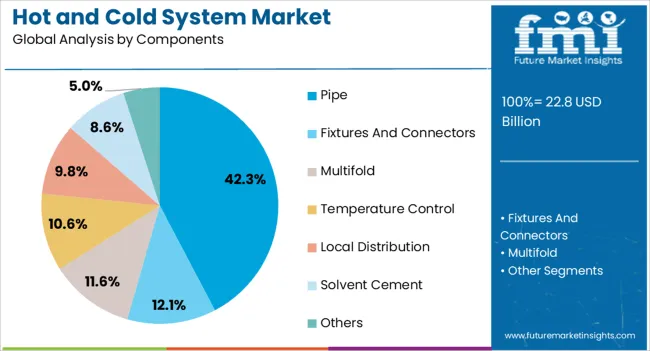
Pipe is the most dominant sector in the component category, indicating a strong market presence. The present analysis highlights the crucial functions of plastic materials and pipe components in hot and cold systems, influencing market dynamics and trends.

Plastic Dominates Hot and Cold System Material Sales

Attributes Details
Top Material Plastic
CAGR % 2019 to 2023 8.2%
CAGR % 2024 to End of Forecast (2034) 6.5%
  • Good corrosion resistance means that plastic materials survive longer and are more durable in various working situations, reducing maintenance costs.
  • Plastic's flexible nature makes it simple to modify and adjust to different system configurations, improving overall performance.
  • Since plastic materials are widely available, supply chains are regularly dependable, allowing firms to maintain their production schedules.

Pipes as the Crucial Element in Hot and Cold Systems

Attributes Details
Top Component Pipe
CAGR % 2019 to 2023 8.0%
CAGR % 2024 to End of Forecast (2034) 6.3%
  • Pipes are a primary component that connects the different parts of the system and makes sure that hot and cold fluids are transmitted smoothly throughout the network.
  • Pipes' adaptability to various settings and configurations increases their versatility, meeting a range of business requirements and allowing for flexible integration into a variety of hot and cold system configurations.
  • Pipes are a popular alternative for hot and cold system vendors that prioritize efficiency since they are utilized to deploy systems at a reasonable cost without sacrificing performance.

Analysis of Top Countries Producing, Formulating, Packaging, Distributing, and Using Hot and Cold Systems

The hot and cold system market can be observed in the subsequent tables, which focus on the leading economies in the United Kingdom, Japan, China, the United States, and South Korea. A comprehensive evaluation demonstrates that the United Kingdom has enormous opportunities.
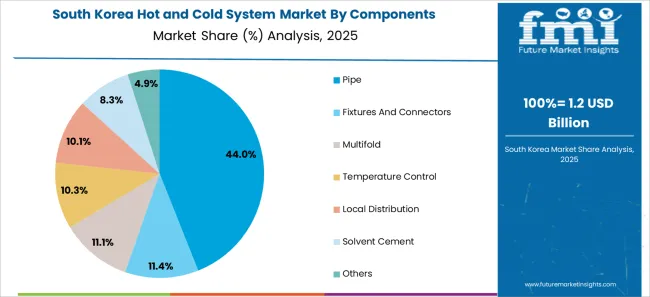
Sustainable Heating and Cooling in South Korea

Country South Korea
HCAGR (2019 to 2023) 14.3%
CAGR (2024 to 2034) 9.0%
  • High-efficiency heating and cooling technologies are becoming increasingly popular in South Korea, which is attributable to government measures encouraging energy conservation.
  • South Korea heating and cooling system market to reach a worth of USD 2.7 billion by 2034.
  • The adoption of sustainable heating and cooling solutions in building projects is rising in South Korea due to the country's dedication to green building requirements.
  • The hot and cold system industry in South Korea is seeing a surge in demand for innovative air filtration technology due to growing consumer awareness of air pollution.

Aging Population Spurs Demand for Health-Conscious Climate Control in Japan

Nation Japan
HCAGR (2019 to 2023) 11.9%
CAGR (2024 to 2034) 8.1%
  • Japan's seismic activity impacts HVAC system design and construction, making earthquake-resistant and robust solutions more desirable.
  • The aging demographic in Japan is increasing demand for climate control systems with improved air quality features to satisfy customers concerned about their health.
  • Japan heating and cooling system market to attain a worth of USD 4.5 billion by 2034.
  • In Japan, the hot and cold system industry is experiencing a rise in technological innovations like the incorporation of Artificial Intelligence (AI) in HVAC systems.

Carbon Reduction Initiatives Shape the Landscape of Heating and Cooling in the United Kingdom

Nation United Kingdom
HCAGR (2019 to 2023) 11.6%
CAGR (2024 to 2034) 8.0%
  • An increasing emphasis on carbon reduction programs compels the United Kingdom's adoption of sophisticated heating and cooling systems.
  • The United Kingdom heating and cooling system market is likely to achieve a valuation of USD 1.7 billion by 2034.
  • The need for intelligent climate control solutions in the hot and cold system market in the United Kingdom is increasing due to the growing trend of smart homes.
  • Advancement in the United Kingdom's hot and cold system market is stimulated by government incentives that support renewable energy sources.

Urban Expansion Fuels Demand for Efficient Heating and Cooling in China

Nation China
HCAGR (2019 to 2023) 10.4%
CAGR (2024 to 2034) 7.8%
  • Energy management and efficiency are strengthened through the integration of IoT-enabled heating and cooling systems, which is encouraged by smart city projects.
  • The development of energy-efficient air conditioning systems for electric automobiles is influenced by China's efforts to become a global leader in electric vehicle technology.
  • China heating and cooling system market to surpass a worth of USD 6.7 billion by 2034.
  • Rapid urbanization in China propels the demand for hot and cold systems, creating a greater need for effective heating and cooling solutions in growing cities.

Smart Thermostats and Automation in the United States Heating and Cooling System

Nation United States
HCAGR (2019 to 2023) 9.2%
CAGR (2024 to 2034) 7.0%
  • The United States residential heating and cooling market is evolving due to smart thermostats and home automation.
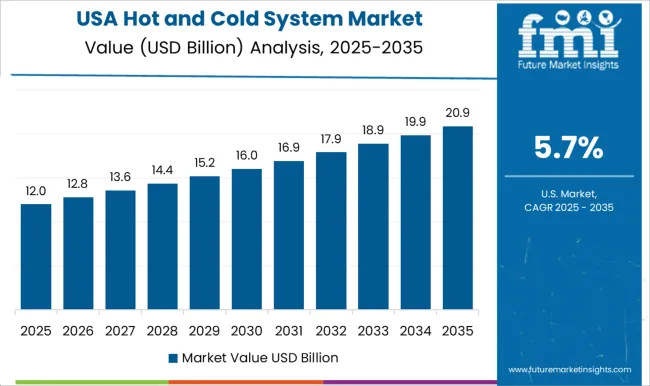
  • The United States heating and cooling system market to hit a valuation of USD 7.4 billion by 2034.
  • In the United States, strict building rules and energy-efficiency criteria are having an impact on how heating and cooling systems are designed and installed.
  • In the United States market, the development of sustainable HVAC systems is impacted by the move towards renewable energy sources like solar and geothermal.

Leading Suppliers of Hot and Cold Systems

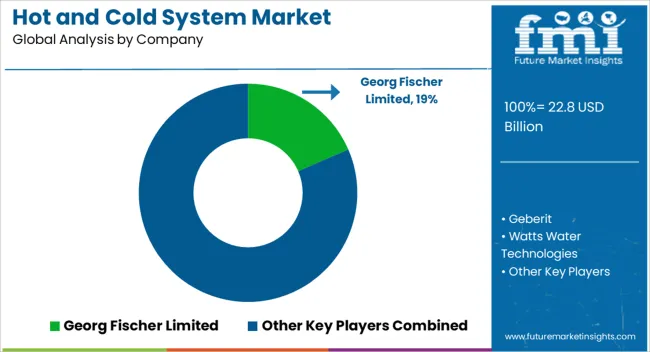
Prominent producers of hot and cold systems dominate the market, creating a competitive landscape. Notable hot and cold system vendors influencing the industry dynamics include Georg, Fischer Limited, Geberit, Watts Water Technologies, Chevron Phillips Chemical LLC, and Wienerberger. These hot and cold system manufacturers are essential to fostering innovation, guaranteeing the products' quality, and satisfying the wide range of consumer demands.

Georg, a trusted hot and cold system supplier recognized for its technological innovations, competes with Fischer Limited. Geberit is known for its creative ideas as part of the competitive mix, while Watts Water Technologies is distinguished by its dedication to environmentally friendly methods. Wienerberger and Chevron Phillips Chemical LLC contribute their knowledge, enhancing the ecology of competition even further.

These hot and cold system providers fight for market share in this competitive sector, going above and beyond to improve the sustainability and efficiency of hot and cold system solutions. Ongoing research and development initiatives, strategic alliances, and a commitment to satisfying changing client needs characterize the competitive landscape of the hot and cold system industry.

With innovation and dependability, the hot and cold system market continues to shift as these main providers take advantage of new opportunities and manage industry problems.

Notable Developments

Company Details
Zypho In May 2023, Zypho, a Portuguese tech business pioneer in drain water heat recovery technologies, was bought by Aliaxis SA. Aliaxis's market position is strengthened, and its product line of energy-efficient goods is expanded through this strategic purchase. Innovative products have been produced due to Aliaxis and Zypho's collaboration. One such product is the horizontal heat recovery unit, sold in France, the United Kingdom, and Spain.
Toolstation To provide clients with a selection of expertly designed water control valves, Toolstation teamed up with Reliance Worldwide Corporation (RWC) in March 2023. Reliance Valves is an expert in temperature, pressure, and combination valves that safeguard heating and hot and cold-water systems. Through this partnership, RWC hopes to supply effective water control valves for residential and light-duty businesses.
InukshukSynergie The Canadian government announced in August 2021 that InukshukSynergie would receive a USD 165,000 award through the Department of Natural Resources Canada to help commercialize their biomass-based heating systems.
Japanese Government In 2020, the Japanese government passed the Renewable Energy Act to encourage the development of renewable energy plants. During this period, the statute's most recent revisions were put into effect.

Leading Hot and Cold System Manufacturers by Market Share

  • Georg
  • Fischer Limited
  • Geberit
  • Watts Water Technologies
  • Chevron Phillips
  • Chemical LLC
  • Wienerberger

Scope and Coverage of the Hot and Cold System Market Report

By Material:

  • Plastic
  • Metallic
  • Metalized Plastic

By Components:

  • Pipe
  • Fixtures and connectors
  • Multifold
  • Temperature Control
  • Local distribution
  • Solvent Cement
  • Others

By Application:

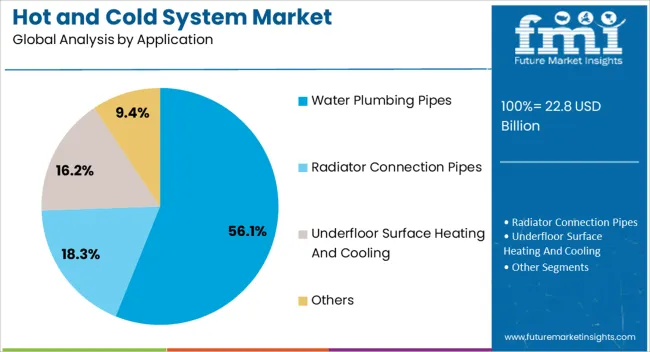
  • Water plumbing pipes
  • Radiator connection pipes
  • Underfloor surface heating and cooling
  • Others

By End Users:

  • Residential
  • Commercial
  • Industrial

By Region:

  • North America
  • Latin America
  • Europe
  • East Asia
  • South Asia and the Pacific
  • Middle East and Africa

Table of Content

  • 1. Executive Summary
  • 2. Market Overview
  • 3. Market Background
  • 4. Global Market Analysis 2019 to 2023 and Forecast, 2024 to 2034
  • 5. Global Market Analysis 2019 to 2023 and Forecast 2024 to 2034, By Material
    • 5.1. Plastic
    • 5.2. Metallic
    • 5.3. Metalized Plastic
  • 6. Global Market Analysis 2019 to 2023 and Forecast 2024 to 2034, By Components
    • 6.1. Pipe
    • 6.2. Fixtures & connectors
    • 6.3. Multifold
    • 6.4. Temperature Control
    • 6.5. Local distribution
    • 6.6. Solvent Cement
    • 6.7. Others
  • 7. Global Market Analysis 2019 to 2023 and Forecast 2024 to 2034, By Application
    • 7.1. Water plumbing pipes
    • 7.2. Radiator connection pipes
    • 7.3. Underfloor surface heating & cooling
    • 7.4. Others
  • 8. Global Market Analysis 2019 to 2023 and Forecast 2024 to 2034, By End-users
    • 8.1. Residential
    • 8.2. Commercial
    • 8.3. Industrial
  • 9. Global Market Analysis 2019 to 2023 and Forecast 2024 to 2034, By Region
    • 9.1. North America
    • 9.2. Latin America
    • 9.3. Europe
    • 9.4. East Asia
    • 9.5. South Asia
    • 9.6. Oceania
    • 9.7. MEA
  • 10. North America Market Analysis 2019 to 2023 and Forecast 2024 to 2034, By Country
  • 11. Latin America Market Analysis 2019 to 2023 and Forecast 2024 to 2034, By Country
  • 12. Europe Market Analysis 2019 to 2023 and Forecast 2024 to 2034, By Country
  • 13. East Asia Market Analysis 2019 to 2023 and Forecast 2024 to 2034, By Country
  • 14. South Asia Market Analysis 2019 to 2023 and Forecast 2024 to 2034, By Country
  • 15. Oceania Market Analysis 2019 to 2023 and Forecast 2024 to 2034, By Country
  • 16. MEA Market Analysis 2019 to 2023 and Forecast 2024 to 2034, By Country
  • 17. Key Countries Market Analysis
  • 18. Market Structure Analysis
  • 19. Competition Analysis
    • 19.1. Georg Fischer Limited
    • 19.2. Geberit
    • 19.3. Watts Water Technologies
    • 19.4. Chevron Phillips Chemical LLC
    • 19.5. Wienerberger
    • 19.6. Aalberts
    • 19.7. Aliaxis
    • 19.8. Lesso
    • 19.9. Rehau
    • 19.10. Zurn
  • 20. Assumptions & Acronyms Used
  • 21. Research Methodology

List of Tables

Table 1: Global Market Value (US$ Million) Forecast by Region, 2019 to 2034

Table 2: Global Market Volume (Units) Forecast by Region, 2019 to 2034

Table 3: Global Market Value (US$ Million) Forecast by Material, 2019 to 2034

Table 4: Global Market Volume (Units) Forecast by Material, 2019 to 2034

Table 5: Global Market Value (US$ Million) Forecast by Components, 2019 to 2034

Table 6: Global Market Volume (Units) Forecast by Components, 2019 to 2034

Table 7: Global Market Value (US$ Million) Forecast by Application, 2019 to 2034

Table 8: Global Market Volume (Units) Forecast by Application, 2019 to 2034

Table 9: Global Market Value (US$ Million) Forecast by End-users, 2019 to 2034

Table 10: Global Market Volume (Units) Forecast by End-users, 2019 to 2034

Table 11: North America Market Value (US$ Million) Forecast by Country, 2019 to 2034

Table 12: North America Market Volume (Units) Forecast by Country, 2019 to 2034

Table 13: North America Market Value (US$ Million) Forecast by Material, 2019 to 2034

Table 14: North America Market Volume (Units) Forecast by Material, 2019 to 2034

Table 15: North America Market Value (US$ Million) Forecast by Components, 2019 to 2034

Table 16: North America Market Volume (Units) Forecast by Components, 2019 to 2034

Table 17: North America Market Value (US$ Million) Forecast by Application, 2019 to 2034

Table 18: North America Market Volume (Units) Forecast by Application, 2019 to 2034

Table 19: North America Market Value (US$ Million) Forecast by End-users, 2019 to 2034

Table 20: North America Market Volume (Units) Forecast by End-users, 2019 to 2034

Table 21: Latin America Market Value (US$ Million) Forecast by Country, 2019 to 2034

Table 22: Latin America Market Volume (Units) Forecast by Country, 2019 to 2034

Table 23: Latin America Market Value (US$ Million) Forecast by Material, 2019 to 2034

Table 24: Latin America Market Volume (Units) Forecast by Material, 2019 to 2034

Table 25: Latin America Market Value (US$ Million) Forecast by Components, 2019 to 2034

Table 26: Latin America Market Volume (Units) Forecast by Components, 2019 to 2034

Table 27: Latin America Market Value (US$ Million) Forecast by Application, 2019 to 2034

Table 28: Latin America Market Volume (Units) Forecast by Application, 2019 to 2034

Table 29: Latin America Market Value (US$ Million) Forecast by End-users, 2019 to 2034

Table 30: Latin America Market Volume (Units) Forecast by End-users, 2019 to 2034

Table 31: Europe Market Value (US$ Million) Forecast by Country, 2019 to 2034

Table 32: Europe Market Volume (Units) Forecast by Country, 2019 to 2034

Table 33: Europe Market Value (US$ Million) Forecast by Material, 2019 to 2034

Table 34: Europe Market Volume (Units) Forecast by Material, 2019 to 2034

Table 35: Europe Market Value (US$ Million) Forecast by Components, 2019 to 2034

Table 36: Europe Market Volume (Units) Forecast by Components, 2019 to 2034

Table 37: Europe Market Value (US$ Million) Forecast by Application, 2019 to 2034

Table 38: Europe Market Volume (Units) Forecast by Application, 2019 to 2034

Table 39: Europe Market Value (US$ Million) Forecast by End-users, 2019 to 2034

Table 40: Europe Market Volume (Units) Forecast by End-users, 2019 to 2034

Table 41: East Asia Market Value (US$ Million) Forecast by Country, 2019 to 2034

Table 42: East Asia Market Volume (Units) Forecast by Country, 2019 to 2034

Table 43: East Asia Market Value (US$ Million) Forecast by Material, 2019 to 2034

Table 44: East Asia Market Volume (Units) Forecast by Material, 2019 to 2034

Table 45: East Asia Market Value (US$ Million) Forecast by Components, 2019 to 2034

Table 46: East Asia Market Volume (Units) Forecast by Components, 2019 to 2034

Table 47: East Asia Market Value (US$ Million) Forecast by Application, 2019 to 2034

Table 48: East Asia Market Volume (Units) Forecast by Application, 2019 to 2034

Table 49: East Asia Market Value (US$ Million) Forecast by End-users, 2019 to 2034

Table 50: East Asia Market Volume (Units) Forecast by End-users, 2019 to 2034

Table 51: South Asia Market Value (US$ Million) Forecast by Country, 2019 to 2034

Table 52: South Asia Market Volume (Units) Forecast by Country, 2019 to 2034

Table 53: South Asia Market Value (US$ Million) Forecast by Material, 2019 to 2034

Table 54: South Asia Market Volume (Units) Forecast by Material, 2019 to 2034

Table 55: South Asia Market Value (US$ Million) Forecast by Components, 2019 to 2034

Table 56: South Asia Market Volume (Units) Forecast by Components, 2019 to 2034

Table 57: South Asia Market Value (US$ Million) Forecast by Application, 2019 to 2034

Table 58: South Asia Market Volume (Units) Forecast by Application, 2019 to 2034

Table 59: South Asia Market Value (US$ Million) Forecast by End-users, 2019 to 2034

Table 60: South Asia Market Volume (Units) Forecast by End-users, 2019 to 2034

Table 61: Oceania Market Value (US$ Million) Forecast by Country, 2019 to 2034

Table 62: Oceania Market Volume (Units) Forecast by Country, 2019 to 2034

Table 63: Oceania Market Value (US$ Million) Forecast by Material, 2019 to 2034

Table 64: Oceania Market Volume (Units) Forecast by Material, 2019 to 2034

Table 65: Oceania Market Value (US$ Million) Forecast by Components, 2019 to 2034

Table 66: Oceania Market Volume (Units) Forecast by Components, 2019 to 2034

Table 67: Oceania Market Value (US$ Million) Forecast by Application, 2019 to 2034

Table 68: Oceania Market Volume (Units) Forecast by Application, 2019 to 2034

Table 69: Oceania Market Value (US$ Million) Forecast by End-users, 2019 to 2034

Table 70: Oceania Market Volume (Units) Forecast by End-users, 2019 to 2034

Table 71: MEA Market Value (US$ Million) Forecast by Country, 2019 to 2034

Table 72: MEA Market Volume (Units) Forecast by Country, 2019 to 2034

Table 73: MEA Market Value (US$ Million) Forecast by Material, 2019 to 2034

Table 74: MEA Market Volume (Units) Forecast by Material, 2019 to 2034

Table 75: MEA Market Value (US$ Million) Forecast by Components, 2019 to 2034

Table 76: MEA Market Volume (Units) Forecast by Components, 2019 to 2034

Table 77: MEA Market Value (US$ Million) Forecast by Application, 2019 to 2034

Table 78: MEA Market Volume (Units) Forecast by Application, 2019 to 2034

Table 79: MEA Market Value (US$ Million) Forecast by End-users, 2019 to 2034

Table 80: MEA Market Volume (Units) Forecast by End-users, 2019 to 2034

List of Figures

Figure 1: Global Market Value (US$ Million) by Material, 2024 to 2034

Figure 2: Global Market Value (US$ Million) by Components, 2024 to 2034

Figure 3: Global Market Value (US$ Million) by Application, 2024 to 2034

Figure 4: Global Market Value (US$ Million) by End-users, 2024 to 2034

Figure 5: Global Market Value (US$ Million) by Region, 2024 to 2034

Figure 6: Global Market Value (US$ Million) Analysis by Region, 2019 to 2034

Figure 7: Global Market Volume (Units) Analysis by Region, 2019 to 2034

Figure 8: Global Market Value Share (%) and BPS Analysis by Region, 2024 to 2034

Figure 9: Global Market Y-o-Y Growth (%) Projections by Region, 2024 to 2034

Figure 10: Global Market Value (US$ Million) Analysis by Material, 2019 to 2034

Figure 11: Global Market Volume (Units) Analysis by Material, 2019 to 2034

Figure 12: Global Market Value Share (%) and BPS Analysis by Material, 2024 to 2034

Figure 13: Global Market Y-o-Y Growth (%) Projections by Material, 2024 to 2034

Figure 14: Global Market Value (US$ Million) Analysis by Components, 2019 to 2034

Figure 15: Global Market Volume (Units) Analysis by Components, 2019 to 2034

Figure 16: Global Market Value Share (%) and BPS Analysis by Components, 2024 to 2034

Figure 17: Global Market Y-o-Y Growth (%) Projections by Components, 2024 to 2034

Figure 18: Global Market Value (US$ Million) Analysis by Application, 2019 to 2034

Figure 19: Global Market Volume (Units) Analysis by Application, 2019 to 2034

Figure 20: Global Market Value Share (%) and BPS Analysis by Application, 2024 to 2034

Figure 21: Global Market Y-o-Y Growth (%) Projections by Application, 2024 to 2034

Figure 22: Global Market Value (US$ Million) Analysis by End-users, 2019 to 2034

Figure 23: Global Market Volume (Units) Analysis by End-users, 2019 to 2034

Figure 24: Global Market Value Share (%) and BPS Analysis by End-users, 2024 to 2034

Figure 25: Global Market Y-o-Y Growth (%) Projections by End-users, 2024 to 2034

Figure 26: Global Market Attractiveness by Material, 2024 to 2034

Figure 27: Global Market Attractiveness by Components, 2024 to 2034

Figure 28: Global Market Attractiveness by Application, 2024 to 2034

Figure 29: Global Market Attractiveness by End-users, 2024 to 2034

Figure 30: Global Market Attractiveness by Region, 2024 to 2034

Figure 31: North America Market Value (US$ Million) by Material, 2024 to 2034

Figure 32: North America Market Value (US$ Million) by Components, 2024 to 2034

Figure 33: North America Market Value (US$ Million) by Application, 2024 to 2034

Figure 34: North America Market Value (US$ Million) by End-users, 2024 to 2034

Figure 35: North America Market Value (US$ Million) by Country, 2024 to 2034

Figure 36: North America Market Value (US$ Million) Analysis by Country, 2019 to 2034

Figure 37: North America Market Volume (Units) Analysis by Country, 2019 to 2034

Figure 38: North America Market Value Share (%) and BPS Analysis by Country, 2024 to 2034

Figure 39: North America Market Y-o-Y Growth (%) Projections by Country, 2024 to 2034

Figure 40: North America Market Value (US$ Million) Analysis by Material, 2019 to 2034

Figure 41: North America Market Volume (Units) Analysis by Material, 2019 to 2034

Figure 42: North America Market Value Share (%) and BPS Analysis by Material, 2024 to 2034

Figure 43: North America Market Y-o-Y Growth (%) Projections by Material, 2024 to 2034

Figure 44: North America Market Value (US$ Million) Analysis by Components, 2019 to 2034

Figure 45: North America Market Volume (Units) Analysis by Components, 2019 to 2034

Figure 46: North America Market Value Share (%) and BPS Analysis by Components, 2024 to 2034

Figure 47: North America Market Y-o-Y Growth (%) Projections by Components, 2024 to 2034

Figure 48: North America Market Value (US$ Million) Analysis by Application, 2019 to 2034

Figure 49: North America Market Volume (Units) Analysis by Application, 2019 to 2034

Figure 50: North America Market Value Share (%) and BPS Analysis by Application, 2024 to 2034

Figure 51: North America Market Y-o-Y Growth (%) Projections by Application, 2024 to 2034

Figure 52: North America Market Value (US$ Million) Analysis by End-users, 2019 to 2034

Figure 53: North America Market Volume (Units) Analysis by End-users, 2019 to 2034

Figure 54: North America Market Value Share (%) and BPS Analysis by End-users, 2024 to 2034

Figure 55: North America Market Y-o-Y Growth (%) Projections by End-users, 2024 to 2034

Figure 56: North America Market Attractiveness by Material, 2024 to 2034

Figure 57: North America Market Attractiveness by Components, 2024 to 2034

Figure 58: North America Market Attractiveness by Application, 2024 to 2034

Figure 59: North America Market Attractiveness by End-users, 2024 to 2034

Figure 60: North America Market Attractiveness by Country, 2024 to 2034

Figure 61: Latin America Market Value (US$ Million) by Material, 2024 to 2034

Figure 62: Latin America Market Value (US$ Million) by Components, 2024 to 2034

Figure 63: Latin America Market Value (US$ Million) by Application, 2024 to 2034

Figure 64: Latin America Market Value (US$ Million) by End-users, 2024 to 2034

Figure 65: Latin America Market Value (US$ Million) by Country, 2024 to 2034

Figure 66: Latin America Market Value (US$ Million) Analysis by Country, 2019 to 2034

Figure 67: Latin America Market Volume (Units) Analysis by Country, 2019 to 2034

Figure 68: Latin America Market Value Share (%) and BPS Analysis by Country, 2024 to 2034

Figure 69: Latin America Market Y-o-Y Growth (%) Projections by Country, 2024 to 2034

Figure 70: Latin America Market Value (US$ Million) Analysis by Material, 2019 to 2034

Figure 71: Latin America Market Volume (Units) Analysis by Material, 2019 to 2034

Figure 72: Latin America Market Value Share (%) and BPS Analysis by Material, 2024 to 2034

Figure 73: Latin America Market Y-o-Y Growth (%) Projections by Material, 2024 to 2034

Figure 74: Latin America Market Value (US$ Million) Analysis by Components, 2019 to 2034

Figure 75: Latin America Market Volume (Units) Analysis by Components, 2019 to 2034

Figure 76: Latin America Market Value Share (%) and BPS Analysis by Components, 2024 to 2034

Figure 77: Latin America Market Y-o-Y Growth (%) Projections by Components, 2024 to 2034

Figure 78: Latin America Market Value (US$ Million) Analysis by Application, 2019 to 2034

Figure 79: Latin America Market Volume (Units) Analysis by Application, 2019 to 2034

Figure 80: Latin America Market Value Share (%) and BPS Analysis by Application, 2024 to 2034

Figure 81: Latin America Market Y-o-Y Growth (%) Projections by Application, 2024 to 2034

Figure 82: Latin America Market Value (US$ Million) Analysis by End-users, 2019 to 2034

Figure 83: Latin America Market Volume (Units) Analysis by End-users, 2019 to 2034

Figure 84: Latin America Market Value Share (%) and BPS Analysis by End-users, 2024 to 2034

Figure 85: Latin America Market Y-o-Y Growth (%) Projections by End-users, 2024 to 2034

Figure 86: Latin America Market Attractiveness by Material, 2024 to 2034

Figure 87: Latin America Market Attractiveness by Components, 2024 to 2034

Figure 88: Latin America Market Attractiveness by Application, 2024 to 2034

Figure 89: Latin America Market Attractiveness by End-users, 2024 to 2034

Figure 90: Latin America Market Attractiveness by Country, 2024 to 2034

Figure 91: Europe Market Value (US$ Million) by Material, 2024 to 2034

Figure 92: Europe Market Value (US$ Million) by Components, 2024 to 2034

Figure 93: Europe Market Value (US$ Million) by Application, 2024 to 2034

Figure 94: Europe Market Value (US$ Million) by End-users, 2024 to 2034

Figure 95: Europe Market Value (US$ Million) by Country, 2024 to 2034

Figure 96: Europe Market Value (US$ Million) Analysis by Country, 2019 to 2034

Figure 97: Europe Market Volume (Units) Analysis by Country, 2019 to 2034

Figure 98: Europe Market Value Share (%) and BPS Analysis by Country, 2024 to 2034

Figure 99: Europe Market Y-o-Y Growth (%) Projections by Country, 2024 to 2034

Figure 100: Europe Market Value (US$ Million) Analysis by Material, 2019 to 2034

Figure 101: Europe Market Volume (Units) Analysis by Material, 2019 to 2034

Figure 102: Europe Market Value Share (%) and BPS Analysis by Material, 2024 to 2034

Figure 103: Europe Market Y-o-Y Growth (%) Projections by Material, 2024 to 2034

Figure 104: Europe Market Value (US$ Million) Analysis by Components, 2019 to 2034

Figure 105: Europe Market Volume (Units) Analysis by Components, 2019 to 2034

Figure 106: Europe Market Value Share (%) and BPS Analysis by Components, 2024 to 2034

Figure 107: Europe Market Y-o-Y Growth (%) Projections by Components, 2024 to 2034

Figure 108: Europe Market Value (US$ Million) Analysis by Application, 2019 to 2034

Figure 109: Europe Market Volume (Units) Analysis by Application, 2019 to 2034

Figure 110: Europe Market Value Share (%) and BPS Analysis by Application, 2024 to 2034

Figure 111: Europe Market Y-o-Y Growth (%) Projections by Application, 2024 to 2034

Figure 112: Europe Market Value (US$ Million) Analysis by End-users, 2019 to 2034

Figure 113: Europe Market Volume (Units) Analysis by End-users, 2019 to 2034

Figure 114: Europe Market Value Share (%) and BPS Analysis by End-users, 2024 to 2034

Figure 115: Europe Market Y-o-Y Growth (%) Projections by End-users, 2024 to 2034

Figure 116: Europe Market Attractiveness by Material, 2024 to 2034

Figure 117: Europe Market Attractiveness by Components, 2024 to 2034

Figure 118: Europe Market Attractiveness by Application, 2024 to 2034

Figure 119: Europe Market Attractiveness by End-users, 2024 to 2034

Figure 120: Europe Market Attractiveness by Country, 2024 to 2034

Figure 121: East Asia Market Value (US$ Million) by Material, 2024 to 2034

Figure 122: East Asia Market Value (US$ Million) by Components, 2024 to 2034

Figure 123: East Asia Market Value (US$ Million) by Application, 2024 to 2034

Figure 124: East Asia Market Value (US$ Million) by End-users, 2024 to 2034

Figure 125: East Asia Market Value (US$ Million) by Country, 2024 to 2034

Figure 126: East Asia Market Value (US$ Million) Analysis by Country, 2019 to 2034

Figure 127: East Asia Market Volume (Units) Analysis by Country, 2019 to 2034

Figure 128: East Asia Market Value Share (%) and BPS Analysis by Country, 2024 to 2034

Figure 129: East Asia Market Y-o-Y Growth (%) Projections by Country, 2024 to 2034

Figure 130: East Asia Market Value (US$ Million) Analysis by Material, 2019 to 2034

Figure 131: East Asia Market Volume (Units) Analysis by Material, 2019 to 2034

Figure 132: East Asia Market Value Share (%) and BPS Analysis by Material, 2024 to 2034

Figure 133: East Asia Market Y-o-Y Growth (%) Projections by Material, 2024 to 2034

Figure 134: East Asia Market Value (US$ Million) Analysis by Components, 2019 to 2034

Figure 135: East Asia Market Volume (Units) Analysis by Components, 2019 to 2034

Figure 136: East Asia Market Value Share (%) and BPS Analysis by Components, 2024 to 2034

Figure 137: East Asia Market Y-o-Y Growth (%) Projections by Components, 2024 to 2034

Figure 138: East Asia Market Value (US$ Million) Analysis by Application, 2019 to 2034

Figure 139: East Asia Market Volume (Units) Analysis by Application, 2019 to 2034

Figure 140: East Asia Market Value Share (%) and BPS Analysis by Application, 2024 to 2034

Figure 141: East Asia Market Y-o-Y Growth (%) Projections by Application, 2024 to 2034

Figure 142: East Asia Market Value (US$ Million) Analysis by End-users, 2019 to 2034

Figure 143: East Asia Market Volume (Units) Analysis by End-users, 2019 to 2034

Figure 144: East Asia Market Value Share (%) and BPS Analysis by End-users, 2024 to 2034

Figure 145: East Asia Market Y-o-Y Growth (%) Projections by End-users, 2024 to 2034

Figure 146: East Asia Market Attractiveness by Material, 2024 to 2034

Figure 147: East Asia Market Attractiveness by Components, 2024 to 2034

Figure 148: East Asia Market Attractiveness by Application, 2024 to 2034

Figure 149: East Asia Market Attractiveness by End-users, 2024 to 2034

Figure 150: East Asia Market Attractiveness by Country, 2024 to 2034

Figure 151: South Asia Market Value (US$ Million) by Material, 2024 to 2034

Figure 152: South Asia Market Value (US$ Million) by Components, 2024 to 2034

Figure 153: South Asia Market Value (US$ Million) by Application, 2024 to 2034

Figure 154: South Asia Market Value (US$ Million) by End-users, 2024 to 2034

Figure 155: South Asia Market Value (US$ Million) by Country, 2024 to 2034

Figure 156: South Asia Market Value (US$ Million) Analysis by Country, 2019 to 2034

Figure 157: South Asia Market Volume (Units) Analysis by Country, 2019 to 2034

Figure 158: South Asia Market Value Share (%) and BPS Analysis by Country, 2024 to 2034

Figure 159: South Asia Market Y-o-Y Growth (%) Projections by Country, 2024 to 2034

Figure 160: South Asia Market Value (US$ Million) Analysis by Material, 2019 to 2034

Figure 161: South Asia Market Volume (Units) Analysis by Material, 2019 to 2034

Figure 162: South Asia Market Value Share (%) and BPS Analysis by Material, 2024 to 2034

Figure 163: South Asia Market Y-o-Y Growth (%) Projections by Material, 2024 to 2034

Figure 164: South Asia Market Value (US$ Million) Analysis by Components, 2019 to 2034

Figure 165: South Asia Market Volume (Units) Analysis by Components, 2019 to 2034

Figure 166: South Asia Market Value Share (%) and BPS Analysis by Components, 2024 to 2034

Figure 167: South Asia Market Y-o-Y Growth (%) Projections by Components, 2024 to 2034

Figure 168: South Asia Market Value (US$ Million) Analysis by Application, 2019 to 2034

Figure 169: South Asia Market Volume (Units) Analysis by Application, 2019 to 2034

Figure 170: South Asia Market Value Share (%) and BPS Analysis by Application, 2024 to 2034

Figure 171: South Asia Market Y-o-Y Growth (%) Projections by Application, 2024 to 2034

Figure 172: South Asia Market Value (US$ Million) Analysis by End-users, 2019 to 2034

Figure 173: South Asia Market Volume (Units) Analysis by End-users, 2019 to 2034

Figure 174: South Asia Market Value Share (%) and BPS Analysis by End-users, 2024 to 2034

Figure 175: South Asia Market Y-o-Y Growth (%) Projections by End-users, 2024 to 2034

Figure 176: South Asia Market Attractiveness by Material, 2024 to 2034

Figure 177: South Asia Market Attractiveness by Components, 2024 to 2034

Figure 178: South Asia Market Attractiveness by Application, 2024 to 2034

Figure 179: South Asia Market Attractiveness by End-users, 2024 to 2034

Figure 180: South Asia Market Attractiveness by Country, 2024 to 2034

Figure 181: Oceania Market Value (US$ Million) by Material, 2024 to 2034

Figure 182: Oceania Market Value (US$ Million) by Components, 2024 to 2034

Figure 183: Oceania Market Value (US$ Million) by Application, 2024 to 2034

Figure 184: Oceania Market Value (US$ Million) by End-users, 2024 to 2034

Figure 185: Oceania Market Value (US$ Million) by Country, 2024 to 2034

Figure 186: Oceania Market Value (US$ Million) Analysis by Country, 2019 to 2034

Figure 187: Oceania Market Volume (Units) Analysis by Country, 2019 to 2034

Figure 188: Oceania Market Value Share (%) and BPS Analysis by Country, 2024 to 2034

Figure 189: Oceania Market Y-o-Y Growth (%) Projections by Country, 2024 to 2034

Figure 190: Oceania Market Value (US$ Million) Analysis by Material, 2019 to 2034

Figure 191: Oceania Market Volume (Units) Analysis by Material, 2019 to 2034

Figure 192: Oceania Market Value Share (%) and BPS Analysis by Material, 2024 to 2034

Figure 193: Oceania Market Y-o-Y Growth (%) Projections by Material, 2024 to 2034

Figure 194: Oceania Market Value (US$ Million) Analysis by Components, 2019 to 2034

Figure 195: Oceania Market Volume (Units) Analysis by Components, 2019 to 2034

Figure 196: Oceania Market Value Share (%) and BPS Analysis by Components, 2024 to 2034

Figure 197: Oceania Market Y-o-Y Growth (%) Projections by Components, 2024 to 2034

Figure 198: Oceania Market Value (US$ Million) Analysis by Application, 2019 to 2034

Figure 199: Oceania Market Volume (Units) Analysis by Application, 2019 to 2034

Figure 200: Oceania Market Value Share (%) and BPS Analysis by Application, 2024 to 2034

Figure 201: Oceania Market Y-o-Y Growth (%) Projections by Application, 2024 to 2034

Figure 202: Oceania Market Value (US$ Million) Analysis by End-users, 2019 to 2034

Figure 203: Oceania Market Volume (Units) Analysis by End-users, 2019 to 2034

Figure 204: Oceania Market Value Share (%) and BPS Analysis by End-users, 2024 to 2034

Figure 205: Oceania Market Y-o-Y Growth (%) Projections by End-users, 2024 to 2034

Figure 206: Oceania Market Attractiveness by Material, 2024 to 2034

Figure 207: Oceania Market Attractiveness by Components, 2024 to 2034

Figure 208: Oceania Market Attractiveness by Application, 2024 to 2034

Figure 209: Oceania Market Attractiveness by End-users, 2024 to 2034

Figure 210: Oceania Market Attractiveness by Country, 2024 to 2034

Figure 211: MEA Market Value (US$ Million) by Material, 2024 to 2034

Figure 212: MEA Market Value (US$ Million) by Components, 2024 to 2034

Figure 213: MEA Market Value (US$ Million) by Application, 2024 to 2034

Figure 214: MEA Market Value (US$ Million) by End-users, 2024 to 2034

Figure 215: MEA Market Value (US$ Million) by Country, 2024 to 2034

Figure 216: MEA Market Value (US$ Million) Analysis by Country, 2019 to 2034

Figure 217: MEA Market Volume (Units) Analysis by Country, 2019 to 2034

Figure 218: MEA Market Value Share (%) and BPS Analysis by Country, 2024 to 2034

Figure 219: MEA Market Y-o-Y Growth (%) Projections by Country, 2024 to 2034

Figure 220: MEA Market Value (US$ Million) Analysis by Material, 2019 to 2034

Figure 221: MEA Market Volume (Units) Analysis by Material, 2019 to 2034

Figure 222: MEA Market Value Share (%) and BPS Analysis by Material, 2024 to 2034

Figure 223: MEA Market Y-o-Y Growth (%) Projections by Material, 2024 to 2034

Figure 224: MEA Market Value (US$ Million) Analysis by Components, 2019 to 2034

Figure 225: MEA Market Volume (Units) Analysis by Components, 2019 to 2034

Figure 226: MEA Market Value Share (%) and BPS Analysis by Components, 2024 to 2034

Figure 227: MEA Market Y-o-Y Growth (%) Projections by Components, 2024 to 2034

Figure 228: MEA Market Value (US$ Million) Analysis by Application, 2019 to 2034

Figure 229: MEA Market Volume (Units) Analysis by Application, 2019 to 2034

Figure 230: MEA Market Value Share (%) and BPS Analysis by Application, 2024 to 2034

Figure 231: MEA Market Y-o-Y Growth (%) Projections by Application, 2024 to 2034

Figure 232: MEA Market Value (US$ Million) Analysis by End-users, 2019 to 2034

Figure 233: MEA Market Volume (Units) Analysis by End-users, 2019 to 2034

Figure 234: MEA Market Value Share (%) and BPS Analysis by End-users, 2024 to 2034

Figure 235: MEA Market Y-o-Y Growth (%) Projections by End-users, 2024 to 2034

Figure 236: MEA Market Attractiveness by Material, 2024 to 2034

Figure 237: MEA Market Attractiveness by Components, 2024 to 2034

Figure 238: MEA Market Attractiveness by Application, 2024 to 2034

Figure 239: MEA Market Attractiveness by End-users, 2024 to 2034

Figure 240: MEA Market Attractiveness by Country, 2024 to 2034

Frequently Asked Questions

What is Current Hot and Cold System Market Valuation?

The hot and cold system industry to secure a valuation USD 21.4 billion in 2024.

How Big Can the Hot and Cold System Market Be by 2034?

The demand for hot and cold system is estimated to attain USD 41 billion by 2034.

What is the Growth Potential of the Hot and Cold System Market?

Through 2034, the sales of hot and cold system are anticipated to strengthen at a 6.7% CAGR.

What Was the Historical Outlook of The Hot and Cold System Market?

From 2019 to 2023, the hot and cold system industry developed at a n 8.4% HCAGR.

Which Material Segment to Dominate in the Hot and Cold System Market?

The plastic sector is set to escalate at a CAGR of 6.5% through 2034.

Which Component Segment to Lead the Hot and Cold System Market?

The pipe sector is envisioned to spur at a CAGR of 6.3% through 2034

Explore Similar Insights

Future Market Insights

Hot and Cold System Market