The Photonic Crystal Displays Market is estimated to be valued at USD 69.8 billion in 2025 and is projected to reach USD 142.5 billion by 2035, registering a compound annual growth rate (CAGR) of 7.4% over the forecast period.
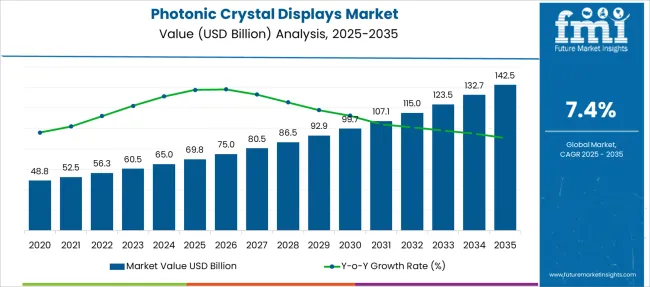
| Metric | Value |
|---|---|
| Photonic Crystal Displays Market Estimated Value in (2025 E) | USD 69.8 billion |
| Photonic Crystal Displays Market Forecast Value in (2035 F) | USD 142.5 billion |
| Forecast CAGR (2025 to 2035) | 7.4% |
The photonic crystal displays market is advancing, propelled by demand for high-performance display technologies with improved color accuracy and energy efficiency. Innovations in photonic crystal materials have enabled manufacturers to produce displays with enhanced brightness and reduced power consumption.
Industry trends have shown increased adoption of these displays in applications such as LED lighting and high-definition screens, which require superior visual quality and reliability. The integration of photonic crystals allows for better light management and color control, making these displays attractive for next-generation electronic devices.
Expansion in sectors such as IT and telecommunications has further fueled market growth, driven by the need for advanced display solutions in smartphones, tablets, and communication equipment. As consumer expectations for display quality rise alongside technological advancements, the photonic crystal displays market is expected to continue growing. Key segments driving this growth include Two Dimensional Photonic Crystals in type, LEDs in application, and IT and Telecommunications as the primary end user.
The market is segmented by Type, Application, and End User and region. By Type, the market is divided into Two Dimensional Photonic Crystals, One Dimensional Photonic Crystal, and Three Dimensional Photonic Crystals. In terms of Application, the market is classified into LEDS, Optical Fiber, Image Sensors, Solar & PV Cells, Lasers, Discrete & Integrated Optical Components, and Others. Based on End User, the market is segmented into IT and Telecommunications, Manufacturing, Transportation and Logistics, Defense and Government, BFSI, Healthcare, Retail, Energy and Utilities, and Others. Regionally, the market is classified into North America, Latin America, Western Europe, Eastern Europe, Balkan & Baltic Countries, Russia & Belarus, Central Asia, East Asia, South Asia & Pacific, and the Middle East & Africa.
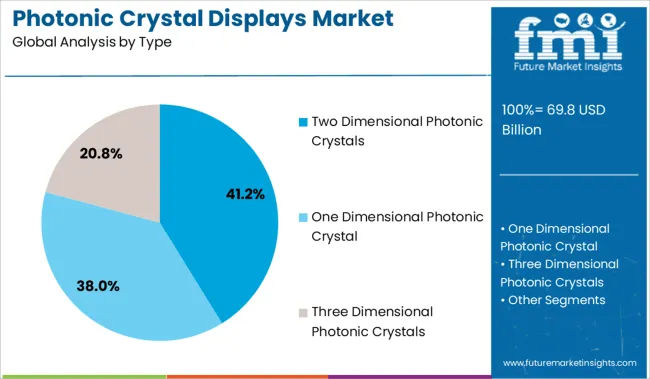
The Two Dimensional Photonic Crystals segment is anticipated to contribute 41.2% of the photonic crystal displays market revenue in 2025, maintaining its dominance in type classification. This segment’s expansion has been driven by the ability of two dimensional photonic crystals to manipulate light efficiently within thin display layers.
Their structure allows precise control over light propagation, resulting in enhanced display brightness and contrast. Manufacturers have leveraged this technology to meet the increasing demand for compact, high-resolution displays in portable and wearable devices.
The scalability and manufacturability of two dimensional photonic crystals have further supported their adoption in commercial products. As the push for energy-efficient and visually superior displays continues, this segment is poised to lead in the photonic crystal displays market.
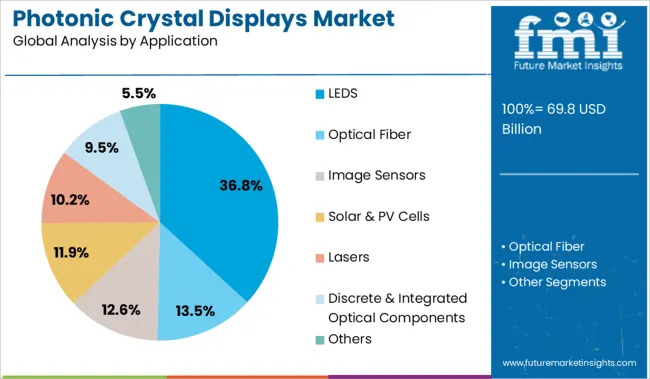
The LEDs segment is projected to hold 36.8% of the photonic crystal displays market revenue in 2025, asserting its position as the leading application. Growth in this segment is attributed to the role of photonic crystal displays in improving LED performance by enhancing light extraction efficiency and color purity.
LED manufacturers have increasingly integrated photonic crystal structures to overcome limitations of traditional LED technologies. This has resulted in brighter displays with lower power consumption, aligning with industry goals for sustainable and high-quality lighting solutions.
The expanding use of LEDs in consumer electronics, automotive lighting, and display backlighting has further driven demand for photonic crystal enhancements. With continuous innovation and growing application diversity, the LEDs segment is expected to sustain its market leadership.
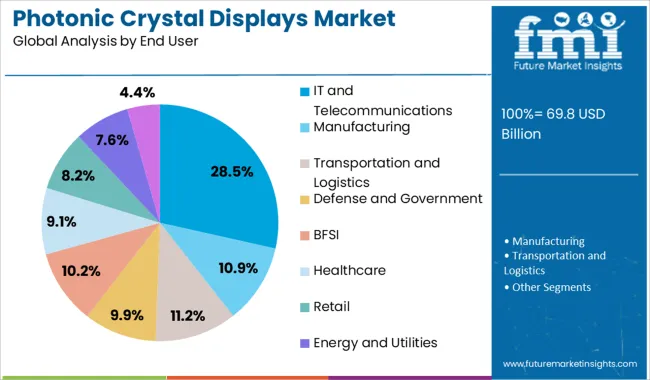
The IT and Telecommunications segment is anticipated to account for 28.5% of the photonic crystal displays market revenue in 2025, maintaining its position as the primary end user. This segment’s growth has been supported by the widespread adoption of photonic crystal displays in devices requiring high-quality visual output such as smartphones, tablets, and networking equipment.
The demand for thinner, lighter, and more energy-efficient displays in IT and telecommunications has pushed manufacturers to incorporate photonic crystal technology. Enhanced display quality contributes to improved user experience and device performance, making these displays critical in competitive consumer electronics markets.
As digital communication technologies advance and demand for superior displays increases, the IT and Telecommunications segment is expected to remain a key driver of market growth.
The primary factors driving the growth of the global photonic crystal displays market are the rising adoption of enhanced technologies such as image sensors, optical fibers, solar, laser, and others. Moreover, the growing use of photonic crystals in LEDs for the generation of power is another key reason which contributes to the growth of this market.
The demand for photonic crystals is surging as there are more research and development activities in solar panels. This boosts the demand for the photonic crystal display market. Also, there is a surging demand for photonic crystals from several end-use industries to generate power, and this is predicted to be the major market driving factor of the global photonic crystal displays market during the forecast period.
Another factor promoting the demand for photonic crystals is the rising demand for clean and sustainable energy from many industries. Furthermore, stringent norms from the government are predicted to fuel the growth of the global photonic crystal display market during the forecast period.
One of the key materials in the next generation displays is Quantum Dots (QD). Having narrow full width at half maximum and high quantum efficiency, Quantum Dots allows extremely efficient display along with a broader color gamut in comparison to other types of displays. Photonic crystals are used to increase light extraction and material use of QD display, along with photonic stopband in LEDs.
More competitive and eco-friendly QD-LED products are produced with the help of photonic crystals as they develop high-intensity QD-LED with less QD use, and this results in a decreased amount of cadmium and less cost. Hence, several manufacturers are aiming to mix photonic crystals and Quantum Dots to deliver efficient and brighter displays for tablets, computers, and mobile phones.
Besides the market-driving factors, complications pertaining to the applications of crystals are predicted to hamper the global photonic crystal display market. Moreover, the dearth of reliable fabrication methodologies and complexities linked with the formulation of crystals is said to hinder the growth of the photonic crystal displays market during the forecast period.
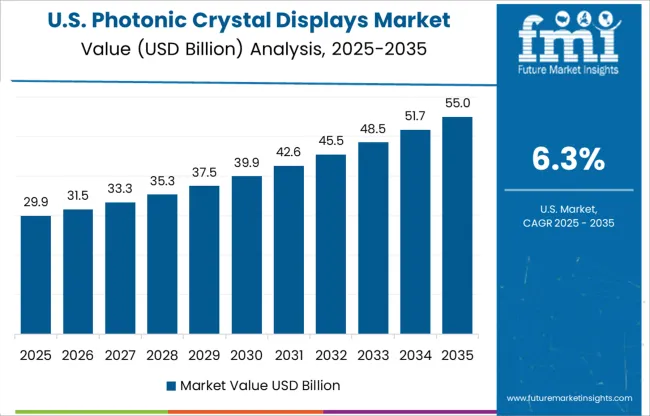
North America is said to hold a market share of 19.90% of the global photonic crystal display market. The photonic crystal display Market is presently ruled by North America owing to an extreme number of manufacturing companies in this region, such as Agilent Technologies, Lockheed Martin, Palo Alto Research Center (PARC), and others, and they are growing their business outside North America region.
One of the other key market driving factors for the North American photonic crystal display market is the growing application of photonic crystals in LEDs for power generation.
Besides North America, Asia Pacific portrays the swiftest growth rate owing to increasing research and development activities and overall economic development for different applications such as sensing, optical chip, lasers, and others.
Also, the Asia Pacific region is said to sustain its market position during the forecast period due to favorable government which is increasing the amount of investment in research and activities by market manufacturers operating in the photonic crystal displays market.
Multiple new players are entering the photonic crystal displays market. In January 2025, VitreaLab, an Austria-based start-up company that develops display technology by making use of glass-based waveguides, is the winner of the $10,000 top prize at the 12th annual SPIE Startup Challenge.
The company’s laser-lit chip concentrates on the 2D and 3D display market. The technology allows more power-efficient displays.
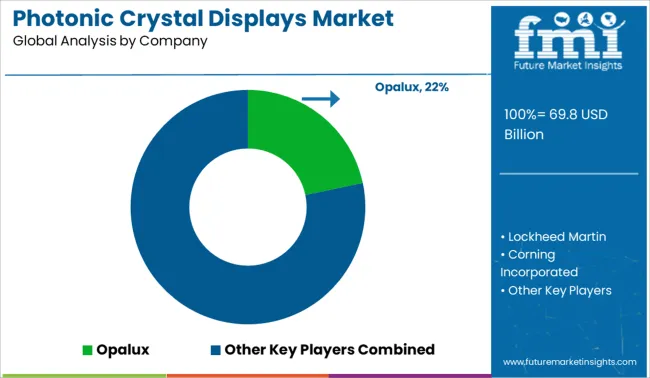
Some of the key players in the Photonic Crystal Displays market are Palo Alto Research Center (PARC), Opalux, Lockheed Martin, Corning Incorporated, Photonic Lattice Inc., Rohm Co., Agilent Technologies, Microcontinuum and Lightwave Power, ICX Photonics, Epistar, Fianium, TDK Corporation, OmniGuide, Micron Technology, Luxtaltek Corporation, Canon Kabushiki Kaisha (Canon), Advanced Photonic Crystals (APC), Philips Lumileds Lighting Company, LG Innotek, NKT Photonics, Samsung LLC, Panasonic, and Luminus Devices Inc.
Market manufacturers have implemented strategies such as novel product approvals, new product launches, market initiatives, and mergers and acquisitions. For instance, in May 2025, Agilent Technologies announced a partnership agreement with APC Ltd., in which they dedicate themselves to functioning towards merging their technologies to render exclusive workflows to clients that encourage automated process analysis through liquid chromatography (LC).
Also, in June 2025, Agilent Technologies Inc. announced the release of its MassHunter BioConfirm 12.0 software, it supports data generated by Agilent high-resolution LC/MS for oligonucleotide purity analysis and sequence confirmation.
| Report Attribute | Details |
|---|---|
| Growth Rate | CAGR of 7.40% from 2025 to 2035 |
| Base Year for Estimation | 2024 |
| Historical Data | 2020 to 2024 |
| Forecast Period | 2025 to 2035 |
| Quantitative Units | Revenue in USD million and CAGR from 2025 to 2035 |
| Report Coverage | Revenue Forecast, Volume Forecast, Company Ranking, Competitive Landscape, Growth Factors, Trends, and Pricing Analysis |
| Segments Covered | Type, Application, End User, Region |
| Regions Covered | North America; Latin America; Europe; East Asia; South Asia; Oceania; Middle East and Africa |
| Key Countries Profiled | United States of America, Canada, Brazil, Argentina, Germany, United Kingdom, France, Spain, Italy, Nordics, BENELUX, Australia & New Zealand, China, India, ASEAN, GCC Countries, South Africa |
| Key Companies Profiled | Palo Alto Research Center (PARC); Opalux; Lockheed Martin; Corning Incorporated; Photonic Lattice Inc.; Rohm Co.; Agilent Technologies; Microcontinuum and Lightwave Power; ICX Photonics; Epistar; Fianium; TDK Corporation; OmniGuide; Micron Technology; Luxtaltek Corporation; Canon Kabushiki Kaisha (Canon); Advanced Photonic Crystals (APC); Philips Lumileds Lighting Company; LG Innotek; NKT Photonics; Samsung LLC; Panasonic; Luminus Devises Inc. |
| Customization | Available Upon Request |
The global photonic crystal displays market is estimated to be valued at USD 69.8 billion in 2025.
The market size for the photonic crystal displays market is projected to reach USD 142.5 billion by 2035.
The photonic crystal displays market is expected to grow at a 7.4% CAGR between 2025 and 2035.
The key product types in photonic crystal displays market are two dimensional photonic crystals, one dimensional photonic crystal and three dimensional photonic crystals.
In terms of application, leds segment to command 36.8% share in the photonic crystal displays market in 2025.


Our Research Products

The "Full Research Suite" delivers actionable market intel, deep dives on markets or technologies, so clients act faster, cut risk, and unlock growth.

The Leaderboard benchmarks and ranks top vendors, classifying them as Established Leaders, Leading Challengers, or Disruptors & Challengers.

Locates where complements amplify value and substitutes erode it, forecasting net impact by horizon

We deliver granular, decision-grade intel: market sizing, 5-year forecasts, pricing, adoption, usage, revenue, and operational KPIs—plus competitor tracking, regulation, and value chains—across 60 countries broadly.

Spot the shifts before they hit your P&L. We track inflection points, adoption curves, pricing moves, and ecosystem plays to show where demand is heading, why it is changing, and what to do next across high-growth markets and disruptive tech

Real-time reads of user behavior. We track shifting priorities, perceptions of today’s and next-gen services, and provider experience, then pace how fast tech moves from trial to adoption, blending buyer, consumer, and channel inputs with social signals (#WhySwitch, #UX).

Partner with our analyst team to build a custom report designed around your business priorities. From analysing market trends to assessing competitors or crafting bespoke datasets, we tailor insights to your needs.
Supplier Intelligence
Discovery & Profiling
Capacity & Footprint
Performance & Risk
Compliance & Governance
Commercial Readiness
Who Supplies Whom
Scorecards & Shortlists
Playbooks & Docs
Category Intelligence
Definition & Scope
Demand & Use Cases
Cost Drivers
Market Structure
Supply Chain Map
Trade & Policy
Operating Norms
Deliverables
Buyer Intelligence
Account Basics
Spend & Scope
Procurement Model
Vendor Requirements
Terms & Policies
Entry Strategy
Pain Points & Triggers
Outputs
Pricing Analysis
Benchmarks
Trends
Should-Cost
Indexation
Landed Cost
Commercial Terms
Deliverables
Brand Analysis
Positioning & Value Prop
Share & Presence
Customer Evidence
Go-to-Market
Digital & Reputation
Compliance & Trust
KPIs & Gaps
Outputs
Full Research Suite comprises of:
Market outlook & trends analysis
Interviews & case studies
Strategic recommendations
Vendor profiles & capabilities analysis
5-year forecasts
8 regions and 60+ country-level data splits
Market segment data splits
12 months of continuous data updates
DELIVERED AS:
PDF EXCEL ONLINE
Crystal Malt Market Size and Share Forecast Outlook 2025 to 2035
Crystallization Equipment Market Size and Share Forecast Outlook 2025 to 2035
Crystal Products Market Size and Share Forecast Outlook 2025 to 2035
Crystal Oscillator Market Analysis - Size, Share, and Forecast 2025 to 2035
Crystal Barware Market Size and Share Forecast Outlook 2025 to 2035
Photonic Integrated Circuit Market Size and Share Forecast Outlook 2025 to 2035
Photonics Market Analysis - Size, Share, and Forecast Outlook 2025 to 2035
Photonic Sensor Market - Trends & Forecast 2025 to 2035
Photonic Integrated Circuit & Quantum Computing Market - Trends & Forecast 2025 to 2035
Displays Market Insights – Growth, Demand & Forecast 2025 to 2035
Photonic Sensors & Detectors Market Insights - Growth & Forecast 2024 to 2034
Crystalline Fructose Market Growth - Trends & Forecast through 2034
Biophotonics Market Growth - Trends & Forecast 2025 to 2035
kHz Crystal Oscillator Market Size and Share Forecast Outlook 2025 to 2035
MHz Crystal Oscillator Market Size and Share Forecast Outlook 2025 to 2035
Nanocrystalline cellulose Market Size and Share Forecast Outlook 2025 to 2035
Monocrystalline Solar Cell Market Size and Share Forecast Outlook 2025 to 2035
LED Displays, Lighting and Fixtures Market Size and Share Forecast Outlook 2025 to 2035
Nanocrystal Packaging Coating Market Analysis - Size, Share, and Forecast 2025 to 2035
Polycrystalline Silicon Market Growth 2025 to 2035

Thank you!
You will receive an email from our Business Development Manager. Please be sure to check your SPAM/JUNK folder too.
Chat With
MaRIA