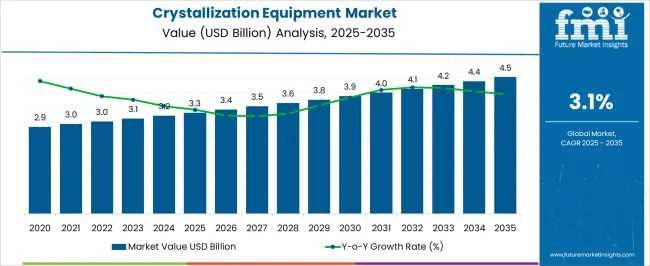
The Crystallization Equipment Market is estimated to be valued at USD 3.3 billion in 2025 and is projected to reach USD 4.5 billion by 2035, registering a compound annual growth rate (CAGR) of 3.1% over the forecast period.
| Metric | Value |
|---|---|
| Crystallization Equipment Market Estimated Value in (2025 E) | USD 3.3 billion |
| Crystallization Equipment Market Forecast Value in (2035 F) | USD 4.5 billion |
| Forecast CAGR (2025 to 2035) | 3.1% |
The crystallization equipment market is expanding steadily. Rising demand for high-purity products in pharmaceuticals, chemicals, and food processing is driving market growth. Current trends are defined by technological innovations in equipment design, enhanced process automation, and growing adoption of energy-efficient systems.
Manufacturers are focusing on optimizing production efficiency and improving product consistency while meeting stringent regulatory and quality standards. The outlook is further supported by increasing industrial investment in advanced crystallization facilities and a strong focus on sustainability to reduce waste and resource consumption.
Market expansion is also being reinforced by the growing adoption of continuous crystallization processes in developed regions and the rise of batch-based systems in emerging economies due to cost-effectiveness Growth rationale is anchored in the ability of crystallization equipment to deliver controlled purity, scalability across industries, and compatibility with complex chemical formulations, ensuring consistent demand over the forecast horizon.
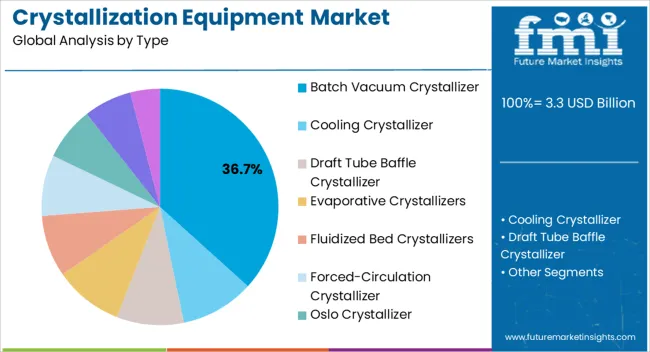
The batch vacuum crystallizer segment, accounting for 36.70% of the type category, has emerged as the leading equipment type due to its efficiency in handling heat-sensitive materials and its adaptability across multiple industrial applications. Its market strength is being reinforced by consistent demand from pharmaceutical and specialty chemical producers, where controlled crystallization is critical for product quality.
The segment benefits from enhanced process control and flexibility in small-to-medium production volumes, making it highly suitable for research-driven and niche markets. Continued technological improvements, such as automation integration and advanced temperature control mechanisms, have enhanced reliability and productivity.
Global adoption has also been supported by cost efficiency compared to continuous crystallizers Over the forecast period, rising pharmaceutical production and the growing need for precision crystallization are expected to sustain the batch vacuum crystallizer segment’s leading share.
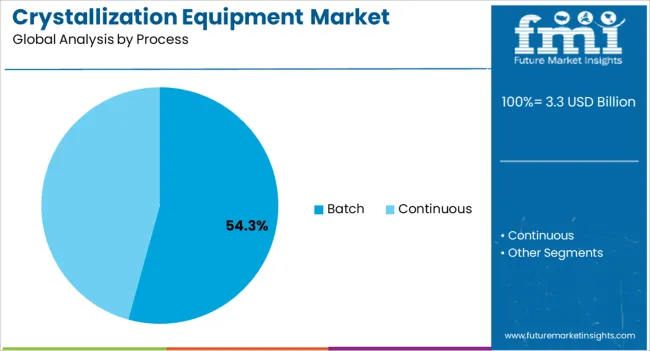
The batch process segment, holding 54.30% of the process category, has remained dominant due to its widespread application in industries that prioritize flexibility and precision in product output. Batch processes provide manufacturers with high control over parameters such as temperature, supersaturation, and solvent composition, enabling precise crystallization outcomes.
This segment has been favored by industries requiring small-to-medium scale production, as it allows for easy adjustment to varying product specifications. Technological advancements in monitoring and automation have strengthened the efficiency and reproducibility of batch processes, making them highly reliable.
In addition, cost advantages and relatively lower complexity compared to continuous systems have supported adoption in emerging markets Future growth is expected to be driven by the pharmaceutical sector, where batch crystallization remains integral for drug formulation and specialty applications.
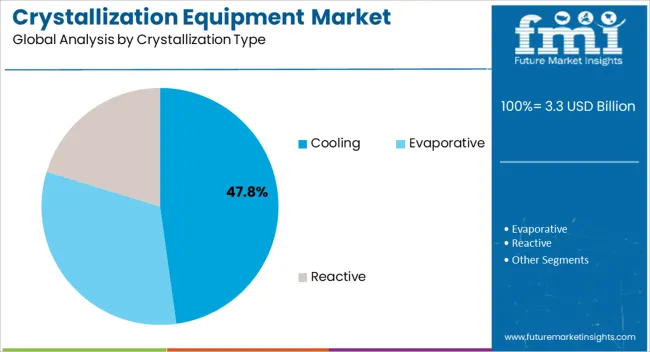
The cooling crystallization segment, representing 47.80% of the crystallization type category, has been leading the market as it is widely applied in industries requiring controlled supersaturation to achieve high-purity products. Its prominence is supported by low operational costs and effective crystallization outcomes for a broad range of solutes. The method has gained traction in the pharmaceutical, chemical, and food sectors due to its compatibility with both laboratory-scale and industrial-scale applications.
Process flexibility and ease of operation have further reinforced its adoption. Technological advancements in cooling systems and process optimization have enhanced both yield and energy efficiency.
Demand has also been supported by its suitability for sensitive compounds, where controlled cooling ensures desired particle size distribution and purity Looking ahead, the segment is expected to maintain its leading position as industries increasingly emphasize cost efficiency, scalability, and consistent product quality.
Increasing Demand for Crystallization Equipment from the Pharmaceutical Sector
The COVID-19 pandemic has substantially transformed the global pharmaceutical industry in many ways. There has been an increasing demand for efficient processes for manufacturing pharmaceutical compounds such as drugs, medications, vaccines, etc. This has resulted in a rapid surge in the demand for crystallization equipment, a critical step in pharmaceutical manufacturing. It is used to isolate and purify chemical compounds, ensuring the production of high-quality pharmaceutical products.
The market has also boomed in the past few years because it helps achieve the desired level of purity, which is crucial for the efficacy and safety of the final drug product. The pharmaceutical industry is continuously expanding due to population growth, aging demographics, and increasing healthcare needs. All of these factors have collectively led to the rise in the significance of crystallization equipment in the pharma industry, thus elevating the global market revenue.
The crystallization equipment market heavily relies on the performance of several industries, such as pharmaceutical, biotechnology, chemical, and food and beverage. The growth of this market is also dependent upon the adoption of advanced technologies and crystallization equipment in manufacturing factory units all over the world. The overall global economic condition also significantly influences the expansion of this market.
Historically speaking, the crystallization equipment market has witnessed several peaks and troughs. During the pandemic, the demand for machine tool equipment rapidly declined as the world faced sudden shutdowns. Sluggish manufacturing needs in the initial phases of the pandemic adversely affected the market. Later on, as the pharma industry boomed, the demand for crystallization processes in the medical industries experienced a remarkable expansion.
Post-pandemic, as the world returned to normalcy and the demand for manufacturing equipment became steady, the market growth became stable. Recessionary economies and the ongoing war-like situations in many European as well as Middle Eastern countries have heavily impacted the petrochemical industry, which is one of the largest consumers of the market. Despite these challenges, the food and beverage industry and technological advancements in biotechnology are expected to propel the market.
| Attributes | Key Statistics |
|---|---|
| Crystallization Equipment Market Value (2020) | USD 2,830.7 million |
| Historical Market Value (2025) | USD 3,136.8 million |
| CAGR (2020 to 2025) | 2.60% CAGR |
The pharmaceutical industry has been going through a period of rapid expansion in the past few years. The increasing need for precision and efficiency in drug development and manufacturing in the pharmaceutical industry is one of the critical drivers for the growth of the equipment market. Pharma companies all over the world are investing heavily to bring innovations in the crystallization processes, thus fueling the market growth.
| Top End-Use Industry | Pharmaceutical |
|---|---|
| Market share (2025) | 24.00% |
On the basis of the end-use industry, the pharmaceutical industry dominates the market with a whopping market share of 24.00% in 2025. This highly sophisticated technology has not only seen adoption in developed countries but has also gained popularity in developing countries such as India, Brazil, Australia, etc. As the pharma industry continues to grow, the demand for crystallization equipment is bound to experience a considerable expansion.
The batch-type crystallization equipment is gaining tremendous attention from industries all over the world due to its flexibility and ease of control. Batch crystallization allows for the precise manipulation of conditions such as temperature, pressure, and solvent ratios. These factors are crucial for achieving consistent product quality, especially in industries such as pharmaceutical and chemical, where the slightest variation in crystallization conditions can significantly impact the purity and characteristics of the final product.
| Top Product Type | Batch-type |
|---|---|
| Market share (2025) | 31.00% |
On the basis of product type, batch-type crystallization equipment dominates the market with a share of 31.00%. Its demand in the international market can also be attributed to its ability to handle a wide range of production volumes without compromising on efficiency or product quality. This makes batch-type crystallization equipment a preferred choice for small-scale as well as giant manufacturing units in streamlining their operations.
This section provides an analysis of the crystallization equipment market by countries, including the United States, the United Kingdom, Australia, China, and India. The table presents the CAGR for each country, indicating the expected growth of the market through 2035.
| Countries | CAGR (2025 to 2035) |
|---|---|
| India | 3.90% |
| China | 3.70% |
| Australia | 2.90% |
| United Kingdom | 2.80% |
| United States | 2.80% |
The crystallization equipment market in India is anticipated to grow at a significant rate of 3.90% CAGR during the forecast period from 2025 to 2035.
The Chinese crystallization equipment market is expected to showcase remarkable growth of 3.70% from 2025 to 2035.
The crystallization equipment market in Australia is anticipated to grow at a significant rate of 2.90% CAGR over the forecast period.
The crystallization equipment market in the United Kingdom is anticipated to grow at a significant rate of 2.80% from 2025 to 2035.
The crystallization equipment market in the United States is anticipated to grow at a 2.80% CAGR over the forecast period.
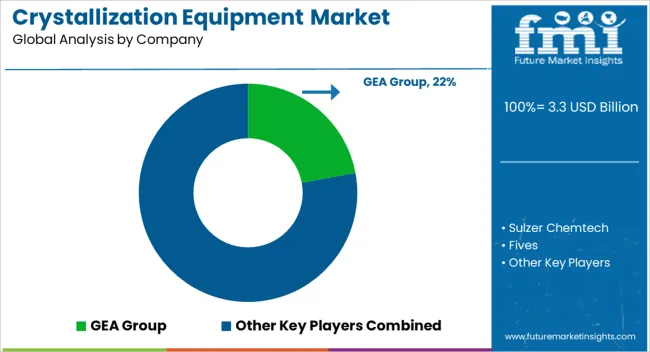
The competitive landscape for crystallization equipment is filled with numerous international companies with a worldwide reach. The industry is still nascent, with ample room for innovations. There is a noticeable push towards sustainable manufacturing practices in the manufacturing hub, and the crystallization processes are no exception. Despite these challenges, many small to medium-sized enterprises cater to the needs of local manufacturers seeking efficient crystallization services.
Recent Developments
The global crystallization equipment market is estimated to be valued at USD 3.3 billion in 2025.
The market size for the crystallization equipment market is projected to reach USD 4.5 billion by 2035.
The crystallization equipment market is expected to grow at a 3.1% CAGR between 2025 and 2035.
The key product types in crystallization equipment market are batch vacuum crystallizer, cooling crystallizer, draft tube baffle crystallizer, evaporative crystallizers, fluidized bed crystallizers, forced-circulation crystallizer, oslo crystallizer, surface-cooled crystallizer and vacuum crystallizer.
In terms of process, batch segment to command 54.3% share in the crystallization equipment market in 2025.


Full Research Suite comprises of:
Market outlook & trends analysis
Interviews & case studies
Strategic recommendations
Vendor profiles & capabilities analysis
5-year forecasts
8 regions and 60+ country-level data splits
Market segment data splits
12 months of continuous data updates
DELIVERED AS:
PDF EXCEL ONLINE
Protein Crystallization and Crystallography Market Analysis - Growth & Forecast 2025 to 2035
Equipment Management Software Market Size and Share Forecast Outlook 2025 to 2035
Equipment cases market Size and Share Forecast Outlook 2025 to 2035
Farm Equipment Market Size and Share Forecast Outlook 2025 to 2035
Golf Equipment Market Size and Share Forecast Outlook 2025 to 2035
Port Equipment Market Size and Share Forecast Outlook 2025 to 2035
Pouch Equipment Market Growth – Demand, Trends & Outlook 2025 to 2035
Garage Equipment Market Size and Share Forecast Outlook 2025 to 2035
Mining Equipment Industry Analysis in Latin America Size and Share Forecast Outlook 2025 to 2035
Subsea Equipment Market Size and Share Forecast Outlook 2025 to 2035
Pavers Equipment Market Size and Share Forecast Outlook 2025 to 2035
Tennis Equipment Market Analysis - Size, Share, and Forecast Outlook 2025 to 2035
Galley Equipment Market Analysis and Forecast by Fit, Application, and Region through 2035
Sorting Equipment Market Size and Share Forecast Outlook 2025 to 2035
General Equipment Rental Services Market Size and Share Forecast Outlook 2025 to 2035
Bagging Equipment Market Size and Share Forecast Outlook 2025 to 2035
RF Test Equipment Market Size and Share Forecast Outlook 2025 to 2035
Medical Equipment Covers Market Size and Share Forecast Outlook 2025 to 2035
Telecom Equipment Market Size and Share Forecast Outlook 2025 to 2035
Welding Equipment And Consumables Market Size and Share Forecast Outlook 2025 to 2035

Thank you!
You will receive an email from our Business Development Manager. Please be sure to check your SPAM/JUNK folder too.
Chat With
MaRIA