Tennis Equipment Market Size and Share Forecast Outlook 2025 to 2035

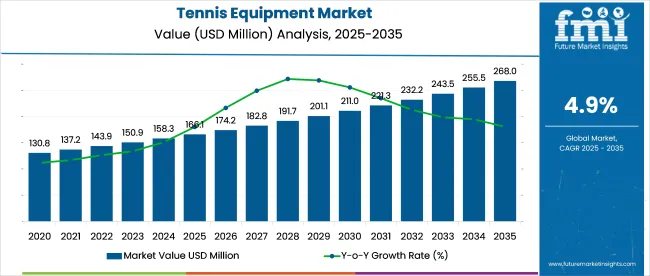
The tennis equipment market is estimated to reach USD 265.8 million by 2035, up from USD 166.1 million in 2025, growing at a CAGR of 4.9%. Demand has been shaped less by professional tournaments and more by recreational and semi-organized community players.
Quick Stats of the Tennis Equipment Market

  • Industry Value (2025): USD 166.1 million
  • Forecast Value (2035): USD 265.8 million
  • Global CAGR (2025 to 2035): 4.9%
  • Leading Segment in 2025: Apparel (~32.5% share)
  • Key Growth Region: Asia Pacific (China 9.2% of CAGR)
  • Key Players: Wilson Sporting Goods Co., Babolat Vibration, Head Sports GmbH, Prince Global Sports LLC, Yonex Co., Ltd.

Tennis Equipment Market

Metric Value
Industry Value (2025) USD 166.1 million
Forecast Value (2035) USD 265.8 million
CAGR (2025 to 2035) 4.9%

Nielsen data suggests that 3 in 5 new buyers purchase their first racket from non-sports-specific stores. On the supply side, warehouse proximity has become key; manufacturers have relocated inventory hubs closer to secondary cities. Contract manufacturing across Thailand and Vietnam recovered post-2022, though European resellers still operate with 12-15% longer lead times than pre-pandemic norms.

In January 2025, Babolat released the Pure Drive Gen11, designed to elevate spin and baseline dominance for aggressive players. As detailed in launch reports from January 16, 2025, the Gen11 features a reengineered frame that boosts stability and enlarges the sweet spot, enabling greater shot control during high-speed rallies.

Spin potential has been enhanced through subtle design shifts, catering to players seeking explosive topspin from deep positions. The racket also features a sleek, updated look while preserving the Pure Drive’s signature design. This model targets competitive players focused on power, spin, and consistency during prolonged baseline exchanges

The tennis equipment market represents around 22-25% of the global racquet sports equipment segment, which also includes badminton, squash, and padel. Within the broader sports equipment market, its share stands near 1.2-1.5%, influenced by the presence of larger categories such as football and basketball.

When placed under the athletic and sportswear industry, which includes footwear and apparel across various disciplines, tennis equipment contributes about 0.8-1.0%. In the fitness and recreation goods sector, its position is smaller, accounting for less than 0.5% due to the dominance of general exercise products. At the level of the global sporting goods market, its share is under 0.3%, showing its specialized status among a wide array of consumer and professional sports segments.

Analyzing Tennis Equipment Market by Top Investment Segments

The industry is segmented by product type into apparel, rackets, tennis balls, strings, and others. By sales channel, it includes specialty sports & fitness stores, online retailers, supermarkets, direct sales, and other distribution channels.

By application, the industry is divided into professional and amateur segments. Regional analysis includes North America, Latin America, Western Europe, Eastern Europe, East Asia, South Asia & Pacific, Middle East & Africa, and Oceania.
Dominance of Apparel in Tennis Equipment

Tennis Equipment Market By Product Type

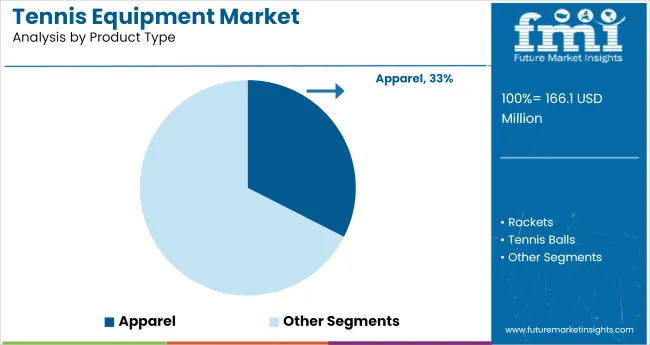
The apparel segment is projected to capture a significant share, with an estimated 32.5% industry share in 2025. As players prioritize comfort and performance, the demand for specialized tennis clothing, including moisture-wicking fabrics and durable footwear, is increasing.

Leading brands like Nike, Adidas, and Under Armour focus on performance-oriented designs catering to both professional athletes and casual players. Brands such as Lacoste are offering eco-conscious apparel lines to appeal to consumers who prioritize responsible purchasing choices.
  • Nike and Adidas dominate with high-performance apparel for professionals.
  • Under Armour introduces innovative tennis apparel options.
  • Lacoste focuses on premium, fashion-forward designs for recreational players.

Leading Sales Channel Specialty Sports & Fitness Stores

Tennis Equipment Market By Sales Channel

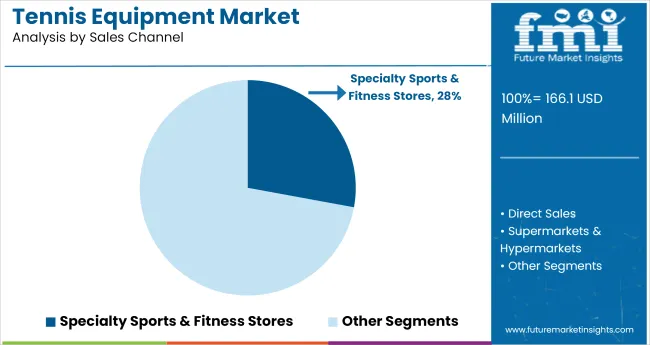
Specialty sports and fitness stores are expected to account for a 27.9% share in 2025. These stores, such as Dick’s Sporting Goods and Sports Authority, provide a wide variety of tennis equipment, from racquets to shoes, catering to both professionals and amateurs.

Consumers prefer in-person shopping for personalized advice, the ability to physically test products, and the assurance of product quality. Specialty stores like Tennis Warehouse offer niche products, attracting serious players. These retail outlets also support the growth of the tennis community through in-store events and equipment demonstrations.
  • Dick’s Sporting Goods and Sports Authority are major players in retail distribution.
  • Tennis Warehouse focuses on high-quality, specialized products for serious players.
  • In-store consultations and equipment testing enhance customer loyalty and satisfaction.

Amateur Segment Drives Growth in Tennis Equipment

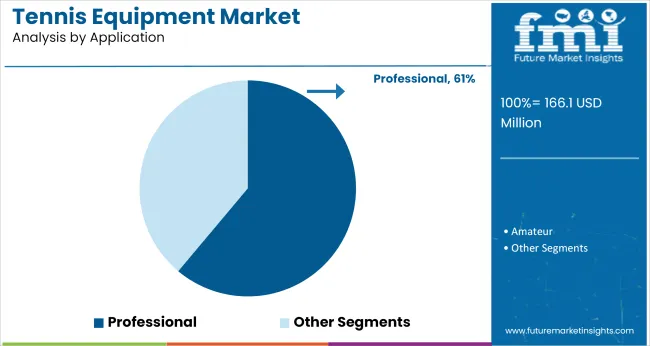
Tennis Equipment Market By Application

The amateur segment is projected to capture 61.1% share in 2025. As tennis continues to grow in popularity, especially for recreational purposes, the demand for affordable, entry-level equipment is on the rise.

Companies like Wilson and Babolat are responding with a wide range of products designed for casual players, including easy-to-use racquets and durable footwear. The rise of community tennis clubs and recreational centers is further contributing to the growth of this segment, offering access to tennis for all age groups and skill levels.

  • Wilson and Babolat offer affordable equipment for recreational players.
  • Community tennis clubs and recreational centers are increasing access to the sport.
  • Entry-level racquets and shoes are becoming popular among amateurs seeking quality at lower prices.

Top Tennis Equipment Market Dynamics

The tennis equipment sector is being influenced by a combination of technological advancements, increasing participation in the sport, and evolving consumer preferences. Rising interest in tennis, particularly among younger generations, is driving the demand for innovative and performance-enhancing equipment. However, high product costs, competition from alternative sports, and supply chain challenges are creating persistent obstacles for manufacturers.

Technological Advancements Drive Equipment Innovation

Demand for tennis equipment is driven by continuous innovations in racquet design, string materials, and footwear. Advanced racquet technologies, such as lighter frames and enhanced durability, offer players improved performance. These innovations attract both recreational and professional players, with leading brands investing heavily in R&D to stay competitive in the industry.

  • Lighter, more durable racquets are gaining popularity across player segments.
  • Advanced string materials improve control and power for professional athletes.
  • Footwear technology enhances comfort and performance for recreational and competitive players.

Challenges from High Product Costs and Competition

The high cost of premium tennis equipment, including advanced racquets and performance shoes, remains a barrier for casual players and emerging markets. The industry faces stiff competition from other recreational sports and alternative activities. As tennis grows globally, particularly in emerging regions, manufacturers are addressing affordability issues while balancing product quality. Competition from new entrants also poses challenges to established brands.
  • High costs of premium products limit accessibility for casual and new players.
  • Intense competition from alternative sports and emerging brands pressures the market.
  • Manufacturers are focusing on providing affordable yet high-quality products.

Top Countries Serving, Promoting, and Scaling Tennis Equipment Demand

Country Wise Analysis Of Tennis Equipment Market

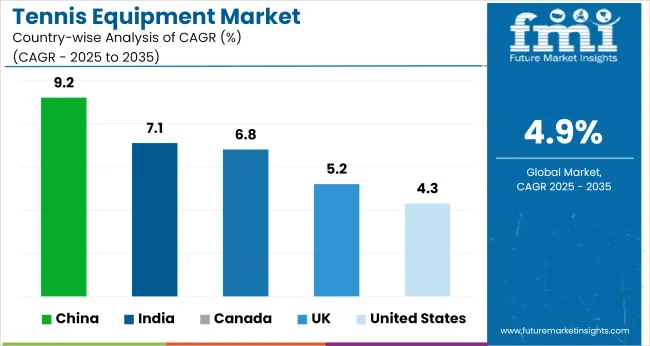
The report covers detailed analysis of 40+ countries and the top five countries have been shared as a reference.

Countries CAGR (2025 to 2035)
Unites States 4.3%
Canada 6.8%
UK 5.2%
China 9.2%
India 7.1%

With global growth in tennis equipment projected at 4.9% CAGR from 2025 to 2035, country-level performance shows sharp divergence tied to infrastructure, consumer base, and institutional investment. China leads with 9.2%, outpacing the global average by 4.3 points.

This growth is fueled by rising grassroots participation, local tournament expansion, and domestic manufacturing upgrades across Jiangsu and Guangdong. India follows at 7.1%, driven by sports academies investing in mid-range gear and growing D2C distribution via online retailers.

Canada posts a 6.8% CAGR, supported by rising female participation and indoor court infrastructure investments in suburban regions. These three countries,China, India, and Canada,outperform the global average and reflect upward momentum in BRICS and select G7 regions.

The United Kingdom, at 5.2%, is slightly above trend, but faces a flattening curve in rural clubs due to aging infrastructure. The United States, with 4.3%, lags the global baseline, reflecting slower replacement cycles and stagnant public court investments in non-metropolitan areas across several OECD zones.

Growth Analysis of Tennis Equipment Market in the United States

The tennis equipment market in the United States is expected to grow at a CAGR of 4.3% from 2025 to 2035. The demand for this equipment continues to rise as recreational participation increases, largely driven by the popularity of major tennis events like the USA Open.

Brands such as Prince, Yonex, and Tecnifibre are capitalizing on this demand by offering a wide range of products suited to both professional and amateur players. Youth tennis programs are also expanding, contributing to a broader market for entry-level and mid-range equipment. With the growing focus on fitness and wellness, tennis continues to attract players of all ages.

  • Increased participation in recreational tennis, spurred by events like the USA Open.
  • Growth in youth tennis programs fostering long-term demand for entry-level and professional equipment.
  • Technological advancements in racquets and footwear enhancing player performance.

Growth Outlook for Tennis Equipment Market in Canada

The tennis equipment market in Canada is set for robust growth, with a CAGR of 6.8% from 2025 to 2035. The sport’s increasing popularity, particularly in urban centers, is driving demand for high-quality equipment. Brands like Volkl, Babolat, and Head cater to both recreational and professional players.

The long winters in Canada have led to the growth of indoor tennis, which has become a year-round sport. With Tennis Canada supporting grassroots initiatives, more people are participating in tennis, which is expected to maintained demand for this equipment in the coming years.

  • Expansion of indoor tennis facilities driving year-round demand for tennis equipment.
  • Grassroots initiatives by Tennis Canada increasing youth engagement.
  • Rising popularity of tennis among women boosting demand for gender-specific products.

Demand Forecast for Tennis Equipment Market in the United Kingdom

The tennis equipment market in the UK is projected to grow at a CAGR of 5.2% from 2025 to 2035. The UK’s strong tennis culture, fostered by the global popularity of Wimbledon, continues to drive demand for tennis products.

Established brands like Tecnifibre, Wilson, and Lotto dominate the industry, offering advanced racquets, shoes, and apparel for players of all levels. The industry is also seeing a rise in female participation and youth engagement, further supporting the growing demand for tennis equipment. As players increasingly seek high-performance gear, technological innovations in racquets continue to play a key role in industry expansion.

  • Wimbledon’s influence continues to drive interest and sales of tennis equipment.
  • Growing demand for high-performance racquets with advanced technology.
  • Increasing participation from women and youth pushing for more diverse product offerings.

Growth Analysis of Tennis Equipment Market in China

Sales of tennis equipment in China are grow at a CAGR of 9.2% from 2025 to 2035. This growth is driven by increasing tennis participation, particularly in urban areas, and the rising popularity of tennis as both a recreational and competitive sport.

Brands like Head, Yonex, and Prince are expanding their industry share, offering a combination of premium and beginner-friendly products. Government-backed initiatives promoting physical activity and the construction of tennis facilities are further fueling this demand. With focus on sports infrastructure, the country is poised to become a major player in the industry.

  • Government-led initiatives promoting physical activity are expanding tennis participation nationwide.
  • Rise in professional training academies and tennis infrastructure development is driving demand for equipment.
  • Increasing popularity of tennis among younger generations, especially in urban areas, is contributing to the industry growth.

Executive Education Program Market Growth Outlook in India

Demand for tennis equipment is experiencing strong growth, with a projected CAGR of 7.1% from 2025 to 2035. The sport’s increasing visibility due to the success of Indian players is driving more people to take up tennis, especially among youth and urban professionals.

Major brands like Slazenger, Wilson, and Yonex are capitalizing on this growth by offering a wide range of affordable yet high-quality equipment. Tennis academies and fitness centers are expanding, further increasing the accessibility of the sport. The rise in media exposure and domestic tournaments is further encouraging people to invest in tennis equipment.
  • Successful Indian tennis players inspire increased interest and participation in the sport.
  • Growth of tennis academies and fitness centers boosts equipment demand.
  • Media coverage and domestic tournaments raise awareness and encourage amateur and professional involvement.

Competitive Landscape and Strategic Positioning in the Tennis Equipment Market

Tennis Equipment Market By Company

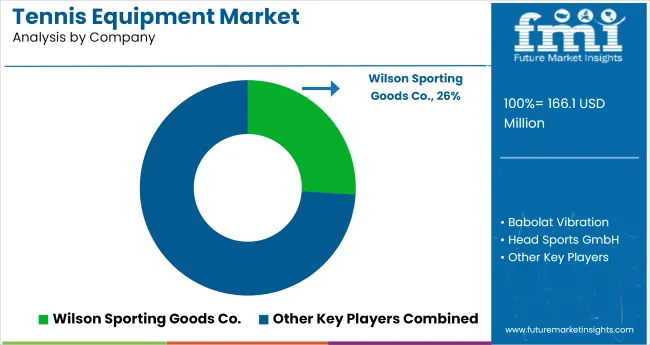
Leading Company - Wilson Sporting Goods Co.

Industry Share - 26%

In the tennis equipment market, established brands are expanding through athlete-driven branding, product line diversification, and supply chain responsiveness. Wilson, Head, and Babolat continue to dominate racket sales, supported by ATP and WTA endorsements and iterative performance innovations.

These companies rely on Southeast Asian manufacturing hubs to remain agile in batch sizing and distribution. Meanwhile, Nike, Adidas, and Asics focus on apparel and footwear, maintaining relevance through direct-to-consumer engagement and visibility in global tournaments. Yonex and Tecnifibre are reinforcing their positions with tournament sponsorships and specialized string technologies, particularly in European and Asian markets.

Emerging players like Solinco, Diadem, and Furi Sport are gaining visibility through grassroots campaigns, fast product cycles, and urban-focused outreach. These firms appeal to digitally native buyers seeking limited-edition designs and alternative brand narratives. Dunlop and Prince are rebuilding their legacy status by targeting niche tournaments and retail bundling.

Recent Industry News

  • In January 2025, Wilson launches AI-powered “Clash V3” racket. Wilson unveiled its Clash V3 on January 15, 2025, featuring an AI-optimized frame geometry designed for enhanced flexibility and stability tailored to different play styles
  • In January 2025, Dunlop unveiled its redesigned SX 300 racquet series, aimed at delivering enhanced spin, precision, and power across player levels. As reported by Samuel Spencer on Tennis Express (January 13, 2025), the new lineup includes the SX 300 Tour, SX 300, SX 300 LS, and SX 300 Lite each tailored for specific user profiles through differentiated weight, balance, and frame technologies.

Leading Companies in Tennis Equipment Market

  • Wilson Sporting Goods Co.
  • Babolat Vibration
  • Head Sports GmbH
  • Prince Global Sports LLC
  • Yonex Co., Ltd.
  • Adidas AG
  • Nike, Inc.
  • Dunlop Sport
  • Asics Corporation
  • Tecnifibre
  • Other Players (As requested)

Research Coverage and Scope Summary

Report Attributes Details
Industry Size (2025) USD 166.1 million
Projected Industry Size (2035) USD 265.8 million
CAGR (2025 to 2035) 4.9%
Base Year for Estimation 2024
Historical Period 2020 to 2024
Projections Period 2025 to 2035
Quantitative Units USD million for value and thousand units for volume
Product Types Analyzed (Segment 1) Rackets, Tennis Balls, Strings, Apparel, Others
Sales Channels Analyzed (Segment 2) Direct Sales, Supermarkets & Hypermarkets, Specialty Sports & Fitness Stores, Electronics & Sports Stores, Online Retailers, Other Sales Channels
Applications Analyzed (Segment 3) Professional, Amateur
Regions Covered North America, Latin America, Europe, East Asia, South Asia, Oceania, Middle East & Africa
Countries Covered United States, Canada, Brazil, Mexico, Germany, United Kingdom, France, Italy, Spain, China, India, Japan, South Korea, Australia, Saudi Arabia, UAE, South Africa
Key Players Wilson Sporting Goods Co., Babolat Vibration, Head Sports GmbH, Prince Global Sports LLC, Yonex Co., Ltd., Adidas AG, Nike, Inc., Dunlop Sport, Asics Corporation, Tecnifibre, Other Players (As requested)
Additional Attributes Dollar sales, share by product type and application, growth in online and specialty retail channels, consumer shift toward performance gear, regional participation trends in amateur tennis

Key Segments

By Product Type:

This segment includes rackets, tennis balls, strings, apparel, and others.

By Sales Channel:

The industry is segmented into direct sales, supermarkets & hypermarkets, specialty sports & fitness stores, electronics & sports stores, online retailers, and other sales channels.

By Application:

This segment covers professional and amateur usage.

By Region:

Regional analysis includes North America, Latin America, Europe, East Asia, South Asia, Oceania, and Middle East & Africa.

Table of Content

  1. Executive Summary
    • Global Market Outlook
    • Demand-side Trends
    • Supply-side Trends
    • Technology Roadmap Analysis
    • Analysis and Recommendations
  2. Market Overview
    • Market Coverage/Taxonomy
    • Market Definition/Scope/Limitations
  3. Market Background
    • Market Dynamics
      • Drivers
      • Restraints
      • Opportunity
      • Trends
    • Scenario Forecast
      • Demand in Optimistic Scenario
      • Demand in Likely Scenario
      • Demand in Conservative Scenario
    • Opportunity Map Analysis
    • Product Life Cycle Analysis
    • Supply Chain Analysis
      • Supply Side Participants and their Roles
        • Producers
        • Mid-Level Participants (Traders/ Agents/ Brokers)
        • Wholesalers and Distributors
      • Value Added and Value Created at Node in the Supply Chain
      • List of Raw Material Suppliers
      • List of Existing and Potential Buyer’s
    • Investment Feasibility Matrix
    • Value Chain Analysis
      • Profit Margin Analysis
      • Wholesalers and Distributors
      • Retailers
    • PESTLE and Porter’s Analysis
    • Regulatory Landscape
      • By Key Regions
      • By Key Countries
    • Regional Parent Market Outlook
    • Production and Consumption Statistics
    • Import and Export Statistics
  4. Global Market Analysis 2020 to 2024 and Forecast, 2025 to 2035
    • Historical Market Size Value (USD Billion) & Volume (Thousand Units) Analysis, 2020 to 2024
    • Current and Future Market Size Value (USD Billion) & Volume (Thousand Units) Projections, 2025 to 2035
      • Y-o-Y Growth Trend Analysis
      • Absolute $ Opportunity Analysis
  5. Global Market Pricing Analysis 2020 to 2024 and Forecast 2025 to 2035
  6. Global Market Analysis 2020 to 2024 and Forecast 2025 to 2035, By Product Type
    • Introduction/Key Findings
    • Historical Market Size Value (USD Billion) & Volume (Thousand Units) Analysis By Product Type, 2020 to 2024
    • Current and Future Market Size Value (USD Billion) & Volume (Thousand Units) Analysis and Forecast By Product Type, 2025 to 2035
      • Rackets
      • Tennis Balls
      • Strings
      • Apparel
      • Others
    • Y-o-Y Growth Trend Analysis By Product Type, 2020 to 2024
    • Absolute $ Opportunity Analysis By Product Type, 2025 to 2035
  7. Global Market Analysis 2020 to 2024 and Forecast 2025 to 2035, By Sales Channel
    • Introduction/Key Findings
    • Historical Market Size Value (USD Billion) & Volume (Thousand Units) Analysis By Sales Channel, 2020 to 2024
    • Current and Future Market Size Value (USD Billion) & Volume (Thousand Units) Analysis and Forecast By Sales Channel, 2025 to 2035
      • Direct Sales
      • Supermarkets & Hypermarkets
      • Specialty Sports & Fitness Stores
      • Electronics & Sports Stores
      • Online Retailers
      • Other Sales Channels
    • Y-o-Y Growth Trend Analysis By Sales Channel, 2020 to 2024
    • Absolute $ Opportunity Analysis By Sales Channel, 2025 to 2035
  8. Global Market Analysis 2020 to 2024 and Forecast 2025 to 2035, By Application
    • Introduction/Key Findings
    • Historical Market Size Value (USD Billion) & Volume (Thousand Units) Analysis By Application, 2020 to 2024
    • Current and Future Market Size Value (USD Billion) & Volume (Thousand Units) Analysis and Forecast By Application, 2025 to 2035
      • Professional
      • Amateur
    • Y-o-Y Growth Trend Analysis By Application, 2020 to 2024
    • Absolute $ Opportunity Analysis By Application, 2025 to 2035
  9. Global Market Analysis 2020 to 2024 and Forecast 2025 to 2035, By Region
    • Introduction
    • Historical Market Size Value (USD Billion) & Volume (Thousand Units) Analysis By Region, 2020 to 2024
    • Current Market Size Value (USD Billion) & Volume (Thousand Units) Analysis and Forecast By Region, 2025 to 2035
      • North America
      • Latin America
      • Western Europe
      • Eastern Europe
      • East Asia
      • South Asia & Pacific
      • Middle East and Africa
    • Market Attractiveness Analysis By Region
  10. North America Market Analysis 2020 to 2024 and Forecast 2025 to 2035, By Country
    • Historical Market Size Value (USD Billion) & Volume (Thousand Units) Trend Analysis By Market Taxonomy, 2020 to 2024
    • Market Size Value (USD Billion) & Volume (Thousand Units) Forecast By Market Taxonomy, 2025 to 2035
      • By Country
        • USA
        • Canada
        • Mexico
      • By Product Type
      • By Sales Channel
      • By Application
    • Market Attractiveness Analysis
      • By Country
      • By Product Type
      • By Sales Channel
      • By Application
    • Key Takeaways
  11. Latin America Market Analysis 2020 to 2024 and Forecast 2025 to 2035, By Country
    • Historical Market Size Value (USD Billion) & Volume (Thousand Units) Trend Analysis By Market Taxonomy, 2020 to 2024
    • Market Size Value (USD Billion) & Volume (Thousand Units) Forecast By Market Taxonomy, 2025 to 2035
      • By Country
        • Brazil
        • Argentina
        • Rest of LATAM
      • By Product Type
      • By Sales Channel
      • By Application
    • Market Attractiveness Analysis
      • By Country
      • By Product Type
      • By Sales Channel
      • By Application
    • Key Takeaways
  12. Western Europe Market Analysis 2020 to 2024 and Forecast 2025 to 2035, By Country
    • Historical Market Size Value (USD Billion) & Volume (Thousand Units) Trend Analysis By Market Taxonomy, 2020 to 2024
    • Market Size Value (USD Billion) & Volume (Thousand Units) Forecast By Market Taxonomy, 2025 to 2035
      • By Country
        • Germany
        • Italy
        • France
        • UK
        • Spain
        • BENELUX
        • Nordic
        • Rest of W.Europe
      • By Product Type
      • By Sales Channel
      • By Application
    • Market Attractiveness Analysis
      • By Country
      • By Product Type
      • By Sales Channel
      • By Application
    • Key Takeaways
  13. Eastern Europe Market Analysis 2020 to 2024 and Forecast 2025 to 2035, By Country
    • Historical Market Size Value (USD Billion) & Volume (Thousand Units) Trend Analysis By Market Taxonomy, 2020 to 2024
    • Market Size Value (USD Billion) & Volume (Thousand Units) Forecast By Market Taxonomy, 2025 to 2035
      • By Country
        • Russia
        • Hungary
        • Poland
        • Balkan & Baltics
        • Rest of E. Europe
      • By Product Type
      • By Sales Channel
      • By Application
    • Market Attractiveness Analysis
      • By Country
      • By Product Type
      • By Sales Channel
      • By Application
    • Key Takeaways
  14. East Asia Market Analysis 2020 to 2024 and Forecast 2025 to 2035, By Country
    • Historical Market Size Value (USD Billion) & Volume (Thousand Units) Trend Analysis By Market Taxonomy, 2020 to 2024
    • Market Size Value (USD Billion) & Volume (Thousand Units) Forecast By Market Taxonomy, 2025 to 2035
      • By Country
        • China
        • Japan
        • South Korea
      • By Product Type
      • By Sales Channel
      • By Application
    • Market Attractiveness Analysis
      • By Country
      • By Product Type
      • By Sales Channel
      • By Application
    • Key Takeaways
  15. South Asia & Pacific Market Analysis 2020 to 2024 and Forecast 2025 to 2035, By Country
    • Historical Market Size Value (USD Billion) & Volume (Thousand Units) Trend Analysis By Market Taxonomy, 2020 to 2024
    • Market Size Value (USD Billion) & Volume (Thousand Units) Forecast By Market Taxonomy, 2025 to 2035
      • By Country
        • India
        • Australia & New Zealand
        • ASEAN
        • Rest of SAP
      • By Product Type
      • By Sales Channel
      • By Application
    • Market Attractiveness Analysis
      • By Country
      • By Product Type
      • By Sales Channel
      • By Application
    • Key Takeaways
  16. Middle East and Africa Market Analysis 2020 to 2024 and Forecast 2025 to 2035, By Country
    • Historical Market Size Value (USD Billion) & Volume (Thousand Units) Trend Analysis By Market Taxonomy, 2020 to 2024
    • Market Size Value (USD Billion) & Volume (Thousand Units) Forecast by Market Taxonomy, 2025 to 2035
      • By Country
        • GCC Countries
        • Northern Africa
        • South Africa
        • Turkiye
        • Rest of MEA
      • By Product Type
      • By Sales Channel
      • By Application
    • Market Attractiveness Analysis
      • By Country
      • By Product Type
      • By Sales Channel
      • By Application
    • Key Takeaways
  17. Key Countries Market Analysis
    • USA
      • Pricing Analysis
      • Market Share Analysis, 2024
        • By Product Type
        • By Sales Channel
        • By Application
    • Canada
      • Pricing Analysis
      • Market Share Analysis, 2024
        • By Product Type
        • By Sales Channel
        • By Application
    • Brazil
      • Pricing Analysis
      • Market Share Analysis, 2024
        • By Product Type
        • By Sales Channel
        • By Application
    • Mexico
      • Pricing Analysis
      • Market Share Analysis, 2024
        • By Product Type
        • By Sales Channel
        • By Application
    • Argentina
      • Pricing Analysis
      • Market Share Analysis, 2024
        • By Product Type
        • By Sales Channel
        • By Application
  18. Market Structure Analysis
    • Competition Dashboard
    • Competition Benchmarking
    • Market Share Analysis of Top Players
      • By Regional
      • By Product Type
      • By Sales Channel
      • By Application
  19. Competition Analysis
    • Competition Deep Dive
      • Wilson Sporting Goods Co.
        • Overview
        • Product Portfolio
        • Profitability by Market Segments (Product/Age /Sales Channel/Region)
        • Sales Footprint
        • Strategy Overview
          • Marketing Strategy
          • Product Strategy
          • Channel Strategy
      • Babolat Vibration
        • Overview
        • Product Portfolio
        • Profitability by Market Segments (Product/Age /Sales Channel/Region)
        • Sales Footprint
        • Strategy Overview
          • Marketing Strategy
          • Product Strategy
          • Channel Strategy
      • Head Sports GmbH
        • Overview
        • Product Portfolio
        • Profitability by Market Segments (Product/Age /Sales Channel/Region)
        • Sales Footprint
        • Strategy Overview
          • Marketing Strategy
          • Product Strategy
          • Channel Strategy
      • Prince Global Sports LLC
        • Overview
        • Product Portfolio
        • Profitability by Market Segments (Product/Age /Sales Channel/Region)
        • Sales Footprint
        • Strategy Overview
          • Marketing Strategy
          • Product Strategy
          • Channel Strategy
      • Yonex Co., Ltd.
        • Overview
        • Product Portfolio
        • Profitability by Market Segments (Product/Age /Sales Channel/Region)
        • Sales Footprint
        • Strategy Overview
          • Marketing Strategy
          • Product Strategy
          • Channel Strategy
      • Adidas AG
        • Overview
        • Product Portfolio
        • Profitability by Market Segments (Product/Age /Sales Channel/Region)
        • Sales Footprint
        • Strategy Overview
          • Marketing Strategy
          • Product Strategy
          • Channel Strategy
      • Nike, Inc.
        • Overview
        • Product Portfolio
        • Profitability by Market Segments (Product/Age /Sales Channel/Region)
        • Sales Footprint
        • Strategy Overview
          • Marketing Strategy
          • Product Strategy
          • Channel Strategy
      • Dunlop Sport
        • Overview
        • Product Portfolio
        • Profitability by Market Segments (Product/Age /Sales Channel/Region)
        • Sales Footprint
        • Strategy Overview
          • Marketing Strategy
          • Product Strategy
          • Channel Strategy
      • Asics Corporation
        • Overview
        • Product Portfolio
        • Profitability by Market Segments (Product/Age /Sales Channel/Region)
        • Sales Footprint
        • Strategy Overview
          • Marketing Strategy
          • Product Strategy
          • Channel Strategy
      • Tecnifibre
        • Overview
        • Product Portfolio
        • Profitability by Market Segments (Product/Age /Sales Channel/Region)
        • Sales Footprint
        • Strategy Overview
          • Marketing Strategy
          • Product Strategy
          • Channel Strategy
      • Other Players (As requested)
        • Overview
        • Product Portfolio
        • Profitability by Market Segments (Product/Age /Sales Channel/Region)
        • Sales Footprint
        • Strategy Overview
          • Marketing Strategy
          • Product Strategy
          • Channel Strategy
  20. Assumptions & Acronyms Used
  21. Research Methodology

List of Tables

  • Table 1: Global Market Value (USD Billion) Forecast by Region, 2020-2035
  • Table 2: Global Market Volume (Thousand Units) Forecast by Region, 2020-2035
  • Table 3: Global Market Value (USD Billion) Forecast by Product Type, 2020-2035
  • Table 4: Global Market Volume (Thousand Units) Forecast by Product Type, 2020-2035
  • Table 5: Global Market Value (USD Billion) Forecast by Sales Channel, 2020-2035
  • Table 6: Global Market Volume (Thousand Units) Forecast by Sales Channel, 2020-2035
  • Table 7: Global Market Value (USD Billion) Forecast by Application, 2020-2035
  • Table 8: Global Market Volume (Thousand Units) Forecast by Application, 2020-2035
  • Table 9: North America Market Value (USD Billion) Forecast by Country, 2020-2035
  • Table 10: North America Market Volume (Thousand Units) Forecast by Country, 2020-2035
  • Table 11: North America Market Value (USD Billion) Forecast by Product Type, 2020-2035
  • Table 12: North America Market Volume (Thousand Units) Forecast by Product Type, 2020-2035
  • Table 13: North America Market Value (USD Billion) Forecast by Sales Channel, 2020-2035
  • Table 14: North America Market Volume (Thousand Units) Forecast by Sales Channel, 2020-2035
  • Table 15: North America Market Value (USD Billion) Forecast by Application, 2020-2035
  • Table 16: North America Market Volume (Thousand Units) Forecast by Application, 2020-2035
  • Table 17: Latin America Market Value (USD Billion) Forecast by Country, 2020-2035
  • Table 18: Latin America Market Volume (Thousand Units) Forecast by Country, 2020-2035
  • Table 19: Latin America Market Value (USD Billion) Forecast by Product Type, 2020-2035
  • Table 20: Latin America Market Volume (Thousand Units) Forecast by Product Type, 2020-2035
  • Table 21: Latin America Market Value (USD Billion) Forecast by Sales Channel, 2020-2035
  • Table 22: Latin America Market Volume (Thousand Units) Forecast by Sales Channel, 2020-2035
  • Table 23: Latin America Market Value (USD Billion) Forecast by Application, 2020-2035
  • Table 24: Latin America Market Volume (Thousand Units) Forecast by Application, 2020-2035
  • Table 25: Western Europe Market Value (USD Billion) Forecast by Country, 2020-2035
  • Table 26: Western Europe Market Volume (Thousand Units) Forecast by Country, 2020-2035
  • Table 27: Western Europe Market Value (USD Billion) Forecast by Product Type, 2020-2035
  • Table 28: Western Europe Market Volume (Thousand Units) Forecast by Product Type, 2020-2035
  • Table 29: Western Europe Market Value (USD Billion) Forecast by Sales Channel, 2020-2035
  • Table 30: Western Europe Market Volume (Thousand Units) Forecast by Sales Channel, 2020-2035
  • Table 31: Western Europe Market Value (USD Billion) Forecast by Application, 2020-2035
  • Table 32: Western Europe Market Volume (Thousand Units) Forecast by Application, 2020-2035
  • Table 33: Eastern Europe Market Value (USD Billion) Forecast by Country, 2020-2035
  • Table 34: Eastern Europe Market Volume (Thousand Units) Forecast by Country, 2020-2035
  • Table 35: Eastern Europe Market Value (USD Billion) Forecast by Product Type, 2020-2035
  • Table 36: Eastern Europe Market Volume (Thousand Units) Forecast by Product Type, 2020-2035
  • Table 37: Eastern Europe Market Value (USD Billion) Forecast by Sales Channel, 2020-2035
  • Table 38: Eastern Europe Market Volume (Thousand Units) Forecast by Sales Channel, 2020-2035
  • Table 39: Eastern Europe Market Value (USD Billion) Forecast by Application, 2020-2035
  • Table 40: Eastern Europe Market Volume (Thousand Units) Forecast by Application, 2020-2035
  • Table 41: East Asia Market Value (USD Billion) Forecast by Country, 2020-2035
  • Table 42: East Asia Market Volume (Thousand Units) Forecast by Country, 2020-2035
  • Table 43: East Asia Market Value (USD Billion) Forecast by Product Type, 2020-2035
  • Table 44: East Asia Market Volume (Thousand Units) Forecast by Product Type, 2020-2035
  • Table 45: East Asia Market Value (USD Billion) Forecast by Sales Channel, 2020-2035
  • Table 46: East Asia Market Volume (Thousand Units) Forecast by Sales Channel, 2020-2035
  • Table 47: East Asia Market Value (USD Billion) Forecast by Application, 2020-2035
  • Table 48: East Asia Market Volume (Thousand Units) Forecast by Application, 2020-2035
  • Table 49: South Asia & Pacific Market Value (USD Billion) Forecast by Country, 2020-2035
  • Table 50: South Asia & Pacific Market Volume (Thousand Units) Forecast by Country, 2020-2035
  • Table 51: South Asia & Pacific Market Value (USD Billion) Forecast by Product Type, 2020-2035
  • Table 52: South Asia & Pacific Market Volume (Thousand Units) Forecast by Product Type, 2020-2035
  • Table 53: South Asia & Pacific Market Value (USD Billion) Forecast by Sales Channel, 2020-2035
  • Table 54: South Asia & Pacific Market Volume (Thousand Units) Forecast by Sales Channel, 2020-2035
  • Table 55: South Asia & Pacific Market Value (USD Billion) Forecast by Application, 2020-2035
  • Table 56: South Asia & Pacific Market Volume (Thousand Units) Forecast by Application, 2020-2035
  • Table 57: Middle East and Africa Market Value (USD Billion) Forecast by Country, 2020-2035
  • Table 58: Middle East and Africa Market Volume (Thousand Units) Forecast by Country, 2020-2035
  • Table 59: Middle East and Africa Market Value (USD Billion) Forecast by Product Type, 2020-2035
  • Table 60: Middle East and Africa Market Volume (Thousand Units) Forecast by Product Type, 2020-2035
  • Table 61: Middle East and Africa Market Value (USD Billion) Forecast by Sales Channel, 2020-2035
  • Table 62: Middle East and Africa Market Volume (Thousand Units) Forecast by Sales Channel, 2020-2035
  • Table 63: Middle East and Africa Market Value (USD Billion) Forecast by Application, 2020-2035
  • Table 64: Middle East and Africa Market Volume (Thousand Units) Forecast by Application, 2020-2035

List of Figures

  • Figure 1: Global Market Volume (Thousand Units) Forecast 2020-2035
  • Figure 2: Global Market Pricing Analysis
  • Figure 3: Global Market Value (USD Billion) Forecast 2020-2035
  • Figure 4: Global Market Value Share and BPS Analysis by Product Type, 2025 and 2035
  • Figure 5: Global Market Y-o-Y Growth Comparison by Product Type, 2025-2035
  • Figure 6: Global Market Attractiveness Analysis by Product Type
  • Figure 7: Global Market Value Share and BPS Analysis by Sales Channel, 2025 and 2035
  • Figure 8: Global Market Y-o-Y Growth Comparison by Sales Channel, 2025-2035
  • Figure 9: Global Market Attractiveness Analysis by Sales Channel
  • Figure 10: Global Market Value Share and BPS Analysis by Application, 2025 and 2035
  • Figure 11: Global Market Y-o-Y Growth Comparison by Application, 2025-2035
  • Figure 12: Global Market Attractiveness Analysis by Application
  • Figure 13: Global Market Value (USD Billion) Share and BPS Analysis by Region, 2025 and 2035
  • Figure 14: Global Market Y-o-Y Growth Comparison by Region, 2025-2035
  • Figure 15: Global Market Attractiveness Analysis by Region
  • Figure 16: North America Market Incremental $ Opportunity, 2025-2035
  • Figure 17: Latin America Market Incremental $ Opportunity, 2025-2035
  • Figure 18: Western Europe Market Incremental $ Opportunity, 2025-2035
  • Figure 19: Eastern Europe Market Incremental $ Opportunity, 2025-2035
  • Figure 20: East Asia Market Incremental $ Opportunity, 2025-2035
  • Figure 21: South Asia & Pacific Market Incremental $ Opportunity, 2025-2035
  • Figure 22: Middle East and Africa Market Incremental $ Opportunity, 2025-2035
  • Figure 23: North America Market Value Share and BPS Analysis by Country, 2025 and 2035
  • Figure 24: North America Market Value Share and BPS Analysis by Product Type, 2025 and 2035
  • Figure 25: North America Market Y-o-Y Growth Comparison by Product Type, 2025-2035
  • Figure 26: North America Market Attractiveness Analysis by Product Type
  • Figure 27: North America Market Value Share and BPS Analysis by Sales Channel, 2025 and 2035
  • Figure 28: North America Market Y-o-Y Growth Comparison by Sales Channel, 2025-2035
  • Figure 29: North America Market Attractiveness Analysis by Sales Channel
  • Figure 30: North America Market Value Share and BPS Analysis by Application, 2025 and 2035
  • Figure 31: North America Market Y-o-Y Growth Comparison by Application, 2025-2035
  • Figure 32: North America Market Attractiveness Analysis by Application
  • Figure 33: Latin America Market Value Share and BPS Analysis by Country, 2025 and 2035
  • Figure 34: Latin America Market Value Share and BPS Analysis by Product Type, 2025 and 2035
  • Figure 35: Latin America Market Y-o-Y Growth Comparison by Product Type, 2025-2035
  • Figure 36: Latin America Market Attractiveness Analysis by Product Type
  • Figure 37: Latin America Market Value Share and BPS Analysis by Sales Channel, 2025 and 2035
  • Figure 38: Latin America Market Y-o-Y Growth Comparison by Sales Channel, 2025-2035
  • Figure 39: Latin America Market Attractiveness Analysis by Sales Channel
  • Figure 40: Latin America Market Value Share and BPS Analysis by Application, 2025 and 2035
  • Figure 41: Latin America Market Y-o-Y Growth Comparison by Application, 2025-2035
  • Figure 42: Latin America Market Attractiveness Analysis by Application
  • Figure 43: Western Europe Market Value Share and BPS Analysis by Country, 2025 and 2035
  • Figure 44: Western Europe Market Value Share and BPS Analysis by Product Type, 2025 and 2035
  • Figure 45: Western Europe Market Y-o-Y Growth Comparison by Product Type, 2025-2035
  • Figure 46: Western Europe Market Attractiveness Analysis by Product Type
  • Figure 47: Western Europe Market Value Share and BPS Analysis by Sales Channel, 2025 and 2035
  • Figure 48: Western Europe Market Y-o-Y Growth Comparison by Sales Channel, 2025-2035
  • Figure 49: Western Europe Market Attractiveness Analysis by Sales Channel
  • Figure 50: Western Europe Market Value Share and BPS Analysis by Application, 2025 and 2035
  • Figure 51: Western Europe Market Y-o-Y Growth Comparison by Application, 2025-2035
  • Figure 52: Western Europe Market Attractiveness Analysis by Application
  • Figure 53: Eastern Europe Market Value Share and BPS Analysis by Country, 2025 and 2035
  • Figure 54: Eastern Europe Market Value Share and BPS Analysis by Product Type, 2025 and 2035
  • Figure 55: Eastern Europe Market Y-o-Y Growth Comparison by Product Type, 2025-2035
  • Figure 56: Eastern Europe Market Attractiveness Analysis by Product Type
  • Figure 57: Eastern Europe Market Value Share and BPS Analysis by Sales Channel, 2025 and 2035
  • Figure 58: Eastern Europe Market Y-o-Y Growth Comparison by Sales Channel, 2025-2035
  • Figure 59: Eastern Europe Market Attractiveness Analysis by Sales Channel
  • Figure 60: Eastern Europe Market Value Share and BPS Analysis by Application, 2025 and 2035
  • Figure 61: Eastern Europe Market Y-o-Y Growth Comparison by Application, 2025-2035
  • Figure 62: Eastern Europe Market Attractiveness Analysis by Application
  • Figure 63: East Asia Market Value Share and BPS Analysis by Country, 2025 and 2035
  • Figure 64: East Asia Market Value Share and BPS Analysis by Product Type, 2025 and 2035
  • Figure 65: East Asia Market Y-o-Y Growth Comparison by Product Type, 2025-2035
  • Figure 66: East Asia Market Attractiveness Analysis by Product Type
  • Figure 67: East Asia Market Value Share and BPS Analysis by Sales Channel, 2025 and 2035
  • Figure 68: East Asia Market Y-o-Y Growth Comparison by Sales Channel, 2025-2035
  • Figure 69: East Asia Market Attractiveness Analysis by Sales Channel
  • Figure 70: East Asia Market Value Share and BPS Analysis by Application, 2025 and 2035
  • Figure 71: East Asia Market Y-o-Y Growth Comparison by Application, 2025-2035
  • Figure 72: East Asia Market Attractiveness Analysis by Application
  • Figure 73: South Asia & Pacific Market Value Share and BPS Analysis by Country, 2025 and 2035
  • Figure 74: South Asia & Pacific Market Value Share and BPS Analysis by Product Type, 2025 and 2035
  • Figure 75: South Asia & Pacific Market Y-o-Y Growth Comparison by Product Type, 2025-2035
  • Figure 76: South Asia & Pacific Market Attractiveness Analysis by Product Type
  • Figure 77: South Asia & Pacific Market Value Share and BPS Analysis by Sales Channel, 2025 and 2035
  • Figure 78: South Asia & Pacific Market Y-o-Y Growth Comparison by Sales Channel, 2025-2035
  • Figure 79: South Asia & Pacific Market Attractiveness Analysis by Sales Channel
  • Figure 80: South Asia & Pacific Market Value Share and BPS Analysis by Application, 2025 and 2035
  • Figure 81: South Asia & Pacific Market Y-o-Y Growth Comparison by Application, 2025-2035
  • Figure 82: South Asia & Pacific Market Attractiveness Analysis by Application
  • Figure 83: Middle East and Africa Market Value Share and BPS Analysis by Country, 2025 and 2035
  • Figure 84: Middle East and Africa Market Value Share and BPS Analysis by Product Type, 2025 and 2035
  • Figure 85: Middle East and Africa Market Y-o-Y Growth Comparison by Product Type, 2025-2035
  • Figure 86: Middle East and Africa Market Attractiveness Analysis by Product Type
  • Figure 87: Middle East and Africa Market Value Share and BPS Analysis by Sales Channel, 2025 and 2035
  • Figure 88: Middle East and Africa Market Y-o-Y Growth Comparison by Sales Channel, 2025-2035
  • Figure 89: Middle East and Africa Market Attractiveness Analysis by Sales Channel
  • Figure 90: Middle East and Africa Market Value Share and BPS Analysis by Application, 2025 and 2035
  • Figure 91: Middle East and Africa Market Y-o-Y Growth Comparison by Application, 2025-2035
  • Figure 92: Middle East and Africa Market Attractiveness Analysis by Application
  • Figure 93: Global Market - Tier Structure Analysis
  • Figure 94: Global Market - Company Share Analysis

Frequently Asked Questions

What is the projected industry value of the tennis equipment market in 2025?

The industry is projected to reach USD 166.1 million in 2025.

What is the expected global CAGR for the tennis equipment market from 2025 to 2035?

The industry is expected to grow at a CAGR of 4.9% from 2025 to 2035.

Which segment is expected to dominate the tennis equipment market in 2025?

Apparel is expected to capture 32.5% of the industry share in 2025.

Which region is forecasted to show significant growth in the tennis equipment market by 2035?

China is projected to register the highest CAGR of 9.2% from 2025 to 2035.

What is the forecasted industry value of the tennis equipment market by 2035?

The industry is projected to reach USD 265.8 million by 2035.

Explore Similar Insights

Future Market Insights

Tennis Equipment Market