Reports

- Global Locations -

Headquarters

Future Market Insights, Inc.

Christiana Corporate, 200
Continental Drive, Suite 401,
Newark, Delaware - 19713,
United States

T: +1-845-579-5705

Americas

Future Market Insights, Inc.

616 Corporate Way, Suite 2-9018,
Valley Cottage, NY 10989, United States

T: +1-347-918-3531

MEA

Future Market Insights

1602-6 Jumeirah Bay X2 Tower, Plot No: JLT-PH2-X2A,
Jumeirah Lakes Towers, Dubai,
United Arab Emirates

Europe

Future Market Insights

3rd Floor, 207 Regent Street,
W1B 3HH London
United Kingdom

T: + 44 (0) 20 8123 9659
D: +44 (0) 20 3287 4268

Asia Pacific

Future Market Insights

IndiaLand Global Tech Park, Unit UG-1, Behind Grand HighStreet, Phase 1, Hinjawadi, MH, Pune – 411057, India

Golf Equipment Market Outlook for 2024 to 2034

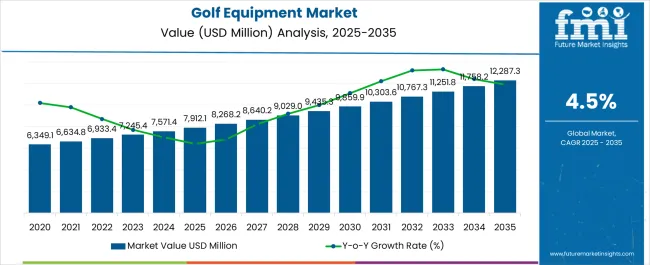
The golf equipment market size is projected to exceed US$ 7,571.4 million in 2024. The industry is projected to surpass a valuation of US$ 11,758.1 million by 2034. The prevalence of online retail channels and the demand for customization options reshape the sales outlook. Consumers, attracted by the convenience of online shopping, increasingly seek personalized golf equipment to match their playing style.

The sales of golf equipment are anticipated to rise at a CAGR of 4.50% from 2024 to 2034. Golf equipment manufacturers enhance their online presence with user-friendly platforms for customization. Virtual fitting tools, interactive product configurators, and online-exclusive offers cater to the growing demand for personalized shopping experiences.

Sales Analysis of the Golf Equipment

  • A notable surge in global golf participation is a primary catalyst for increased sales. The rising popularity of golf as both a competitive sport and a leisure activity significantly drives the demand for essential equipment such as clubs, balls, and accessories.
  • Leading manufacturers strategically invest in promoting golf as an inclusive and accessible sport. Collaborations with golf influencers and the creation of entry-level equipment bundles aim to attract new participants and boost equipment sales.
  • The growth of golf tourism contributes to increased equipment sales as enthusiasts often invest in new gear during travel for golf-centric experiences and tournaments.
  • The rising awareness of sustainability influences purchasing decisions, with golfers expressing a preference for eco-friendly equipment. Brands emphasizing sustainability gain favor among environmentally conscious consumers.
Attributes Details
Golf Equipment Market Value for 2024 US$ 7,571.4 million
Golf Equipment Market Value for 2034 US$ 11,758.1 million
Golf Equipment Market Forecast CAGR for 2024 to 2034 4.50%

Don't pay for what you don't need

Customize your report by selecting specific countries or regions and save 30%!

Historical Performance and Future Growth of the Golf Equipment Market

CAGR from 2019 to 2023 3.40%
CAGR from 2024 to 2034 4.50%

The golf equipment market has exhibited a notable shift in its CAGR over the years. During 2019 to 2023, the industry witnessed a CAGR of 3.40%. Moderate economic conditions and a relatively stable golfing industry have contributed to the steady yet restrained growth during this period. Golf equipment manufacturers focused on introducing incremental innovations, sustaining existing consumer bases, and navigating challenges.

The projected CAGR of 4.50% from 2024 to 2034 signifies an optimistic outlook for the golf equipment market, indicating an acceleration in growth.

  • Anticipated growth in global golf tourism, driven by increased disposable incomes and a resurgence of interest in recreational activities, is poised to elevate the demand for high-quality and specialized golf equipment. Popular golfing destinations are expected to witness a surge in equipment purchases.
  • Efforts towards inclusivity, including adaptive equipment for individuals with disabilities and strategic market expansion initiatives, are likely to broaden the market reach. These endeavors may attract new demographics, fostering a more diverse and expansive customer base.
  • Collaborations between golf equipment manufacturers and notable players, influencers, or even professional golfers are likely to increase brand visibility and consumer trust. Limited edition releases and exclusive partnerships can further drive growth during this period.

Key Trends Influencing the Golf Equipment Market

  • Online Retail and Direct-to-Consumer Models

A notable shift in the distribution landscape involves the increasing prevalence of online retail channels and direct-to-consumer models. Golfers are exploring and purchasing equipment through digital platforms, prompting manufacturers to strengthen their online presence and offer exclusive online deals.

  • Focus on Game Improvement Technologies

Golf equipment trends are leaning towards technologies focused on game improvement. This includes forgiving club designs, anti-slice technology, and enhanced ball features to make the game more accessible and enjoyable for players of all skill levels.

  • Rise of Women's Golf Equipment Market

The women's golf equipment market is experiencing a surge, with manufacturers recognizing the growing interest among female golfers. Specially designed clubs, balls, and apparel tailored to women's preferences and performance needs are gaining prominence.

  • Affordable and Entry-Level Equipment

To encourage new entrants and enhance accessibility, there is a trend towards the development of affordable and entry-level golf equipment. Starter sets, budget-friendly clubs, and discounted packages cater to beginners and casual golf enthusiasts.

  • Growth in Golf Fitness Equipment

The nexus between golf and fitness is reflected in the rising popularity of golf fitness equipment. Products targeting strength, flexibility, and overall fitness specific to golfers are gaining attention as players recognize the importance of physical conditioning for optimal performance.

Sudip Saha
Sudip Saha

Principal Consultant

Talk to Analyst

Find your sweet spots for generating winning opportunities in this market.

Comparative View of the Adjacent Golf Equipment Market

The tables below offer a comparative analysis of the golf equipment market with two related industries, the golf outfit market and the golf training aids market. The section provides a better understanding of growth prospects, opportunities, and key trends shaping the trajectories in each from 2024 to 2034.

Golf Equipment Market:

Attributes Golf Equipment Market
Value-based CAGR (2024 to 2034) 4.50%
Growth Factor The infusion of advanced technologies and the surge in global golf tourism propel sustained growth in the golf equipment market
Opportunity Manufacturers can harness the power of sustainability trends and strategic partnerships
Key Trends A trend towards upcycled golf equipment, repurposing materials from retired clubs and gear to create new, environmentally conscious products with a unique, recycled aesthetic.

Golf Outfit Market:

Attributes Golf Outfit Market
Value-based CAGR (2024 to 2034) 7.6%
Growth Factor Fashion trends and the rising popularity of golf-inspired lifestyle apparel fuel robust growth in the golf outfit market
Opportunity Manufacturers stand to benefit by meeting the demand for stylish and performance-oriented golf outfits for both dedicated and casual golfers
Key Trends Key trends involve the fusion of performance fabrics with fashion-forward designs, sustainable outfit options, and collaborations with renowned designers

Golf Training Aids Market:

Attributes Golf Training Aids Market
Value-based CAGR (2024 to 2034) 5.10%
Growth Factor Sustained growth in the golf training aids market is fueled by a relentless focus on skill elevation and technological innovations
Opportunity Manufacturers can seize the opportunity in a burgeoning market of golf enthusiasts seeking effective and personalized training solutions
Key Trends Noteworthy trends include advanced technology integration, portable training tools, and personalized training experiences for diverse consumer needs

Category-wise Insights

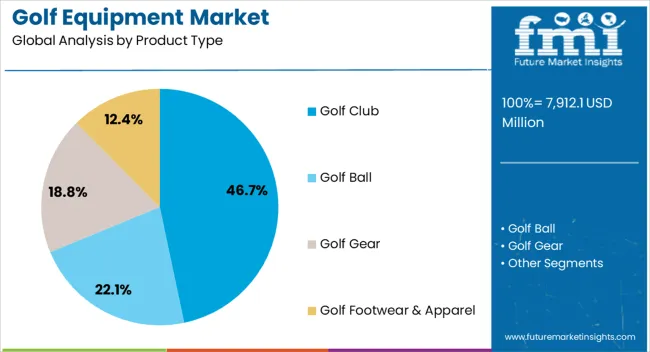
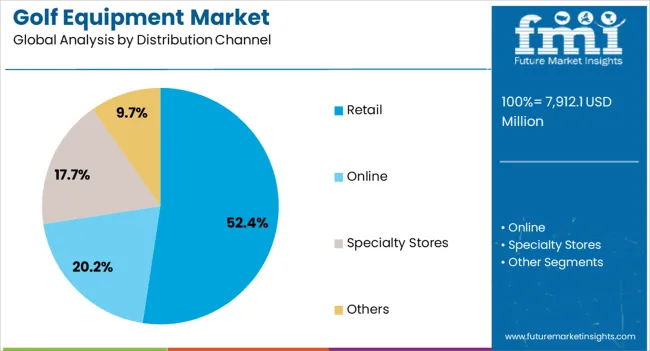
This section offers a comprehensive exploration of key categories shaping the golf equipment market, with a focus on the dominance of the Golf Club Segment and the significance of the Retail Sales Channel. The analysis focuses on the golf club segment's dominant position, projecting a substantial share of 35.10% in 2024. The retail sales channel is projected to register a rise in sales of golf equipment, capturing a significant share of 47.10% in 2024.

Golf Club Segment to Dominate Golf Equipment Industry with a Share of 35.10% in 2024

Attributes Detail
By Product Golf Club
Market Share in 2024 35.10%

The golf club segment is projected to be the market leader in 2024, capturing a significant 35.10% share.

  • Manufacturers are constantly innovating and introducing new club technologies that improve performance and appeal to a wider range of golfers.
  • The availability of clubs catering to different skill levels and preferences is attracting new players and encouraging existing players to upgrade their equipment.
  • The market is witnessing a growing demand for high-quality, premium clubs that offer superior performance and aesthetics.

Retail Sales Channel Predicted to Register Spike in Sales of Golf Equipment in 2024

Attributes Detail
Dominating Sales Channel Retail
Market Share in 2024 47.10%

The retail segment is expected to be the dominant sales channel for golf equipment in 2024, accounting for a substantial 47.10% share of the market.
  • Retail stores offer a convenient and accessible way for golfers to purchase equipment, allowing them to try out products and seek expert advice before deciding.
  • Retailers typically offer a wider selection of brands and models compared to other sales channels, catering to a broader range of customer needs and preferences.
  • Retail stores often run promotions and discounts, making golf equipment more affordable and attracting price-conscious consumers.
  • Many retailers are investing in enhancing the shopping experience by providing interactive displays, digital tools, and knowledgeable staff, contributing to increased customer satisfaction and sales.

Get the data you need at a Fraction of the cost

Personalize your report by choosing insights you need
and save 40%!

Country-wise Insights

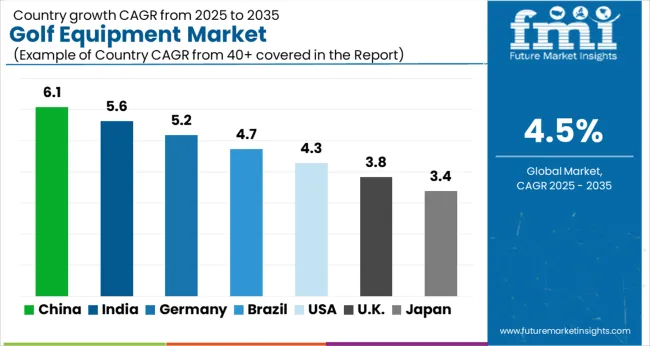
This section offers the country-wise analysis of the golf equipment industry with their respective CAGR through 2034. Examining each country individually, the focus is on revealing untapped opportunities and key trends influencing golf equipment sales.

Countries CAGR through 2034
United States 19.80%
Germany 20.50%
China 20.30%
India 20.80%
United Kingdom 21.10%

Golf Equipment Industry in the United States

The United States golf equipment industry is anticipated to experience a 19.8% CAGR through 2034.

  • The United States boasts a long history and deep-rooted passion for golf, with a large and dedicated player base.
  • Leading manufacturers continue to invest in cutting-edge technologies, enhancing performance and attracting tech-savvy golfers.
  • A strong and stable economy ensures that consumers have the disposable income to invest in golf equipment.
  • Initiatives like "Get Golf Ready" are attracting new players, particularly among younger demographics, expanding the market.

Golf Equipment Industry in Germany

The Germany golf equipment industry is projected to experience a significant CAGR of 20.5% through 2034.

  • Golf is experiencing a surge in popularity in Germany, with a rising number of players taking up the sport.
  • Government initiatives to promote sports participation and develop golf infrastructure are creating a supportive environment for the market.
  • German manufacturers are at the forefront of innovative golf equipment technology, attracting both domestic and international players.
  • Germany's thriving tourism industry attracts a significant number of golfers, contributing to equipment sales.

Golf Equipment Industry in China

The China golf equipment industry is expected to witness a 20.3% CAGR through 2034.

  • China's booming economy is creating a growing middle class with disposable income to invest in leisure activities like golf.
  • The rapid urbanization of China is leading to the development of more golf courses and driving demand for equipment.
  • The Chinese government's support for golf as a sport is creating a more favorable environment for market growth.

Golf Equipment Industry in India

The India golf equipment industry is poised to witness a CAGR of 20.8% through 2034.

  • Government initiatives promoting golf as a sport and developing new golf courses are attracting new players and driving demand for equipment.
  • The increasing number of golf academies and training facilities is providing easier access to the sport, leading to more participants and equipment sales.
  • Leading equipment manufacturers are introducing new and innovative products tailored to the Indian market, making golf more accessible and enjoyable for players of all skill levels.
  • The booming eCommerce industry in India facilitates online sales of golf equipment, providing greater convenience and reach for consumers.

Golf Equipment Industry in the United Kingdom

The United Kingdom golf equipment industry is projected to experience a steady CAGR of 21.1% through 2034.

  • Golf has a long and rich history in the United Kingdom, with a passionate community of players and dedicated facilities.
  • The United Kingdom's strong economy ensures that consumers have the disposable income to invest in golf equipment.
  • United Kingdom-based manufacturers are actively contributing to advancements in golf equipment technology.
  • Sustainable practices are becoming increasingly important to United Kingdom consumers, influencing their purchasing decisions.
  • Online platforms are gaining popularity for purchasing golf equipment in the United Kingdom, offering convenience and wider selection.

Companies Shaping the Future Outlook of the Golf Equipment Industry

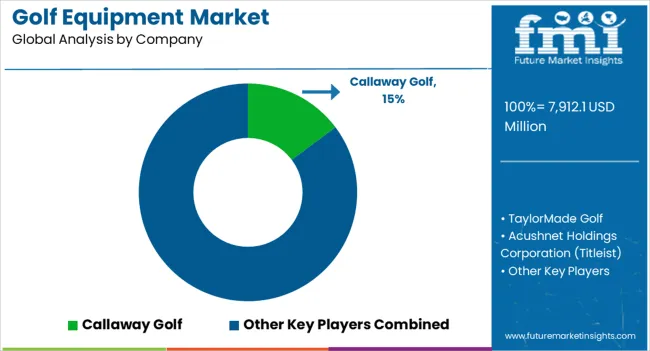
The global golf equipment market is fiercely competitive, featuring established industry giants and emerging contenders striving to establish their presence. These brands, renowned for their commitment to quality and innovation, have successfully cultivated dedicated customer bases, making it challenging for new entrants to gain traction.

Several strategic elements contribute to the competition in the golf equipment industry. Manufacturers allocate substantial investments in research and development, fostering continuous product enhancement. This dedication to innovation is a deterrent for smaller players lacking the resources to compete effectively.
Top Players in the Golf Equipment Industry

  • Callaway Golf
  • TaylorMade Golf
  • Acushnet Holdings Corporation (Titleist)
  • Bridgestone Corporation
  • Mizuno Corporation
  • Wilson Sporting Goods
  • PING Inc
  • SRI Sports Limited (Dunlop, Cleveland, Srixon)
  • Nike, Inc.
  • Yonex Co., Ltd.
  • Cobra Golf

Recent Developments in the Golf Equipment Industry

  • Callaway Golf launched their Paradym Star Woods, featuring a new titanium face design for explosive distance and forgiveness. Also introduced Apex UW multi-material wedges with a forged face for increased precision and control.
  • TaylorMade Golf launched their Stealth Plus+ irons, combining forged construction with a revolutionary face insert for explosive distance and a tour-proven feel. Released the Spider GT Max putter with a larger footprint and stabilizing wings for improved alignment and forgiveness.
  • Titleist introduced the TSi3 driver with a smaller profile and redesigned crown for improved aerodynamics and workability. Launched the TSR2 and TSR3 irons, featuring a forged construction and hollow body design for distance and forgiveness.

Key Segments

By Product Type:

  • Golf Club
  • Golf Ball
  • Golf Gear
  • Golf Footwear & Apparel

By Distribution Channel:

  • Retail
  • Online
  • Specialty stores
  • Others

By Price:

  • Low
  • Mid
  • High

By Region:

  • North America
  • Latin America
  • Europe
  • East Asia
  • South Asia
  • Middle East and Africa

Frequently Asked Questions

What is the Market Potential for Golf Equipment?

The golf equipment market is projected to expand at a CAGR of 4.50% between 2024 and 2034.

Which Product Segment Dominates the Golf Equipment Market?

The golf club segment dominates the golf equipment industry.

Who are the Top Golf Equipment Companies?

Callaway Golf, TaylorMade Golf, and Bridgestone Corporation are some of the top golf equipment manufacturers.

What is the Golf Equipment Market Growth Outlook for 2034?

The golf equipment market is anticipated to surpass US$ 11,758.1 million by 2034.

Which Trend is Driving the Demand for Golf Equipment Through 2034?

The surge in online sales and the growing popularity of direct-to-consumer brands are significant trends propelling the demand for golf equipment through 2034

Table of Content

1. Executive Summary

    1.1. Global Market Outlook

    1.2. Demand-side Trends

    1.3. Supply-side Trends

    1.4. Technology Roadmap Analysis

    1.5. Analysis and Recommendations

2. Market Overview

    2.1. Market Coverage / Taxonomy

    2.2. Market Definition / Scope / Limitations

3. Market Background

    3.1. Market Dynamics

        3.1.1. Drivers

        3.1.2. Restraints

        3.1.3. Opportunity

        3.1.4. Trends

    3.2. Scenario Forecast

        3.2.1. Demand in Optimistic Scenario

        3.2.2. Demand in Likely Scenario

        3.2.3. Demand in Conservative Scenario

    3.3. Opportunity Map Analysis

    3.4. Product Life Cycle Analysis

    3.5. Supply Chain Analysis

        3.5.1. Supply Side Participants and their Roles

            3.5.1.1. Producers

            3.5.1.2. Mid-Level Participants (Traders/ Agents/ Brokers)

            3.5.1.3. Wholesalers and Distributors

        3.5.2. Value Added and Value Created at Node in the Supply Chain

        3.5.3. List of Raw Material Suppliers

        3.5.4. List of Existing and Potential Buyer’s

    3.6. Investment Feasibility Matrix

    3.7. Value Chain Analysis

        3.7.1. Profit Margin Analysis

        3.7.2. Wholesalers and Distributors

        3.7.3. Retailers

    3.8. PESTLE and Porter’s Analysis

    3.9. Regulatory Landscape

        3.9.1. By Key Regions

        3.9.2. By Key Countries

    3.10. Regional Parent Market Outlook

    3.11. Production and Consumption Statistics

    3.12. Import and Export Statistics

4. Global Market Analysis 2019 to 2023 and Forecast, 2024 to 2034

    4.1. Historical Market Size Value (US$ Million) & Volume (Units) Analysis, 2019 to 2023

    4.2. Current and Future Market Size Value (US$ Million) & Volume (Units) Projections, 2024 to 2034

        4.2.1. Y-o-Y Growth Trend Analysis

        4.2.2. Absolute $ Opportunity Analysis

5. Global Market Analysis 2019 to 2023 and Forecast 2024 to 2034, By Product

    5.1. Introduction / Key Findings

    5.2. Historical Market Size Value (US$ Million) & Volume (Units) Analysis By Product, 2019 to 2023

    5.3. Current and Future Market Size Value (US$ Million) & Volume (Units) Analysis and Forecast By Product, 2024 to 2034

        5.3.1. Golf Club

        5.3.2. Golf Balls

        5.3.3. Golf Gear

        5.3.4. Golf Footwear & Apparel

    5.4. Y-o-Y Growth Trend Analysis By Product, 2019 to 2023

    5.5. Absolute $ Opportunity Analysis By Product, 2024 to 2034

6. Global Market Analysis 2019 to 2023 and Forecast 2024 to 2034, By Distribution Channel

    6.1. Introduction / Key Findings

    6.2. Historical Market Size Value (US$ Million) & Volume (Units) Analysis By Distribution Channel, 2019 to 2023

    6.3. Current and Future Market Size Value (US$ Million) & Volume (Units) Analysis and Forecast By Distribution Channel, 2024 to 2034

        6.3.1. Sporting Goods Retailer

        6.3.2. On-course Shops

        6.3.3. Online

        6.3.4. Others

    6.4. Y-o-Y Growth Trend Analysis By Distribution Channel, 2019 to 2023

    6.5. Absolute $ Opportunity Analysis By Distribution Channel, 2024 to 2034

7. Global Market Analysis 2019 to 2023 and Forecast 2024 to 2034, By Region

    7.1. Introduction

    7.2. Historical Market Size Value (US$ Million) & Volume (Units) Analysis By Region, 2019 to 2023

    7.3. Current Market Size Value (US$ Million) & Volume (Units) Analysis and Forecast By Region, 2024 to 2034

        7.3.1. North America

        7.3.2. Latin America

        7.3.3. Western Europe

        7.3.4. Eastern Europe

        7.3.5. South Asia and Pacific

        7.3.6. East Asia

        7.3.7. Middle East and Africa

    7.4. Market Attractiveness Analysis By Region

8. North America Market Analysis 2019 to 2023 and Forecast 2024 to 2034, By Country

    8.1. Historical Market Size Value (US$ Million) & Volume (Units) Trend Analysis By Market Taxonomy, 2019 to 2023

    8.2. Market Size Value (US$ Million) & Volume (Units) Forecast By Market Taxonomy, 2024 to 2034

        8.2.1. By Country

            8.2.1.1. USA

            8.2.1.2. Canada

        8.2.2. By Product

        8.2.3. By Distribution Channel

    8.3. Market Attractiveness Analysis

        8.3.1. By Country

        8.3.2. By Product

        8.3.3. By Distribution Channel

    8.4. Key Takeaways

9. Latin America Market Analysis 2019 to 2023 and Forecast 2024 to 2034, By Country

    9.1. Historical Market Size Value (US$ Million) & Volume (Units) Trend Analysis By Market Taxonomy, 2019 to 2023

    9.2. Market Size Value (US$ Million) & Volume (Units) Forecast By Market Taxonomy, 2024 to 2034

        9.2.1. By Country

            9.2.1.1. Brazil

            9.2.1.2. Mexico

            9.2.1.3. Rest of Latin America

        9.2.2. By Product

        9.2.3. By Distribution Channel

    9.3. Market Attractiveness Analysis

        9.3.1. By Country

        9.3.2. By Product

        9.3.3. By Distribution Channel

    9.4. Key Takeaways

10. Western Europe Market Analysis 2019 to 2023 and Forecast 2024 to 2034, By Country

    10.1. Historical Market Size Value (US$ Million) & Volume (Units) Trend Analysis By Market Taxonomy, 2019 to 2023

    10.2. Market Size Value (US$ Million) & Volume (Units) Forecast By Market Taxonomy, 2024 to 2034

        10.2.1. By Country

            10.2.1.1. Germany

            10.2.1.2. UK

            10.2.1.3. France

            10.2.1.4. Spain

            10.2.1.5. Italy

            10.2.1.6. Rest of Western Europe

        10.2.2. By Product

        10.2.3. By Distribution Channel

    10.3. Market Attractiveness Analysis

        10.3.1. By Country

        10.3.2. By Product

        10.3.3. By Distribution Channel

    10.4. Key Takeaways

11. Eastern Europe Market Analysis 2019 to 2023 and Forecast 2024 to 2034, By Country

    11.1. Historical Market Size Value (US$ Million) & Volume (Units) Trend Analysis By Market Taxonomy, 2019 to 2023

    11.2. Market Size Value (US$ Million) & Volume (Units) Forecast By Market Taxonomy, 2024 to 2034

        11.2.1. By Country

            11.2.1.1. Poland

            11.2.1.2. Russia

            11.2.1.3. Czech Republic

            11.2.1.4. Romania

            11.2.1.5. Rest of Eastern Europe

        11.2.2. By Product

        11.2.3. By Distribution Channel

    11.3. Market Attractiveness Analysis

        11.3.1. By Country

        11.3.2. By Product

        11.3.3. By Distribution Channel

    11.4. Key Takeaways

12. South Asia and Pacific Market Analysis 2019 to 2023 and Forecast 2024 to 2034, By Country

    12.1. Historical Market Size Value (US$ Million) & Volume (Units) Trend Analysis By Market Taxonomy, 2019 to 2023

    12.2. Market Size Value (US$ Million) & Volume (Units) Forecast By Market Taxonomy, 2024 to 2034

        12.2.1. By Country

            12.2.1.1. India

            12.2.1.2. Bangladesh

            12.2.1.3. Australia

            12.2.1.4. New Zealand

            12.2.1.5. Rest of South Asia and Pacific

        12.2.2. By Product

        12.2.3. By Distribution Channel

    12.3. Market Attractiveness Analysis

        12.3.1. By Country

        12.3.2. By Product

        12.3.3. By Distribution Channel

    12.4. Key Takeaways

13. East Asia Market Analysis 2019 to 2023 and Forecast 2024 to 2034, By Country

    13.1. Historical Market Size Value (US$ Million) & Volume (Units) Trend Analysis By Market Taxonomy, 2019 to 2023

    13.2. Market Size Value (US$ Million) & Volume (Units) Forecast By Market Taxonomy, 2024 to 2034

        13.2.1. By Country

            13.2.1.1. China

            13.2.1.2. Japan

            13.2.1.3. South Korea

        13.2.2. By Product

        13.2.3. By Distribution Channel

    13.3. Market Attractiveness Analysis

        13.3.1. By Country

        13.3.2. By Product

        13.3.3. By Distribution Channel

    13.4. Key Takeaways

14. Middle East and Africa Market Analysis 2019 to 2023 and Forecast 2024 to 2034, By Country

    14.1. Historical Market Size Value (US$ Million) & Volume (Units) Trend Analysis By Market Taxonomy, 2019 to 2023

    14.2. Market Size Value (US$ Million) & Volume (Units) Forecast By Market Taxonomy, 2024 to 2034

        14.2.1. By Country

            14.2.1.1. GCC Countries

            14.2.1.2. South Africa

            14.2.1.3. Israel

            14.2.1.4. Rest of MEA

        14.2.2. By Product

        14.2.3. By Distribution Channel

    14.3. Market Attractiveness Analysis

        14.3.1. By Country

        14.3.2. By Product

        14.3.3. By Distribution Channel

    14.4. Key Takeaways

15. Key Countries Market Analysis

    15.1. USA

        15.1.1. Pricing Analysis

        15.1.2. Market Share Analysis, 2023

            15.1.2.1. By Product

            15.1.2.2. By Distribution Channel

    15.2. Canada

        15.2.1. Pricing Analysis

        15.2.2. Market Share Analysis, 2023

            15.2.2.1. By Product

            15.2.2.2. By Distribution Channel

    15.3. Brazil

        15.3.1. Pricing Analysis

        15.3.2. Market Share Analysis, 2023

            15.3.2.1. By Product

            15.3.2.2. By Distribution Channel

    15.4. Mexico

        15.4.1. Pricing Analysis

        15.4.2. Market Share Analysis, 2023

            15.4.2.1. By Product

            15.4.2.2. By Distribution Channel

    15.5. Germany

        15.5.1. Pricing Analysis

        15.5.2. Market Share Analysis, 2023

            15.5.2.1. By Product

            15.5.2.2. By Distribution Channel

    15.6. UK

        15.6.1. Pricing Analysis

        15.6.2. Market Share Analysis, 2023

            15.6.2.1. By Product

            15.6.2.2. By Distribution Channel

    15.7. France

        15.7.1. Pricing Analysis

        15.7.2. Market Share Analysis, 2023

            15.7.2.1. By Product

            15.7.2.2. By Distribution Channel

    15.8. Spain

        15.8.1. Pricing Analysis

        15.8.2. Market Share Analysis, 2023

            15.8.2.1. By Product

            15.8.2.2. By Distribution Channel

    15.9. Italy

        15.9.1. Pricing Analysis

        15.9.2. Market Share Analysis, 2023

            15.9.2.1. By Product

            15.9.2.2. By Distribution Channel

    15.10. Poland

        15.10.1. Pricing Analysis

        15.10.2. Market Share Analysis, 2023

            15.10.2.1. By Product

            15.10.2.2. By Distribution Channel

    15.11. Russia

        15.11.1. Pricing Analysis

        15.11.2. Market Share Analysis, 2023

            15.11.2.1. By Product

            15.11.2.2. By Distribution Channel

    15.12. Czech Republic

        15.12.1. Pricing Analysis

        15.12.2. Market Share Analysis, 2023

            15.12.2.1. By Product

            15.12.2.2. By Distribution Channel

    15.13. Romania

        15.13.1. Pricing Analysis

        15.13.2. Market Share Analysis, 2023

            15.13.2.1. By Product

            15.13.2.2. By Distribution Channel

    15.14. India

        15.14.1. Pricing Analysis

        15.14.2. Market Share Analysis, 2023

            15.14.2.1. By Product

            15.14.2.2. By Distribution Channel

    15.15. Bangladesh

        15.15.1. Pricing Analysis

        15.15.2. Market Share Analysis, 2023

            15.15.2.1. By Product

            15.15.2.2. By Distribution Channel

    15.16. Australia

        15.16.1. Pricing Analysis

        15.16.2. Market Share Analysis, 2023

            15.16.2.1. By Product

            15.16.2.2. By Distribution Channel

    15.17. New Zealand

        15.17.1. Pricing Analysis

        15.17.2. Market Share Analysis, 2023

            15.17.2.1. By Product

            15.17.2.2. By Distribution Channel

    15.18. China

        15.18.1. Pricing Analysis

        15.18.2. Market Share Analysis, 2023

            15.18.2.1. By Product

            15.18.2.2. By Distribution Channel

    15.19. Japan

        15.19.1. Pricing Analysis

        15.19.2. Market Share Analysis, 2023

            15.19.2.1. By Product

            15.19.2.2. By Distribution Channel

    15.20. South Korea

        15.20.1. Pricing Analysis

        15.20.2. Market Share Analysis, 2023

            15.20.2.1. By Product

            15.20.2.2. By Distribution Channel

    15.21. GCC Countries

        15.21.1. Pricing Analysis

        15.21.2. Market Share Analysis, 2023

            15.21.2.1. By Product

            15.21.2.2. By Distribution Channel

    15.22. South Africa

        15.22.1. Pricing Analysis

        15.22.2. Market Share Analysis, 2023

            15.22.2.1. By Product

            15.22.2.2. By Distribution Channel

    15.23. Israel

        15.23.1. Pricing Analysis

        15.23.2. Market Share Analysis, 2023

            15.23.2.1. By Product

            15.23.2.2. By Distribution Channel

16. Market Structure Analysis

    16.1. Competition Dashboard

    16.2. Competition Benchmarking

    16.3. Market Share Analysis of Top Players

        16.3.1. By Regional

        16.3.2. By Product

        16.3.3. By Distribution Channel

17. Competition Analysis

    17.1. Competition Deep Dive

        17.1.1. Callaway

            17.1.1.1. Overview

            17.1.1.2. Product Portfolio

            17.1.1.3. Profitability by Market Segments

            17.1.1.4. Sales Footprint

            17.1.1.5. Strategy Overview

                17.1.1.5.1. Marketing Strategy

                17.1.1.5.2. Product Strategy

                17.1.1.5.3. Channel Strategy

        17.1.2. SRI Sports Limited

            17.1.2.1. Overview

            17.1.2.2. Product Portfolio

            17.1.2.3. Profitability by Market Segments

            17.1.2.4. Sales Footprint

            17.1.2.5. Strategy Overview

                17.1.2.5.1. Marketing Strategy

                17.1.2.5.2. Product Strategy

                17.1.2.5.3. Channel Strategy

        17.1.3. Acushnet Holding Corp.

            17.1.3.1. Overview

            17.1.3.2. Product Portfolio

            17.1.3.3. Profitability by Market Segments

            17.1.3.4. Sales Footprint

            17.1.3.5. Strategy Overview

                17.1.3.5.1. Marketing Strategy

                17.1.3.5.2. Product Strategy

                17.1.3.5.3. Channel Strategy

        17.1.4. Taylormade

            17.1.4.1. Overview

            17.1.4.2. Product Portfolio

            17.1.4.3. Profitability by Market Segments

            17.1.4.4. Sales Footprint

            17.1.4.5. Strategy Overview

                17.1.4.5.1. Marketing Strategy

                17.1.4.5.2. Product Strategy

                17.1.4.5.3. Channel Strategy

        17.1.5. Titleist

            17.1.5.1. Overview

            17.1.5.2. Product Portfolio

            17.1.5.3. Profitability by Market Segments

            17.1.5.4. Sales Footprint

            17.1.5.5. Strategy Overview

                17.1.5.5.1. Marketing Strategy

                17.1.5.5.2. Product Strategy

                17.1.5.5.3. Channel Strategy

        17.1.6. Clevaland

            17.1.6.1. Overview

            17.1.6.2. Product Portfolio

            17.1.6.3. Profitability by Market Segments

            17.1.6.4. Sales Footprint

            17.1.6.5. Strategy Overview

                17.1.6.5.1. Marketing Strategy

                17.1.6.5.2. Product Strategy

                17.1.6.5.3. Channel Strategy

        17.1.7. Mizuno

            17.1.7.1. Overview

            17.1.7.2. Product Portfolio

            17.1.7.3. Profitability by Market Segments

            17.1.7.4. Sales Footprint

            17.1.7.5. Strategy Overview

                17.1.7.5.1. Marketing Strategy

                17.1.7.5.2. Product Strategy

                17.1.7.5.3. Channel Strategy

        17.1.8. Wilson Sporting Goods

            17.1.8.1. Overview

            17.1.8.2. Product Portfolio

            17.1.8.3. Profitability by Market Segments

            17.1.8.4. Sales Footprint

            17.1.8.5. Strategy Overview

                17.1.8.5.1. Marketing Strategy

                17.1.8.5.2. Product Strategy

                17.1.8.5.3. Channel Strategy

        17.1.9. Odyssey

            17.1.9.1. Overview

            17.1.9.2. Product Portfolio

            17.1.9.3. Profitability by Market Segments

            17.1.9.4. Sales Footprint

            17.1.9.5. Strategy Overview

                17.1.9.5.1. Marketing Strategy

                17.1.9.5.2. Product Strategy

                17.1.9.5.3. Channel Strategy

        17.1.10. PING

            17.1.10.1. Overview

            17.1.10.2. Product Portfolio

            17.1.10.3. Profitability by Market Segments

            17.1.10.4. Sales Footprint

            17.1.10.5. Strategy Overview

                17.1.10.5.1. Marketing Strategy

                17.1.10.5.2. Product Strategy

                17.1.10.5.3. Channel Strategy

18. Assumptions & Acronyms Used

19. Research Methodology

List of Tables

Table 1: Global Market Value (US$ Million) Forecast by Region, 2019 to 2034

Table 2: Global Market Volume (Units) Forecast by Region, 2019 to 2034

Table 3: Global Market Value (US$ Million) Forecast by Product, 2019 to 2034

Table 4: Global Market Volume (Units) Forecast by Product, 2019 to 2034

Table 5: Global Market Value (US$ Million) Forecast by Distribution Channel, 2019 to 2034

Table 6: Global Market Volume (Units) Forecast by Distribution Channel, 2019 to 2034

Table 7: North America Market Value (US$ Million) Forecast by Country, 2019 to 2034

Table 8: North America Market Volume (Units) Forecast by Country, 2019 to 2034

Table 9: North America Market Value (US$ Million) Forecast by Product, 2019 to 2034

Table 10: North America Market Volume (Units) Forecast by Product, 2019 to 2034

Table 11: North America Market Value (US$ Million) Forecast by Distribution Channel, 2019 to 2034

Table 12: North America Market Volume (Units) Forecast by Distribution Channel, 2019 to 2034

Table 13: Latin America Market Value (US$ Million) Forecast by Country, 2019 to 2034

Table 14: Latin America Market Volume (Units) Forecast by Country, 2019 to 2034

Table 15: Latin America Market Value (US$ Million) Forecast by Product, 2019 to 2034

Table 16: Latin America Market Volume (Units) Forecast by Product, 2019 to 2034

Table 17: Latin America Market Value (US$ Million) Forecast by Distribution Channel, 2019 to 2034

Table 18: Latin America Market Volume (Units) Forecast by Distribution Channel, 2019 to 2034

Table 19: Western Europe Market Value (US$ Million) Forecast by Country, 2019 to 2034

Table 20: Western Europe Market Volume (Units) Forecast by Country, 2019 to 2034

Table 21: Western Europe Market Value (US$ Million) Forecast by Product, 2019 to 2034

Table 22: Western Europe Market Volume (Units) Forecast by Product, 2019 to 2034

Table 23: Western Europe Market Value (US$ Million) Forecast by Distribution Channel, 2019 to 2034

Table 24: Western Europe Market Volume (Units) Forecast by Distribution Channel, 2019 to 2034

Table 25: Eastern Europe Market Value (US$ Million) Forecast by Country, 2019 to 2034

Table 26: Eastern Europe Market Volume (Units) Forecast by Country, 2019 to 2034

Table 27: Eastern Europe Market Value (US$ Million) Forecast by Product, 2019 to 2034

Table 28: Eastern Europe Market Volume (Units) Forecast by Product, 2019 to 2034

Table 29: Eastern Europe Market Value (US$ Million) Forecast by Distribution Channel, 2019 to 2034

Table 30: Eastern Europe Market Volume (Units) Forecast by Distribution Channel, 2019 to 2034

Table 31: South Asia and Pacific Market Value (US$ Million) Forecast by Country, 2019 to 2034

Table 32: South Asia and Pacific Market Volume (Units) Forecast by Country, 2019 to 2034

Table 33: South Asia and Pacific Market Value (US$ Million) Forecast by Product, 2019 to 2034

Table 34: South Asia and Pacific Market Volume (Units) Forecast by Product, 2019 to 2034

Table 35: South Asia and Pacific Market Value (US$ Million) Forecast by Distribution Channel, 2019 to 2034

Table 36: South Asia and Pacific Market Volume (Units) Forecast by Distribution Channel, 2019 to 2034

Table 37: East Asia Market Value (US$ Million) Forecast by Country, 2019 to 2034

Table 38: East Asia Market Volume (Units) Forecast by Country, 2019 to 2034

Table 39: East Asia Market Value (US$ Million) Forecast by Product, 2019 to 2034

Table 40: East Asia Market Volume (Units) Forecast by Product, 2019 to 2034

Table 41: East Asia Market Value (US$ Million) Forecast by Distribution Channel, 2019 to 2034

Table 42: East Asia Market Volume (Units) Forecast by Distribution Channel, 2019 to 2034

Table 43: Middle East and Africa Market Value (US$ Million) Forecast by Country, 2019 to 2034

Table 44: Middle East and Africa Market Volume (Units) Forecast by Country, 2019 to 2034

Table 45: Middle East and Africa Market Value (US$ Million) Forecast by Product, 2019 to 2034

Table 46: Middle East and Africa Market Volume (Units) Forecast by Product, 2019 to 2034

Table 47: Middle East and Africa Market Value (US$ Million) Forecast by Distribution Channel, 2019 to 2034

Table 48: Middle East and Africa Market Volume (Units) Forecast by Distribution Channel, 2019 to 2034

List of Charts

Figure 1: Global Market Value (US$ Million) by Product, 2024 to 2034

Figure 2: Global Market Value (US$ Million) by Distribution Channel, 2024 to 2034

Figure 3: Global Market Value (US$ Million) by Region, 2024 to 2034

Figure 4: Global Market Value (US$ Million) Analysis by Region, 2019 to 2034

Figure 5: Global Market Volume (Units) Analysis by Region, 2019 to 2034

Figure 6: Global Market Value Share (%) and BPS Analysis by Region, 2024 to 2034

Figure 7: Global Market Y-o-Y Growth (%) Projections by Region, 2024 to 2034

Figure 8: Global Market Value (US$ Million) Analysis by Product, 2019 to 2034

Figure 9: Global Market Volume (Units) Analysis by Product, 2019 to 2034

Figure 10: Global Market Value Share (%) and BPS Analysis by Product, 2024 to 2034

Figure 11: Global Market Y-o-Y Growth (%) Projections by Product, 2024 to 2034

Figure 12: Global Market Value (US$ Million) Analysis by Distribution Channel, 2019 to 2034

Figure 13: Global Market Volume (Units) Analysis by Distribution Channel, 2019 to 2034

Figure 14: Global Market Value Share (%) and BPS Analysis by Distribution Channel, 2024 to 2034

Figure 15: Global Market Y-o-Y Growth (%) Projections by Distribution Channel, 2024 to 2034

Figure 16: Global Market Attractiveness by Product, 2024 to 2034

Figure 17: Global Market Attractiveness by Distribution Channel, 2024 to 2034

Figure 18: Global Market Attractiveness by Region, 2024 to 2034

Figure 19: North America Market Value (US$ Million) by Product, 2024 to 2034

Figure 20: North America Market Value (US$ Million) by Distribution Channel, 2024 to 2034

Figure 21: North America Market Value (US$ Million) by Country, 2024 to 2034

Figure 22: North America Market Value (US$ Million) Analysis by Country, 2019 to 2034

Figure 23: North America Market Volume (Units) Analysis by Country, 2019 to 2034

Figure 24: North America Market Value Share (%) and BPS Analysis by Country, 2024 to 2034

Figure 25: North America Market Y-o-Y Growth (%) Projections by Country, 2024 to 2034

Figure 26: North America Market Value (US$ Million) Analysis by Product, 2019 to 2034

Figure 27: North America Market Volume (Units) Analysis by Product, 2019 to 2034

Figure 28: North America Market Value Share (%) and BPS Analysis by Product, 2024 to 2034

Figure 29: North America Market Y-o-Y Growth (%) Projections by Product, 2024 to 2034

Figure 30: North America Market Value (US$ Million) Analysis by Distribution Channel, 2019 to 2034

Figure 31: North America Market Volume (Units) Analysis by Distribution Channel, 2019 to 2034

Figure 32: North America Market Value Share (%) and BPS Analysis by Distribution Channel, 2024 to 2034

Figure 33: North America Market Y-o-Y Growth (%) Projections by Distribution Channel, 2024 to 2034

Figure 34: North America Market Attractiveness by Product, 2024 to 2034

Figure 35: North America Market Attractiveness by Distribution Channel, 2024 to 2034

Figure 36: North America Market Attractiveness by Country, 2024 to 2034

Figure 37: Latin America Market Value (US$ Million) by Product, 2024 to 2034

Figure 38: Latin America Market Value (US$ Million) by Distribution Channel, 2024 to 2034

Figure 39: Latin America Market Value (US$ Million) by Country, 2024 to 2034

Figure 40: Latin America Market Value (US$ Million) Analysis by Country, 2019 to 2034

Figure 41: Latin America Market Volume (Units) Analysis by Country, 2019 to 2034

Figure 42: Latin America Market Value Share (%) and BPS Analysis by Country, 2024 to 2034

Figure 43: Latin America Market Y-o-Y Growth (%) Projections by Country, 2024 to 2034

Figure 44: Latin America Market Value (US$ Million) Analysis by Product, 2019 to 2034

Figure 45: Latin America Market Volume (Units) Analysis by Product, 2019 to 2034

Figure 46: Latin America Market Value Share (%) and BPS Analysis by Product, 2024 to 2034

Figure 47: Latin America Market Y-o-Y Growth (%) Projections by Product, 2024 to 2034

Figure 48: Latin America Market Value (US$ Million) Analysis by Distribution Channel, 2019 to 2034

Figure 49: Latin America Market Volume (Units) Analysis by Distribution Channel, 2019 to 2034

Figure 50: Latin America Market Value Share (%) and BPS Analysis by Distribution Channel, 2024 to 2034

Figure 51: Latin America Market Y-o-Y Growth (%) Projections by Distribution Channel, 2024 to 2034

Figure 52: Latin America Market Attractiveness by Product, 2024 to 2034

Figure 53: Latin America Market Attractiveness by Distribution Channel, 2024 to 2034

Figure 54: Latin America Market Attractiveness by Country, 2024 to 2034

Figure 55: Western Europe Market Value (US$ Million) by Product, 2024 to 2034

Figure 56: Western Europe Market Value (US$ Million) by Distribution Channel, 2024 to 2034

Figure 57: Western Europe Market Value (US$ Million) by Country, 2024 to 2034

Figure 58: Western Europe Market Value (US$ Million) Analysis by Country, 2019 to 2034

Figure 59: Western Europe Market Volume (Units) Analysis by Country, 2019 to 2034

Figure 60: Western Europe Market Value Share (%) and BPS Analysis by Country, 2024 to 2034

Figure 61: Western Europe Market Y-o-Y Growth (%) Projections by Country, 2024 to 2034

Figure 62: Western Europe Market Value (US$ Million) Analysis by Product, 2019 to 2034

Figure 63: Western Europe Market Volume (Units) Analysis by Product, 2019 to 2034

Figure 64: Western Europe Market Value Share (%) and BPS Analysis by Product, 2024 to 2034

Figure 65: Western Europe Market Y-o-Y Growth (%) Projections by Product, 2024 to 2034

Figure 66: Western Europe Market Value (US$ Million) Analysis by Distribution Channel, 2019 to 2034

Figure 67: Western Europe Market Volume (Units) Analysis by Distribution Channel, 2019 to 2034

Figure 68: Western Europe Market Value Share (%) and BPS Analysis by Distribution Channel, 2024 to 2034

Figure 69: Western Europe Market Y-o-Y Growth (%) Projections by Distribution Channel, 2024 to 2034

Figure 70: Western Europe Market Attractiveness by Product, 2024 to 2034

Figure 71: Western Europe Market Attractiveness by Distribution Channel, 2024 to 2034

Figure 72: Western Europe Market Attractiveness by Country, 2024 to 2034

Figure 73: Eastern Europe Market Value (US$ Million) by Product, 2024 to 2034

Figure 74: Eastern Europe Market Value (US$ Million) by Distribution Channel, 2024 to 2034

Figure 75: Eastern Europe Market Value (US$ Million) by Country, 2024 to 2034

Figure 76: Eastern Europe Market Value (US$ Million) Analysis by Country, 2019 to 2034

Figure 77: Eastern Europe Market Volume (Units) Analysis by Country, 2019 to 2034

Figure 78: Eastern Europe Market Value Share (%) and BPS Analysis by Country, 2024 to 2034

Figure 79: Eastern Europe Market Y-o-Y Growth (%) Projections by Country, 2024 to 2034

Figure 80: Eastern Europe Market Value (US$ Million) Analysis by Product, 2019 to 2034

Figure 81: Eastern Europe Market Volume (Units) Analysis by Product, 2019 to 2034

Figure 82: Eastern Europe Market Value Share (%) and BPS Analysis by Product, 2024 to 2034

Figure 83: Eastern Europe Market Y-o-Y Growth (%) Projections by Product, 2024 to 2034

Figure 84: Eastern Europe Market Value (US$ Million) Analysis by Distribution Channel, 2019 to 2034

Figure 85: Eastern Europe Market Volume (Units) Analysis by Distribution Channel, 2019 to 2034

Figure 86: Eastern Europe Market Value Share (%) and BPS Analysis by Distribution Channel, 2024 to 2034

Figure 87: Eastern Europe Market Y-o-Y Growth (%) Projections by Distribution Channel, 2024 to 2034

Figure 88: Eastern Europe Market Attractiveness by Product, 2024 to 2034

Figure 89: Eastern Europe Market Attractiveness by Distribution Channel, 2024 to 2034

Figure 90: Eastern Europe Market Attractiveness by Country, 2024 to 2034

Figure 91: South Asia and Pacific Market Value (US$ Million) by Product, 2024 to 2034

Figure 92: South Asia and Pacific Market Value (US$ Million) by Distribution Channel, 2024 to 2034

Figure 93: South Asia and Pacific Market Value (US$ Million) by Country, 2024 to 2034

Figure 94: South Asia and Pacific Market Value (US$ Million) Analysis by Country, 2019 to 2034

Figure 95: South Asia and Pacific Market Volume (Units) Analysis by Country, 2019 to 2034

Figure 96: South Asia and Pacific Market Value Share (%) and BPS Analysis by Country, 2024 to 2034

Figure 97: South Asia and Pacific Market Y-o-Y Growth (%) Projections by Country, 2024 to 2034

Figure 98: South Asia and Pacific Market Value (US$ Million) Analysis by Product, 2019 to 2034

Figure 99: South Asia and Pacific Market Volume (Units) Analysis by Product, 2019 to 2034

Figure 100: South Asia and Pacific Market Value Share (%) and BPS Analysis by Product, 2024 to 2034

Figure 101: South Asia and Pacific Market Y-o-Y Growth (%) Projections by Product, 2024 to 2034

Figure 102: South Asia and Pacific Market Value (US$ Million) Analysis by Distribution Channel, 2019 to 2034

Figure 103: South Asia and Pacific Market Volume (Units) Analysis by Distribution Channel, 2019 to 2034

Figure 104: South Asia and Pacific Market Value Share (%) and BPS Analysis by Distribution Channel, 2024 to 2034

Figure 105: South Asia and Pacific Market Y-o-Y Growth (%) Projections by Distribution Channel, 2024 to 2034

Figure 106: South Asia and Pacific Market Attractiveness by Product, 2024 to 2034

Figure 107: South Asia and Pacific Market Attractiveness by Distribution Channel, 2024 to 2034

Figure 108: South Asia and Pacific Market Attractiveness by Country, 2024 to 2034

Figure 109: East Asia Market Value (US$ Million) by Product, 2024 to 2034

Figure 110: East Asia Market Value (US$ Million) by Distribution Channel, 2024 to 2034

Figure 111: East Asia Market Value (US$ Million) by Country, 2024 to 2034

Figure 112: East Asia Market Value (US$ Million) Analysis by Country, 2019 to 2034

Figure 113: East Asia Market Volume (Units) Analysis by Country, 2019 to 2034

Figure 114: East Asia Market Value Share (%) and BPS Analysis by Country, 2024 to 2034

Figure 115: East Asia Market Y-o-Y Growth (%) Projections by Country, 2024 to 2034

Figure 116: East Asia Market Value (US$ Million) Analysis by Product, 2019 to 2034

Figure 117: East Asia Market Volume (Units) Analysis by Product, 2019 to 2034

Figure 118: East Asia Market Value Share (%) and BPS Analysis by Product, 2024 to 2034

Figure 119: East Asia Market Y-o-Y Growth (%) Projections by Product, 2024 to 2034

Figure 120: East Asia Market Value (US$ Million) Analysis by Distribution Channel, 2019 to 2034

Figure 121: East Asia Market Volume (Units) Analysis by Distribution Channel, 2019 to 2034

Figure 122: East Asia Market Value Share (%) and BPS Analysis by Distribution Channel, 2024 to 2034

Figure 123: East Asia Market Y-o-Y Growth (%) Projections by Distribution Channel, 2024 to 2034

Figure 124: East Asia Market Attractiveness by Product, 2024 to 2034

Figure 125: East Asia Market Attractiveness by Distribution Channel, 2024 to 2034

Figure 126: East Asia Market Attractiveness by Country, 2024 to 2034

Figure 127: Middle East and Africa Market Value (US$ Million) by Product, 2024 to 2034

Figure 128: Middle East and Africa Market Value (US$ Million) by Distribution Channel, 2024 to 2034

Figure 129: Middle East and Africa Market Value (US$ Million) by Country, 2024 to 2034

Figure 130: Middle East and Africa Market Value (US$ Million) Analysis by Country, 2019 to 2034

Figure 131: Middle East and Africa Market Volume (Units) Analysis by Country, 2019 to 2034

Figure 132: Middle East and Africa Market Value Share (%) and BPS Analysis by Country, 2024 to 2034

Figure 133: Middle East and Africa Market Y-o-Y Growth (%) Projections by Country, 2024 to 2034

Figure 134: Middle East and Africa Market Value (US$ Million) Analysis by Product, 2019 to 2034

Figure 135: Middle East and Africa Market Volume (Units) Analysis by Product, 2019 to 2034

Figure 136: Middle East and Africa Market Value Share (%) and BPS Analysis by Product, 2024 to 2034

Figure 137: Middle East and Africa Market Y-o-Y Growth (%) Projections by Product, 2024 to 2034

Figure 138: Middle East and Africa Market Value (US$ Million) Analysis by Distribution Channel, 2019 to 2034

Figure 139: Middle East and Africa Market Volume (Units) Analysis by Distribution Channel, 2019 to 2034

Figure 140: Middle East and Africa Market Value Share (%) and BPS Analysis by Distribution Channel, 2024 to 2034

Figure 141: Middle East and Africa Market Y-o-Y Growth (%) Projections by Distribution Channel, 2024 to 2034

Figure 142: Middle East and Africa Market Attractiveness by Product, 2024 to 2034

Figure 143: Middle East and Africa Market Attractiveness by Distribution Channel, 2024 to 2034

Figure 144: Middle East and Africa Market Attractiveness by Country, 2024 to 2034

Recommendations

Consumer Product

Golf Training Aids Market

Published : December 2023

Consumer Product

Golf Outfit Market

Published : November 2023

Explore Consumer Product Insights

View Reports