Golf Cart Battery Market Size and Share Forecast Outlook 2025 to 2035

The Golf Cart Battery Market is estimated to be valued at USD 158.0 million in 2025 and is projected to reach USD 267.3 million by 2035, registering a compound annual growth rate (CAGR) of 5.4% over the forecast period.
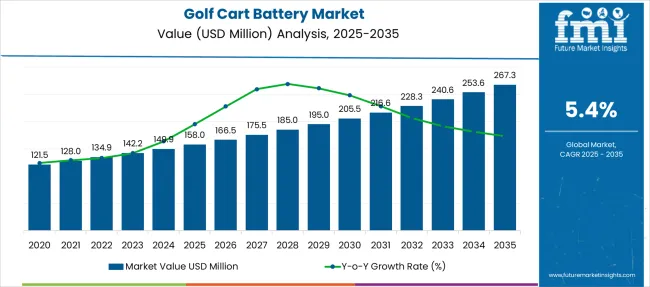
Quick Stats for Golf Cart Battery Market

  • Golf Cart Battery Market Value (2025): USD 158.0 million
  • Golf Cart Battery Market Forecast Value (2035): USD 267.3 million
  • Golf Cart Battery Market Forecast CAGR: 5.4%
  • Leading Segment in Golf Cart Battery Market in 2025: Lead-acid (57.2%)
  • Key Growth Regions in Golf Cart Battery Market: North America, Asia-Pacific, Europe
  • Top Key Players in Golf Cart Battery Market: Clarios, CloudEnergy, Continental Battery Systems, Crown Battery Manufacturing, Duracell, East Penn Manufacturing, EnerSys, Exide Technologies, Fullriver Battery USA, Interstate Batteries, Leoch International Technology, Lifeline Batteries, Power Sonic Corporation, RELiON Batteries, Trojan Battery Company

Golf Cart Battery Market Market Value Analysis

Golf Cart Battery Market Key Takeaways

Metric Value
Golf Cart Battery Market Estimated Value in (2025 E) USD 158.0 million
Golf Cart Battery Market Forecast Value in (2035 F) USD 267.3 million
Forecast CAGR (2025 to 2035) 5.4%

Why is the Golf Cart Battery Market Growing?

The golf cart battery market is expanding steadily, supported by the growing adoption of electric golf carts across golf courses, residential communities, and commercial complexes. As sustainability becomes a key purchasing driver, electric carts powered by rechargeable batteries are replacing traditional fuel-based vehicles.

This transition is driven by increasing awareness around carbon emissions, operational cost benefits, and regulatory pressure favoring green transportation alternatives. Ongoing improvements in battery efficiency, charge capacity, and lifecycle are also encouraging upgrades from existing users.

While the market remains cost-sensitive, demand for reliable and low-maintenance battery systems is driving innovation and preference for established chemistries. The future outlook remains positive as modernization of golf courses and the rising popularity of golf tourism contribute to fleet expansion. Additionally, the diversification of golf carts for use in resorts, airports, and gated communities is expected to sustain long-term battery demand across multiple voltage platforms.

Segmental Analysis

The golf cart battery market is segmented by battery type, voltage, end user, and sales channel and geographic regions. By battery type of the golf cart battery market is divided into Lead-acid and Lithium-ion. In terms of voltage of the golf cart battery market is classified into 6V, 8V, 12V, and Others. Based on end user of the golf cart battery market is segmented into Golf courses and Commercial services. By sales channel of the golf cart battery market is segmented into Original Equipment Manufacturer (OEM) and Aftermarket. Regionally, the golf cart battery industry is classified into North America, Latin America, Western Europe, Eastern Europe, Balkan & Baltic Countries, Russia & Belarus, Central Asia, East Asia, South Asia & Pacific, and the Middle East & Africa.
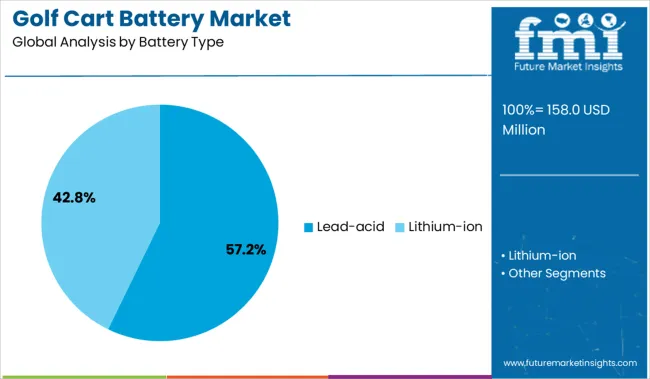
Insights into the Lead-acid Battery Segment

Golf Cart Battery Market Analysis By Battery Type

The lead-acid battery segment dominates the battery type category with a 57.2% market share, owing to its cost-effectiveness, widespread availability, and ease of maintenance. These batteries are preferred by golf course operators and fleet managers for their dependable performance in short-distance, low-speed environments typical of golf cart usage.

Despite increasing competition from lithium-ion alternatives, lead-acid technology continues to hold market leadership due to its established supply chains and comparatively lower upfront investment. Technological enhancements such as deep-cycle variants and sealed AGM formats have improved durability and efficiency, reinforcing their value proposition.

The segment benefits from repeat purchase behavior due to limited battery lifespan, which ensures consistent aftermarket demand. As pricing remains a critical factor in battery selection, especially for bulk purchases by golf facilities, lead-acid is projected to remain the dominant choice across developing and cost-sensitive markets.
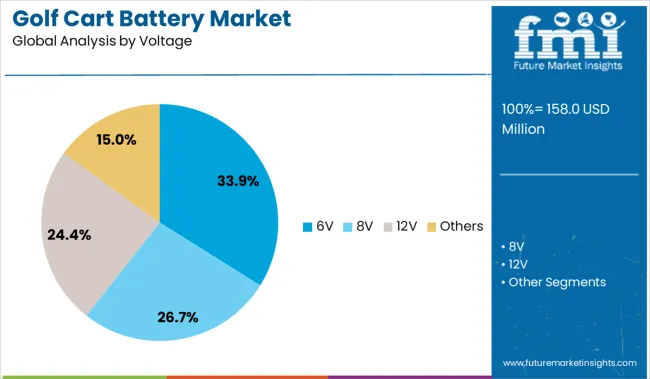
Insights into the 6V Voltage Segment

Golf Cart Battery Market Analysis By Voltage

The 6V battery segment accounts for 33.9% of the market by voltage, favored for its balanced output and long cycle life suited for standard golf cart configurations. These batteries are often used in series to match specific voltage and power requirements, allowing operators flexibility in designing energy-efficient systems.

Their widespread use is attributed to a favorable combination of load capacity, affordability, and compatibility with existing golf cart models. Demand for 6V systems continues to remain stable across mid-tier golf courses and utility cart applications, where performance consistency and battery replacement costs are key considerations.

Manufacturers have focused on enhancing the energy density and maintenance ease of 6V batteries to extend runtime and reduce operational downtime. As the golf industry gradually electrifies its fleets, 6V solutions are expected to retain a notable market share, particularly in regions where budget constraints favor conventional systems over high-voltage alternatives.
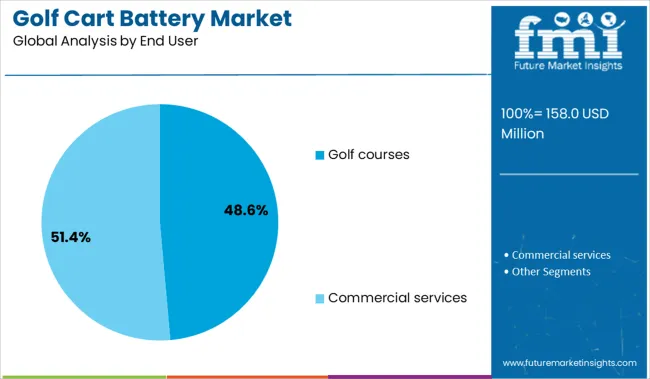
Insights into the Golf Courses End User Segment

Golf Cart Battery Market Analysis By End User

Golf courses represent the largest end-user segment with a 48.6% share, driven by their extensive reliance on electric carts for daily operations and player mobility. These facilities typically manage large fleets and require batteries that offer durability, minimal downtime, and cost-effective performance over repeated charge-discharge cycles.

Battery procurement at golf courses is often governed by operational efficiency and maintenance budgets, which favor reliable and proven battery chemistries. The growth of this segment is further bolstered by renovations of existing clubs and the construction of new golf resorts, particularly in tourism-driven economies.

Additionally, sustainability goals among course operators are encouraging the transition from gas-powered to battery-operated carts, further solidifying demand. As courses expand their fleets and extend operating hours, consistent battery replacement cycles are expected to keep this segment at the forefront of market growth.

What are the Drivers, Restrain, and Key Trends of the Golf Cart Battery Market?

Energy storage solutions for golf carts are shifting toward lithium-ion formats to support higher performance, longer runtime, and reduced maintenance. In 2024, lithium batteries accounted for 28 % of new cart installs, especially in resort and rental fleets. Demand is rising in regions deploying electric vehicles for gated communities and commercial venues.

Performance Gains & Lifecycle Cost Efficiency

Fleet operators are upgrading to lithium-ion battery systems to extend cart runtime and reduce service cycles. Real-world data shows performance improvement—providing up to 22 % longer operation per charge compared to lead-acid options. Maintenance intervals have increased as replacement frequency dropped by 35 %, thanks to better depth-of-discharge profiles and enhanced thermal management. Charging time has also shortened—lithium carts recharge in about 6–8 hours versus 10–12 hours for conventional batteries. High-temperature variants maintain capacity above 90 % even in hot-weather zones, helping resort cart fleets remain operational through extended summers. These improvements deliver total cost reductions over equipment lifespan and encourage operators to convert entire fleets.

Supply Cost, Support Network Gaps & Retrofit Complexity

Despite benefits, adoption faces barriers due to battery cost, infrastructure demands, and service readiness. Lithium-ion systems carry a 15–18 % capital premium over lead-acid carts, raising upfront procurement momentum threshold. Charging station installation adds complexity—upgrades to cart barns may require 208 V three-phase wiring, increasing setup lead times by 4–6 days. Where local support for OEM lithium systems is weak, downtime for battery diagnostics or controller resets can stretch over 7–9 days, reducing fleet availability. Retrofit units sometimes face compatibility issues with existing charger models and BMS protocols. These constraints hinder conversion in smaller clubs or cost-sensitive operators, even as total lifetime benefits grow clearer.
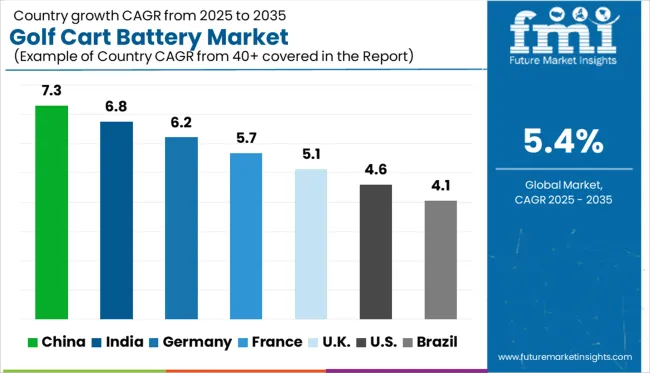
Analysis of Golf Cart Battery Market By Key Countries

Golf Cart Battery Market Cagr Analysis By Country

Country CAGR
China 7.3%
India 6.8%
Germany 6.2%
France 5.7%
UK 5.1%
USA 4.6%
Brazil 4.1%

The global golf cart battery market is expected to grow at a 5.4% CAGR from 2025 to 2035. China registers the highest growth at 7.3%, marking a +35% premium over the global average, driven by domestic golf course expansion and battery manufacturing scale. India follows with 6.8% (+26%) due to rising adoption in leisure and hospitality sectors. Germany posts 6.2% (+15%), reflecting use in gated communities and airports. Growth in the United Kingdom stands at 5.1% (–6%), while the United States, at 4.6%, trails the global average by –15% due to market saturation and longer replacement cycles. The report covers detailed analysis of 40+ countries, with the top five countries shared as a reference.

Market Expansion Outlook for Golf Cart Batteries in China

China’s golf cart battery market is growing at a 7.3% CAGR, faster than the global average. Development of electric transport in tourism zones is expanding battery demand, particularly in Hainan, Yunnan, and Zhejiang. LFP batteries are preferred for their longevity in continuous fleet operations. OEMs in Guangdong and Jiangsu are increasing local procurement for core battery components. Electronics firms are working with vehicle manufacturers on diagnostics and regenerative charge support for high-usage carts.

  • 34,200 LFP battery packs delivered to resort cart manufacturers in 2024
  • 17 tourism parks across Hainan transitioned fleets to lithium battery units
  • 22% YoY increase in golf carts with telematics-integrated battery modules

Demand Forecast for Golf Cart Batteries in India

India’s golf cart battery market is projected to grow at 6.8% CAGR. Demand originates from institutional and industrial sites in Karnataka and Telangana. Cart procurement for gated communities in Maharashtra and Gujarat is expanding. Hybrid lithium-lead configurations are used to balance cost and performance. Battery swapping is being piloted to address fleet uptime. Domestic manufacturers are focusing on 48V formats suited to India’s climate, with sourcing now shifting to local Tier 1 suppliers.
  • 9,600 battery modules supplied to academic and institutional cart fleets in FY 2024
  • 15 residential townships adopted lithium-hybrid carts with swap-ready systems
  • 37% of cart OEMs sourced battery components from local Tier 1 suppliers

Battery Trends in Germany’s Golf Cart Market

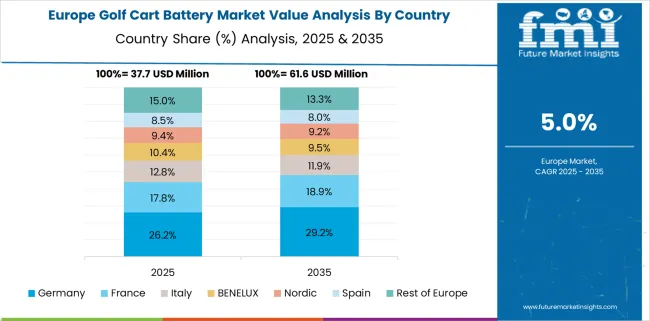
Golf Cart Battery Market Europe Country Market Share Analysis, 2025 & 2035

Germany’s market is expanding at a 6.2% CAGR. Golf resorts and science parks are adopting faster-charging batteries to support daily usage. LFP systems are selected for stable operation and thermal safety. Resorts in Bavaria and Baden-Württemberg are adding solar-linked charging bays. Battery integrators are focusing on compliance with EU standards and compatibility with imported carts. Fleet operators are increasingly seeking BMS support for diagnostics and service planning.

  • 6,800 solar-compatible cart batteries sold to German golf resorts in 2024
  • 29% of fleet carts across tech campuses integrated with BMS diagnostics
  • 1,340 battery units passed EU Class II certifications for safe cart usage

Golf Cart Battery Adoption Trends in the United Kingdom

The UK market is growing at 5.1% CAGR, led by demand from courses, campuses, and tourism locations. Fleets are shifting from lead-acid to gel or lithium batteries due to maintenance and reliability factors. Northern England and Scottish facilities are piloting battery monitors to reduce charge errors and field failures. Retrofit kits are being offered by battery suppliers to help operators meet regulatory preferences for electric vehicles on public-access land.
  • 4,300 retrofit battery kits installed in heritage tourism and course fleets in 2024
  • 760 gel-based battery units deployed for high-frequency use carts
  • 18 campuses adopted telemetry-enabled charge monitoring on cart batteries

Golf Cart Battery Market Landscape in the United States

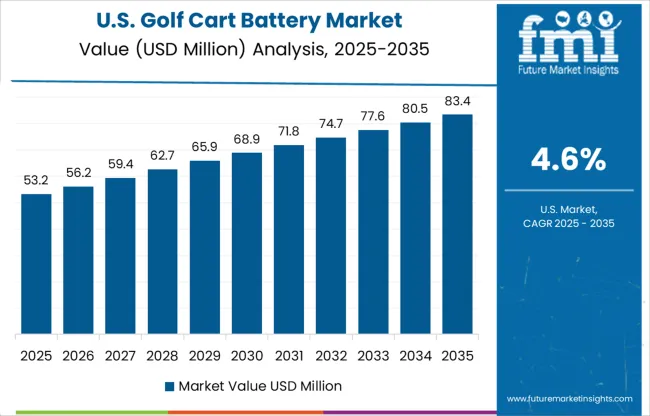
Golf Cart Battery Market Country Value Analysis

The US market is expected to grow at 4.6% CAGR, slower than global pace. Florida and Arizona dominate usage, especially in residential and resort environments. Flooded lead-acid remains common, though lithium is expanding among commercial users. South Carolina and Georgia-based OEMs are offering BMS-equipped battery systems from factory lines. Service firms are expanding battery maintenance coverage to support seasonal operations and reduce downtime during peak use months.
  • 12,700 carts sold with lithium systems in Florida and Arizona in 2024
  • 3,100 flooded battery replacements recorded in seasonal cart fleets
  • 16 golf cart brands now offer factory-installed BMS across USA models

Competitive Landscape of Golf Cart Battery Market

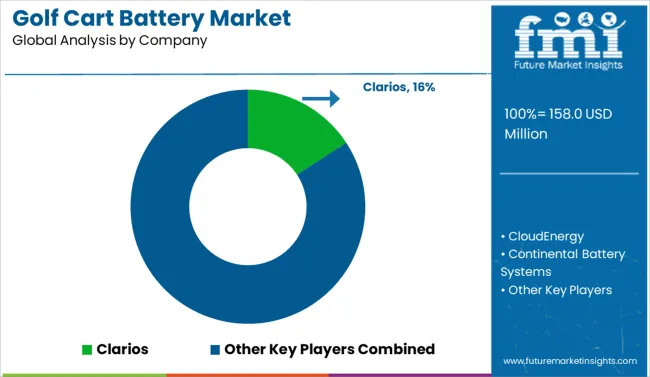
Golf Cart Battery Market Analysis By Company

The golf cart battery market is moderately consolidated, with Clarios holding a significant market share, closely followed by established players like East Penn Manufacturing, EnerSys, and Trojan Battery Company, which specialize in durable deep-cycle lead-acid and advanced lithium-ion solutions. Traditional brands such as Exide Technologies and Interstate Batteries maintain strong footholds in the replacement segment, while innovators like RELiON Batteries and Power Sonic Corporation accelerate the shift toward lithium technologies with lightweight, fast-charging alternatives. The industry is transitioning from flooded lead-acid to AGM and lithium batteries, driven by demands for longer lifespan, reduced maintenance, and higher energy density. Manufacturers are focusing on smart battery management systems and sustainable recycling programs to meet the needs of golf courses, resorts, and utility vehicle operators. Emerging trends include Bluetooth-enabled monitoring and predictive charging for fleet optimization.

Scope of the Report

Item Value
Quantitative Units USD 158.0 Million
Battery Type Lead-acid and Lithium-ion
Voltage 6V, 8V, 12V, and Others
End User Golf courses and Commercial services
Sales Channel Original Equipment Manufacturer (OEM) and Aftermarket
Regions Covered North America, Europe, Asia-Pacific, Latin America, Middle East & Africa
Country Covered United States, Canada, Germany, France, United Kingdom, China, Japan, India, Brazil, South Africa
Key Companies Profiled Clarios, CloudEnergy, Continental Battery Systems, Crown Battery Manufacturing, Duracell, East Penn Manufacturing, EnerSys, Exide Technologies, Fullriver Battery USA, Interstate Batteries, Leoch International Technology, Lifeline Batteries, Power Sonic Corporation, RELiON Batteries, and Trojan Battery Company
Additional Attributes Dollar sales by battery chemistry and cart type, growing demand in lithium-ion systems for resort and commercial fleets, stable usage of lead-acid units in private and recreational courses, innovations in fast-charging technologies and battery management systems improve cycle life and vehicle uptime

Golf Cart Battery Market by Segments

Battery Type:

  • Lead-acid
  • Lithium-ion

Voltage:

  • 6V
  • 8V
  • 12V
  • Others

End User:

  • Golf courses
  • Commercial services

Sales Channel:

  • Original Equipment Manufacturer (OEM)
  • Aftermarket

Region:

  • North America
    • USA
    • Canada
    • Mexico
  • Latin America
    • Brazil
    • Chile
    • Rest of Latin America
  • Western Europe
    • Germany
    • UK
    • Italy
    • Spain
    • France
    • Nordic
    • BENELUX
    • Rest of Western Europe
  • Eastern Europe
    • Russia
    • Poland
    • Hungary
    • Balkan & Baltic
    • Rest of Eastern Europe
  • East Asia
    • China
    • Japan
    • South Korea
  • South Asia and Pacific
    • India
    • ASEAN
    • Australia & New Zealand
    • Rest of South Asia and Pacific
  • Middle East & Africa
    • Kingdom of Saudi Arabia
    • Other GCC Countries
    • Turkiye
    • South Africa
    • Other African Union
    • Rest of Middle East & Africa

Table of Content

  1. Executive Summary
    • Global Market Outlook
    • Demand-side Trends
    • Supply-side Trends
    • Technology Roadmap Analysis
    • Analysis and Recommendations
  2. Market Overview
    • Market Coverage / Taxonomy
    • Market Definition / Scope / Limitations
  3. Market Background
    • Market Dynamics
      • Drivers
      • Restraints
      • Opportunity
      • Trends
    • Scenario Forecast
      • Demand in Optimistic Scenario
      • Demand in Likely Scenario
      • Demand in Conservative Scenario
    • Opportunity Map Analysis
    • Product Life Cycle Analysis
    • Supply Chain Analysis
    • Investment Feasibility Matrix
    • Value Chain Analysis
    • PESTLE and Porter’s Analysis
    • Regulatory Landscape
    • Regional Parent Market Outlook
    • Production and Consumption Statistics
    • Import and Export Statistics
  4. Global Satellite As A Service Market Analysis 2020-2024 and Forecast, 2025-2035
    • Historical Market Size Value (US$ Mn) Analysis, 2020-2024
    • Current and Future Market Size Value (US$ Mn) Projections, 2025-2035
      • Y-o-Y Growth Trend Analysis
      • Absolute $ Opportunity Analysis
  5. Global Satellite As A Service Market Pricing Analysis 2020-2024 and Forecast 2025-2035
  6. Global Satellite As A Service Market Analysis 2020-2024 and Forecast 2025-2035, By Services
    • Introduction / Key Findings
    • Historical Market Size Value (US$ Mn) Analysis By Services , 2020-2024
    • Current and Future Market Size Value (US$ Mn) Analysis and Forecast By Services , 2025-2035
      • Satellite launch
      • Payload design & integration
      • Ground station management
      • Data processing & management
      • Satellite operations management
    • Y-o-Y Growth Trend Analysis By Services , 2020-2024
    • Absolute $ Opportunity Analysis By Services , 2025-2035
  7. Global Satellite As A Service Market Analysis 2020-2024 and Forecast 2025-2035, By Application
    • Introduction / Key Findings
    • Historical Market Size Value (US$ Mn) Analysis By Application, 2020-2024
    • Current and Future Market Size Value (US$ Mn) Analysis and Forecast By Application, 2025-2035
      • Satellite IoT
      • Earth observation
      • Ship tracking
      • Air traffic monitoring
      • Weather forecasting
      • Others
    • Y-o-Y Growth Trend Analysis By Application, 2020-2024
    • Absolute $ Opportunity Analysis By Application, 2025-2035
  8. Global Satellite As A Service Market Analysis 2020-2024 and Forecast 2025-2035, By End-user
    • Introduction / Key Findings
    • Historical Market Size Value (US$ Mn) Analysis By End-user, 2020-2024
    • Current and Future Market Size Value (US$ Mn) Analysis and Forecast By End-user, 2025-2035
      • Government & defense
      • Commercial
      • Academics
    • Y-o-Y Growth Trend Analysis By End-user, 2020-2024
    • Absolute $ Opportunity Analysis By End-user, 2025-2035
  9. Global Satellite As A Service Market Analysis 2020-2024 and Forecast 2025-2035, By Region
    • Introduction
    • Historical Market Size Value (US$ Mn) Analysis By Region, 2020-2024
    • Current Market Size Value (US$ Mn) Analysis and Forecast By Region, 2025-2035
      • North America
      • Latin America
      • Western Europe
      • Eastern Europe
      • East Asia
      • South Asia and Pacific
      • Middle East & Africa
    • Market Attractiveness Analysis By Region
  10. North America Satellite As A Service Market Analysis 2020-2024 and Forecast 2025-2035, By Country
    • Historical Market Size Value (US$ Mn) Trend Analysis By Market Taxonomy, 2020-2024
    • Market Size Value (US$ Mn) Forecast By Market Taxonomy, 2025-2035
      • By Country
        • USA
        • Canada
        • Mexico
      • By Services
      • By Application
      • By End-user
    • Market Attractiveness Analysis
      • By Country
      • By Services
      • By Application
      • By End-user
    • Key Takeaways
  11. Latin America Satellite As A Service Market Analysis 2020-2024 and Forecast 2025-2035, By Country
    • Historical Market Size Value (US$ Mn) Trend Analysis By Market Taxonomy, 2020-2024
    • Market Size Value (US$ Mn) Forecast By Market Taxonomy, 2025-2035
      • By Country
        • Brazil
        • Chile
        • Rest of Latin America
      • By Services
      • By Application
      • By End-user
    • Market Attractiveness Analysis
      • By Country
      • By Services
      • By Application
      • By End-user
    • Key Takeaways
  12. Western Europe Satellite As A Service Market Analysis 2020-2024 and Forecast 2025-2035, By Country
    • Historical Market Size Value (US$ Mn) Trend Analysis By Market Taxonomy, 2020-2024
    • Market Size Value (US$ Mn) Forecast By Market Taxonomy, 2025-2035
      • By Country
        • Germany
        • UK
        • Italy
        • Spain
        • France
        • Nordic
        • BENELUX
        • Rest of Western Europe
      • By Services
      • By Application
      • By End-user
    • Market Attractiveness Analysis
      • By Country
      • By Services
      • By Application
      • By End-user
    • Key Takeaways
  13. Eastern Europe Satellite As A Service Market Analysis 2020-2024 and Forecast 2025-2035, By Country
    • Historical Market Size Value (US$ Mn) Trend Analysis By Market Taxonomy, 2020-2024
    • Market Size Value (US$ Mn) Forecast By Market Taxonomy, 2025-2035
      • By Country
        • Russia
        • Poland
        • Hungary
        • Balkan & Baltic
        • Rest of Eastern Europe
      • By Services
      • By Application
      • By End-user
    • Market Attractiveness Analysis
      • By Country
      • By Services
      • By Application
      • By End-user
    • Key Takeaways
  14. East Asia Satellite As A Service Market Analysis 2020-2024 and Forecast 2025-2035, By Country
    • Historical Market Size Value (US$ Mn) Trend Analysis By Market Taxonomy, 2020-2024
    • Market Size Value (US$ Mn) Forecast By Market Taxonomy, 2025-2035
      • By Country
        • China
        • Japan
        • South Korea
      • By Services
      • By Application
      • By End-user
    • Market Attractiveness Analysis
      • By Country
      • By Services
      • By Application
      • By End-user
    • Key Takeaways
  15. South Asia and Pacific Satellite As A Service Market Analysis 2020-2024 and Forecast 2025-2035, By Country
    • Historical Market Size Value (US$ Mn) Trend Analysis By Market Taxonomy, 2020-2024
    • Market Size Value (US$ Mn) Forecast By Market Taxonomy, 2025-2035
      • By Country
        • India
        • ASEAN
        • Australia & New Zealand
        • Rest of South Asia and Pacific
      • By Services
      • By Application
      • By End-user
    • Market Attractiveness Analysis
      • By Country
      • By Services
      • By Application
      • By End-user
    • Key Takeaways
  16. Middle East & Africa Satellite As A Service Market Analysis 2020-2024 and Forecast 2025-2035, By Country
    • Historical Market Size Value (US$ Mn) Trend Analysis By Market Taxonomy, 2020-2024
    • Market Size Value (US$ Mn) Forecast By Market Taxonomy, 2025-2035
      • By Country
        • Kingdom of Saudi Arabia
        • Other GCC Countries
        • Turkiye
        • South Africa
        • Other African Union
        • Rest of Middle East & Africa
      • By Services
      • By Application
      • By End-user
    • Market Attractiveness Analysis
      • By Country
      • By Services
      • By Application
      • By End-user
    • Key Takeaways
  17. Key Countries Satellite As A Service Market Analysis
    • USA
      • Pricing Analysis
      • Market Share Analysis, 2024
        • By Services
        • By Application
        • By End-user
    • Canada
      • Pricing Analysis
      • Market Share Analysis, 2024
        • By Services
        • By Application
        • By End-user
    • Mexico
      • Pricing Analysis
      • Market Share Analysis, 2024
        • By Services
        • By Application
        • By End-user
    • Brazil
      • Pricing Analysis
      • Market Share Analysis, 2024
        • By Services
        • By Application
        • By End-user
    • Chile
      • Pricing Analysis
      • Market Share Analysis, 2024
        • By Services
        • By Application
        • By End-user
    • Germany
      • Pricing Analysis
      • Market Share Analysis, 2024
        • By Services
        • By Application
        • By End-user
    • UK
      • Pricing Analysis
      • Market Share Analysis, 2024
        • By Services
        • By Application
        • By End-user
    • Italy
      • Pricing Analysis
      • Market Share Analysis, 2024
        • By Services
        • By Application
        • By End-user
    • Spain
      • Pricing Analysis
      • Market Share Analysis, 2024
        • By Services
        • By Application
        • By End-user
    • France
      • Pricing Analysis
      • Market Share Analysis, 2024
        • By Services
        • By Application
        • By End-user
    • India
      • Pricing Analysis
      • Market Share Analysis, 2024
        • By Services
        • By Application
        • By End-user
    • ASEAN
      • Pricing Analysis
      • Market Share Analysis, 2024
        • By Services
        • By Application
        • By End-user
    • Australia & New Zealand
      • Pricing Analysis
      • Market Share Analysis, 2024
        • By Services
        • By Application
        • By End-user
    • China
      • Pricing Analysis
      • Market Share Analysis, 2024
        • By Services
        • By Application
        • By End-user
    • Japan
      • Pricing Analysis
      • Market Share Analysis, 2024
        • By Services
        • By Application
        • By End-user
    • South Korea
      • Pricing Analysis
      • Market Share Analysis, 2024
        • By Services
        • By Application
        • By End-user
    • Russia
      • Pricing Analysis
      • Market Share Analysis, 2024
        • By Services
        • By Application
        • By End-user
    • Poland
      • Pricing Analysis
      • Market Share Analysis, 2024
        • By Services
        • By Application
        • By End-user
    • Hungary
      • Pricing Analysis
      • Market Share Analysis, 2024
        • By Services
        • By Application
        • By End-user
    • Kingdom of Saudi Arabia
      • Pricing Analysis
      • Market Share Analysis, 2024
        • By Services
        • By Application
        • By End-user
    • Turkiye
      • Pricing Analysis
      • Market Share Analysis, 2024
        • By Services
        • By Application
        • By End-user
    • South Africa
      • Pricing Analysis
      • Market Share Analysis, 2024
        • By Services
        • By Application
        • By End-user
  18. Market Structure Analysis
    • Competition Dashboard
    • Competition Benchmarking
    • Market Share Analysis of Top Players
      • By Regional
      • By Services
      • By Application
      • By End-user
  19. Competition Analysis
    • Competition Deep Dive
      • Amazon
        • Overview
        • Product Portfolio
        • Profitability by Market Segments (Product/Age /Sales Channel/Region)
        • Sales Footprint
        • Strategy Overview
          • Marketing Strategy
          • Product Strategy
          • Channel Strategy
      • Loft Orbital
      • NanoAvionics
      • Spire Global, Inc.
      • York Space Systems
      • CesiumAstro, Inc.
      • Spacety
  20. Assumptions & Acronyms Used
  21. Research Methodology

List of Tables

  • Table 1: Global Satellite As A Service Market Value (US$ Mn) Forecast by Region, 2020-2035
  • Table 2: North America Satellite As A Service Market Value (US$ Mn) Forecast by Country, 2020-2035
  • Table 3: Latin America Satellite As A Service Market Value (US$ Mn) Forecast by Country, 2020-2035
  • Table 4: Western Europe Satellite As A Service Market Value (US$ Mn) Forecast by Country, 2020-2035
  • Table 5: Eastern Europe Satellite As A Service Market Value (US$ Mn) Forecast by Country, 2020-2035
  • Table 6: East Asia Satellite As A Service Market Value (US$ Mn) Forecast by Country, 2020-2035
  • Table 7: South Asia and Pacific Satellite As A Service Market Value (US$ Mn) Forecast by Country, 2020-2035
  • Table 8: Middle East & Africa Satellite As A Service Market Value (US$ Mn) Forecast by Country, 2020-2035

List of Figures

  • Figure 1: Global Satellite As A Service Market Pricing Analysis
  • Figure 2: Global Satellite As A Service Market Value (US$ Mn) Forecast 2020–2035
  • Figure 3: Global Satellite As A Service Market Value (US$ Mn) Share and BPS Analysis by Region, 2025 and 2035
  • Figure 4: Global Satellite As A Service Market Y-o-Y Growth Comparison by Region, 2025–2035
  • Figure 5: Global Satellite As A Service Market Attractiveness Analysis by Region
  • Figure 6: North America Satellite As A Service Market Incremental $ Opportunity, 2025–2035
  • Figure 7: Latin America Satellite As A Service Market Incremental $ Opportunity, 2025–2035
  • Figure 8: Western Europe Satellite As A Service Market Incremental $ Opportunity, 2025–2035
  • Figure 9: Eastern Europe Satellite As A Service Market Incremental $ Opportunity, 2025–2035
  • Figure 10: East Asia Satellite As A Service Market Incremental $ Opportunity, 2025–2035
  • Figure 11: South Asia and Pacific Satellite As A Service Market Incremental $ Opportunity, 2025–2035
  • Figure 12: Middle East & Africa Satellite As A Service Market Incremental $ Opportunity, 2025–2035
  • Figure 13: North America Satellite As A Service Market Value Share and BPS Analysis by Country, 2025 and 2035
  • Figure 14: Latin America Satellite As A Service Market Value Share and BPS Analysis by Country, 2025 and 2035
  • Figure 15: Western Europe Satellite As A Service Market Value Share and BPS Analysis by Country, 2025 and 2035
  • Figure 16: Eastern Europe Satellite As A Service Market Value Share and BPS Analysis by Country, 2025 and 2035
  • Figure 17: East Asia Satellite As A Service Market Value Share and BPS Analysis by Country, 2025 and 2035
  • Figure 18: South Asia and Pacific Satellite As A Service Market Value Share and BPS Analysis by Country, 2025 and 2035
  • Figure 19: Middle East & Africa Satellite As A Service Market Value Share and BPS Analysis by Country, 2025 and 2035
  • Figure 20: Global Satellite As A Service Market – Tier Structure Analysis
  • Figure 21: Global Satellite As A Service Market – Company Share Analysis

Frequently Asked Questions

How big is the golf cart battery market in 2025?

The global golf cart battery market is estimated to be valued at USD 158.0 million in 2025.

What will be the size of golf cart battery market in 2035?

The market size for the golf cart battery market is projected to reach USD 267.3 million by 2035.

How much will be the golf cart battery market growth between 2025 and 2035?

The golf cart battery market is expected to grow at a 5.4% CAGR between 2025 and 2035.

What are the key product types in the golf cart battery market?

The key product types in golf cart battery market are lead-acid and lithium-ion.

Which voltage segment to contribute significant share in the golf cart battery market in 2025?

In terms of voltage, 6v segment to command 33.9% share in the golf cart battery market in 2025.

Explore Similar Insights

Future Market Insights

Golf Cart Battery Market