It is projected that the global golf tourism industry will reach approximately USD 27.0 billion in 2025 and will expand to around USD 65.8 billion by 2035, registering a CAGR of 9.3% from 2025 to 2035.
Golf tourism is an increasingly important segment within the global travel and tourism industry. The sport continues to grow in popularity as both a recreational and professional activity, with more travellers seeking destinations that offer world-class golf courses combined with premium accommodations and leisure experiences. The rise of golf destinations that blend scenic landscapes with a relaxed atmosphere has fueled the demand for golf tourism, making it a significant driver of travel in several regions.
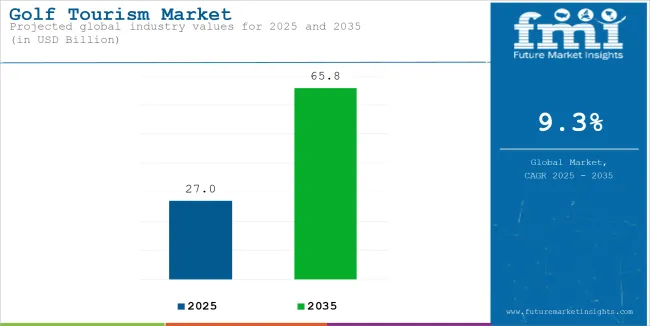
| Attribute | Details |
|---|---|
| Current Golf Tourism Industry Size (2024A) | USD 25.3 Billion |
| Estimated Golf Tourism Industry Size (2025E) | USD 27.0 Billion |
| Projected Golf Tourism Industry Size (2035F) | USD 65.8 Billion |
| Value CAGR (2025 to 2035) | 9.3% |
| Golf Tourism Market Analysis of Top Players Share in 2024 | 30%-35% |
| Year | 2020 |
|---|---|
| Sports Tourism Industry Growth | Valued at USD 500 billion globally, significantly impacted by COVID-19. |
| Golf Tourism Industry Growth | Valued at USD 4.3 billion, with limited travel affecting golf holidays. |
| Year | 2024 |
|---|---|
| Sports Tourism Industry Growth | Projected to reach USD 700 billion, driven by mega-events and adventure sports. |
| Golf Tourism Industry Growth | Estimated at USD 25.3 billion, supported by luxury golf resorts and domestic travel demand. |
| Year | 2025 |
|---|---|
| Sports Tourism Industry Growth | Expected to grow to USD 800 billion, fueled by strong post-COVID recovery. |
| Golf Tourism Industry Growth | Estimated to reach USD 27 billion, driven by international golf events and upscale tourism. |
| Year | 2035 |
|---|---|
| Sports Tourism Industry Growth | Anticipated to exceed USD 1.2 trillion, driven by digital engagement and new markets. |
| Golf Tourism Industry Growth | Forecasted to surpass USD 65.8 billion, fueled by continued demand for luxury golf experiences. |
The global sports tourism industry is quite resilient and growing even bigger. The industry's market value is estimated to move from USD500 billion in 2020 to over USD1.2 trillion by 2035. Considerable drivers for this growth have been the mega-events like FIFA World Cup and Olympics that continue to stay relevant and on top of other trends, while the role of technology in improving fan interaction and engagement is another prominent driver. Europe and North America remain at the top while Asia-Pacific and the Middle East are becoming competitive forces, supported by major investments in class-leading facilities.
Meanwhile, golf tourism is expected to grow steadily: from USD17 billion in 2020 to more than USD40 billion by 2035. The golf industry appeals to high-net-worth individuals and retirees who prefer luxury golf resorts in scenic locations such as Scotland, South Africa, and Thailand. Prestigious tournaments like The Masters and the Ryder Cup have also helped push this niche market into the mainstream.
Both were impacted with a collective hammering during 2020 due to COVID-19, but recovery has been fierce. Sports tourism is coming back through rescheduled events and hybrid models of fan engagement, while golf tourism is capitalizing on its safe open-air appeal. Innovations in digital engagement, sustainability, and bespoke travel will help propel robust growth across these sectors going forward.
The United States will likely remain among the world's leaders in generating domestic as well as international golf tourism. Golf within the country has a rich collection of iconic golf courses, such as Pebble Beach, Augusta National, and Whistling Straits, which continue to attract golfers from every corner of the world. The USA golf tourism market is expected to reach USD 9.3 billion by 2035, growing at a CAGR of 5.2% from 2025 to 2035. Golf resorts and championship courses will remain accessible to both seasoned and amateur golfers, thus continuing to attract them.
While Europe has long been a premium golf tourism destination, the best golfing experiences of the world can still be enjoyed today in Spain, Portugal, and Scotland. Spain's Costa Brava, Portugal's Algarve, and Scotland's St. Andrews are the most popular hotspots. The European golf tourism market is going to increase at a CAGR of 4.3% during 2025 to 2035 with the industry expected to reach USD 5.7 billion in 2035. This is due to the continent's strong infrastructure, historical association with the sport, and diversity of courses that attract many different levels of golfers to the region.
The UK market, home to the birthplace of golf, remains a significant player in global golf tourism. With world-renowned courses like St. Andrews and Royal Birkdale, the UK continues to attract golfers worldwide. The golf tourism market in the UK is expected to reach USD 6.9 billion by 2035, growing at a CAGR of 4.1%. The rich golfing heritage, prestigious tournaments like The Open Championship, and the variety of courses set in scenic locations continue to make the UK a highly desirable golf destination.
Japan market is increasingly emerging as a golf tourism hub in the Asia region, spurred by the increasing popularity of golfing in the Asian continent and high-quality golf courses such as Hokkaido and Okinawa. The Japanese market is estimated to grow at a CAGR of 5.8% from 2025 to 2035 and is expected to reach USD 2.1 billion by 2035. Japan offers unique cultural experiences in combination with the world-class golfing facilities to both domestic and international golfers. Investment in new courses and international tournaments within the country contributes to growth in the golf tourism sector.
Australia has established itself as a prime golf tourism destination, with its iconic courses like the Royal Melbourne Golf Club and Barnbougle Dunes. The golf tourism market in Australia is expected to grow at a CAGR of 4.5% to reach USD 4.5 billion by 2035. With its year-round favourable climate, stunning landscapes, and exceptional golf facilities, Australia will continue to attract golfers from both international and domestic markets.
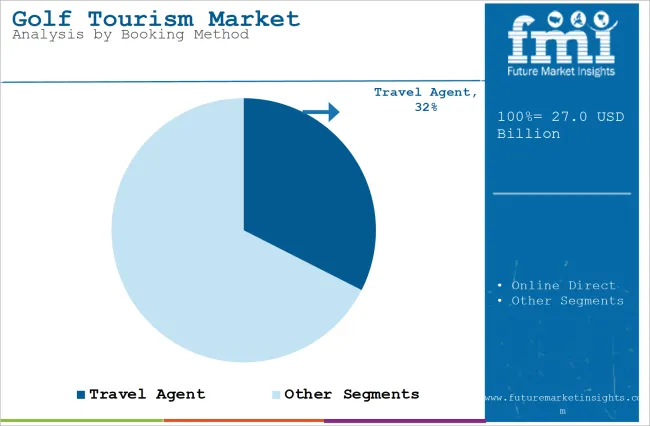
Direct booking would gain the market because of a seamless online platforms or golf resorts directly booking would take the centre, and one in a direct conversation with golfing operators as their trips provide better personalization in deals along with flexibility and thus, over taking the competition given by booking in travel agency to the most demanding golfing segment. Travel agents, however, will still have a significant share of the market, particularly for more niche, high-end, or group-based golf tours.
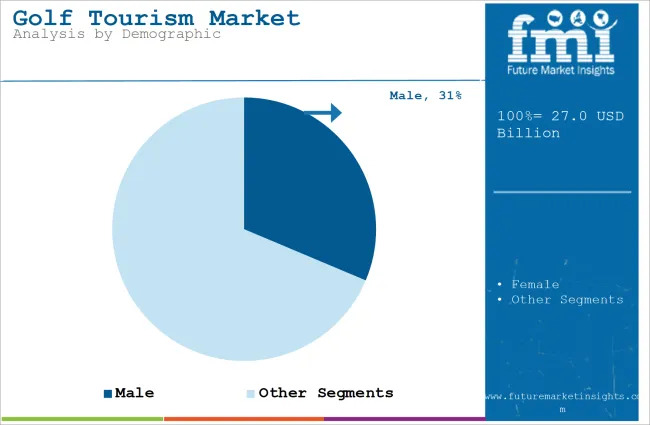
While male golfers have dominated the golf tourism market for a long time, the female demographic is expected to drive faster growth in the coming years. The increasing popularity of women's golf events and the focus on inclusivity in the sport are helping boost female participation in golf tourism. Female golfers are expected to become a more significant driver of market growth as golf resorts tailor more women-friendly packages and experiences. Although the majority segment is of male, there would be growth of females by higher rate so, which supports market expansion.
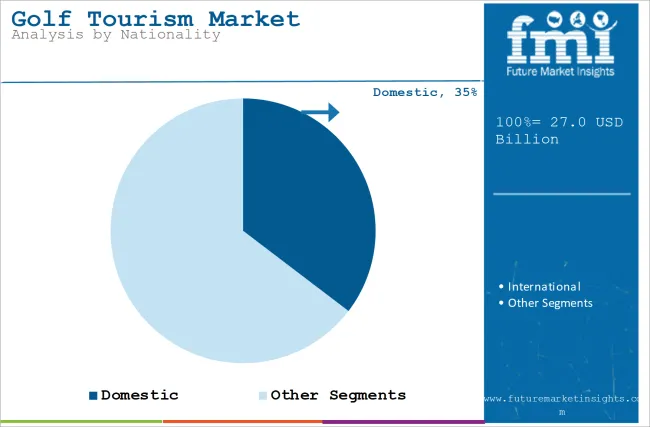
International tourists will account for the major share of the growth of the golf tourism market. Golf tourism is going increasingly global as many golfers now wish to travel to foreign destinations to enjoy some of the world's finest courses in exclusive surroundings. Even though domestic golf tourism will remain very strong in the United States and Europe, international tourism will be growing very rapidly. International tourism will certainly benefit from increases in golfing tourists going out of their borders to destinations as Spain, Portugal, and even the Caribbean.
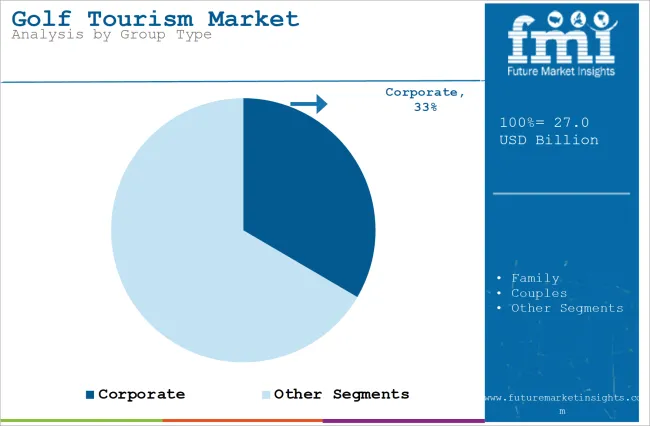
Corporate golf tourism is expected to make up the greatest share of the market. Corporate retreats, incentive programs, and business meetings around golf provide unique opportunities for networking and relaxation for employees. Due to the inclusion of golf in corporate travel packages, this segment is likely to generate considerable revenue. Family and couples will also be essential segments because the golf resorts offer family-friendly amenities and couple-oriented packages. However, the corporate group segment will grow the most, as golfing is still a sport that corporate incentive travelers and business travelers engage in.
| Countries | Domestic vs. International Contribution (%) |
|---|---|
| United States | 60% Domestic, 40% International |
| Scotland | 40% Domestic, 60% International |
| Spain | 35% Domestic, 65% International |
| Thailand | 25% Domestic, 75% International |
| South Africa | 30% Domestic, 70% International |
| Australia | 50% Domestic, 50% International |
| Ireland | 45% Domestic, 55% International |
| Portugal | 35% Domestic, 65% International |
| Japan | 70% Domestic, 30% International |
| Canada | 55% Domestic, 45% International |
Golf tourism industry: That is, it balances the contributory miles among domestic and international audiences, critically scanning the world. Countries that are renowned internationally for having the finest golf courses usually have a large number of international tourists visiting them. Visitors seek to behold beautiful landscapes and have a glimpse of prestigious tournaments. Iconic courses along with exquisite accommodations and favorable climates attract such nationalities as Scotland, Spain, and Thailand.
However, in countries with a golfing culture, domestic tourism remains a very significant generator. Much of the golf tourism, for instance, is still in the United States and Japan driven by domestic travellers who would appreciate easy accessibility and familiarity with the local circuit.
South Africa and Portugal are also using their individual appeal to attract a growing number of international visitors. These destinations offer world-class golfing facilities along with broader cultural and leisure activities, thereby increasing their competitiveness in the global market.
This golf tourism industry thrives on its ability to successfully blend together luxury experiences with the timeless appeal of the sport. Whether it is in the form of internationally acclaimed tournaments or locally tailored golfing experiences, this sector demonstrates smooth and growing cross-border collaboration, ensuring a place at the base of sports tourism.
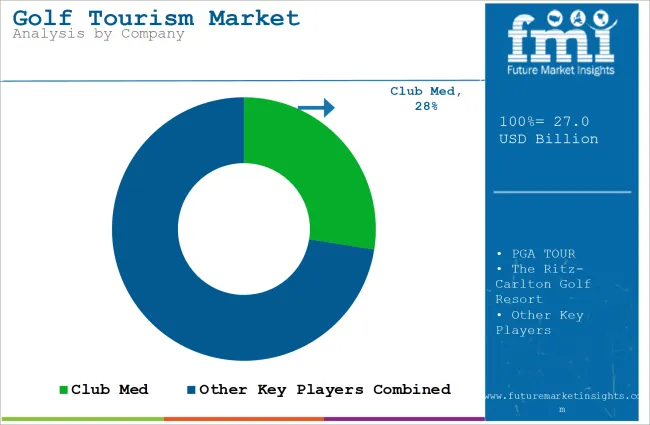
Key players in the golf tourism industry include Club Med, PGA TOUR, The Ritz-Carlton Golf Resort, Hilton Worldwide, and Marriott International. These companies are investing heavily in enhancing their golf offerings, introducing new golf courses, and expanding into emerging markets to maintain their competitive edge.
Recent Developments:
January 2025: PGA TOUR Announcement
The PGA TOUR announced the return of a major championship to one of the most renowned golf destinations. This is an event highly anticipated to raise the profile of the sport, but also bring much-needed economic benefits to the local economy in terms of tourism, as it will attract international visitors and golf enthusiasts from around the world.
December 2024: Club Med International Golf Tournament
Club Med hosted the international golf tournament at one of its flagship destinations. The tour attracted golfers from more than 20 different countries and has further entrenched itself in the market of golf tourism. It established a very specific atmosphere for veteran golfers as well as the holidaymakers wanting an elite experience of golf, all within a resort that encompasses all-inclusiveness.
September 2024: Themed Golf Events at Ritz-Carlton Golf Resort
The Ritz-Carlton Golf Resort launched an exciting series of themed golf events in September 2024, including night golf and exclusive celebrity programs. These unique events were designed to attract a diverse group of guests, offering them new and engaging ways to enjoy the sport while maintaining the luxury and elegance for which the brand is known.
October 2024: Marriott International Golf Travel Partnership
Marriott International has collaborated with a premier golf travel agency to provide tailored golf tours to all golf enthusiasts. This new partnership not only means customized experiences through hassle-free arrangements for transportation and luxurious accommodations but also through access to the world's best golf courses, further solidifying Marriott's lead in the golf tourism market.
September 2024: Hilton Golf Apparel Partnership
In September 2024, Hilton Worldwide joined forces with a leading golf apparel brand to elevate its golf tourism experiences. Under this partnership, guests at participating resorts were treated to complimentary high-quality golf attire during their stay, further enhancing the golfing experience and highlighting Hilton's dedication to delivering a luxury, all-encompassing golf vacation experience.
March 2024: Club Med Caribbean Golf Resort Partnership
Club Med began a new venture with several high-end golf resorts in the Caribbean. The package deal offered unique golf packages to corporate groups and luxury travelers searching for customized golfing experiences. These customized packages were aimed at high-net-worth individuals and corporate clients in search of leisure, wellness, and world-class golf in dream destinations.
January 2024: PGA TOUR New Luxury Resort in Asia
PGA TOUR announced a new luxury golf resort in Asia that combines world-class golf facilities with wellness experiences in order to satisfy the growing demand for luxury golf tourism in the region. This new resort will be located in an exclusive tourism destination and will play a major role in the expansion of the Asian golf market.
| Report Attributes | Details |
|---|---|
| Current Total Market Size (2025) | USD 27.0 billion |
| Projected Market Size (2035) | USD 65.8 billion |
| CAGR (2025 to 2035) | 9.3% |
| Base Year for Estimation | 2024 |
| Historical Period | 2019 to 2024 |
| Projections Period | 2025 to 2035 |
| Quantitative Units | USD billion for value and million visits for volume |
| Booking Methods Analyzed (Segment 1) | Travel Agent, Online Direct |
| Demographics Analyzed (Segment 2) | Male, Female |
| Nationalities Analyzed (Segment 3) | Domestic, International |
| Group Types Analyzed (Segment 4) | Corporate, Family, Couples, Youth Groups, Single Tourist |
| Regions Covered | North America; Latin America; Western Europe; Eastern Europe; East Asia; South Asia and Pacific; Middle East and Africa |
| Countries Covered | United States, Canada, Mexico, Brazil, Germany, France, United Kingdom, Spain, Portugal, China, Japan, India, South Korea, Australia, New Zealand, UAE, South Africa |
| Key Players influencing the Golf Tourism Market | Marriott International, Club Med, Hilton Worldwide, PGA TOUR, Ritz-Carlton, Aramco Team Series, Golfbreaks.com, Your Golf Travel, IAGTO, International Golf Travel Market (IGTM), BCD Sports, TUI Group, Leadingcourses.com, others |
| Additional Attributes | Dollar sales driven by luxury golf travel packages, international destination bookings accelerating, female golf tourism gaining traction, corporate events generating premium revenue, direct booking platforms expanding personalization, Asia-Pacific and Caribbean resorts increasing global participation. |
| Customization and Pricing | Customization and Pricing Available on Request |
The global golf tourism market is estimated to reach approximately USD 27.0 billion in 2025 and expand to USD 65.7 billion by 2035.
The golf tourism market is expected to register a CAGR of 9.3% from 2025 to 2035.
Leading players in the golf tourism industry include Club Med, PGA TOUR, The Ritz-Carlton Golf Resort, Hilton Worldwide, and Marriott International.
Key trends driving the golf tourism market include the rise of luxury golf experiences, the integration of wellness tourism with golf, and the increasing use of technology for bookings and customization.
Table 1: Global Market Value (US$ Million) Forecast by Region, 2019 to 2034
Table 2: Global Market Value (US$ Million) Forecast by Type, 2019 to 2034
Table 3: Global Market Value (US$ Million) Forecast by Service Type, 2019 to 2034
Table 4: Global Market Value (US$ Million) Forecast by End-User, 2019 to 2034
Table 5: North America Market Value (US$ Million) Forecast by Country, 2019 to 2034
Table 6: North America Market Value (US$ Million) Forecast by Type, 2019 to 2034
Table 7: North America Market Value (US$ Million) Forecast by Service Type, 2019 to 2034
Table 8: North America Market Value (US$ Million) Forecast by End-User, 2019 to 2034
Table 9: Latin America Market Value (US$ Million) Forecast by Country, 2019 to 2034
Table 10: Latin America Market Value (US$ Million) Forecast by Type, 2019 to 2034
Table 11: Latin America Market Value (US$ Million) Forecast by Service Type, 2019 to 2034
Table 12: Latin America Market Value (US$ Million) Forecast by End-User, 2019 to 2034
Table 13: Western Europe Market Value (US$ Million) Forecast by Country, 2019 to 2034
Table 14: Western Europe Market Value (US$ Million) Forecast by Type, 2019 to 2034
Table 15: Western Europe Market Value (US$ Million) Forecast by Service Type, 2019 to 2034
Table 16: Western Europe Market Value (US$ Million) Forecast by End-User, 2019 to 2034
Table 17: Eastern Europe Market Value (US$ Million) Forecast by Country, 2019 to 2034
Table 18: Eastern Europe Market Value (US$ Million) Forecast by Type, 2019 to 2034
Table 19: Eastern Europe Market Value (US$ Million) Forecast by Service Type, 2019 to 2034
Table 20: Eastern Europe Market Value (US$ Million) Forecast by End-User, 2019 to 2034
Table 21: South Asia and Pacific Market Value (US$ Million) Forecast by Country, 2019 to 2034
Table 22: South Asia and Pacific Market Value (US$ Million) Forecast by Type, 2019 to 2034
Table 23: South Asia and Pacific Market Value (US$ Million) Forecast by Service Type, 2019 to 2034
Table 24: South Asia and Pacific Market Value (US$ Million) Forecast by End-User, 2019 to 2034
Table 25: East Asia Market Value (US$ Million) Forecast by Country, 2019 to 2034
Table 26: East Asia Market Value (US$ Million) Forecast by Type, 2019 to 2034
Table 27: East Asia Market Value (US$ Million) Forecast by Service Type, 2019 to 2034
Table 28: East Asia Market Value (US$ Million) Forecast by End-User, 2019 to 2034
Table 29: Middle East and Africa Market Value (US$ Million) Forecast by Country, 2019 to 2034
Table 30: Middle East and Africa Market Value (US$ Million) Forecast by Type, 2019 to 2034
Table 31: Middle East and Africa Market Value (US$ Million) Forecast by Service Type, 2019 to 2034
Table 32: Middle East and Africa Market Value (US$ Million) Forecast by End-User, 2019 to 2034
Figure 1: Global Market Value (US$ Million) by Type, 2024 to 2034
Figure 2: Global Market Value (US$ Million) by Service Type, 2024 to 2034
Figure 3: Global Market Value (US$ Million) by End-User, 2024 to 2034
Figure 4: Global Market Value (US$ Million) by Region, 2024 to 2034
Figure 5: Global Market Value (US$ Million) Analysis by Region, 2019 to 2034
Figure 6: Global Market Value Share (%) and BPS Analysis by Region, 2024 to 2034
Figure 7: Global Market Y-o-Y Growth (%) Projections by Region, 2024 to 2034
Figure 8: Global Market Value (US$ Million) Analysis by Type, 2019 to 2034
Figure 9: Global Market Value Share (%) and BPS Analysis by Type, 2024 to 2034
Figure 10: Global Market Y-o-Y Growth (%) Projections by Type, 2024 to 2034
Figure 11: Global Market Value (US$ Million) Analysis by Service Type, 2019 to 2034
Figure 12: Global Market Value Share (%) and BPS Analysis by Service Type, 2024 to 2034
Figure 13: Global Market Y-o-Y Growth (%) Projections by Service Type, 2024 to 2034
Figure 14: Global Market Value (US$ Million) Analysis by End-User, 2019 to 2034
Figure 15: Global Market Value Share (%) and BPS Analysis by End-User, 2024 to 2034
Figure 16: Global Market Y-o-Y Growth (%) Projections by End-User, 2024 to 2034
Figure 17: Global Market Attractiveness by Type, 2024 to 2034
Figure 18: Global Market Attractiveness by Service Type, 2024 to 2034
Figure 19: Global Market Attractiveness by End-User, 2024 to 2034
Figure 20: Global Market Attractiveness by Region, 2024 to 2034
Figure 21: North America Market Value (US$ Million) by Type, 2024 to 2034
Figure 22: North America Market Value (US$ Million) by Service Type, 2024 to 2034
Figure 23: North America Market Value (US$ Million) by End-User, 2024 to 2034
Figure 24: North America Market Value (US$ Million) by Country, 2024 to 2034
Figure 25: North America Market Value (US$ Million) Analysis by Country, 2019 to 2034
Figure 26: North America Market Value Share (%) and BPS Analysis by Country, 2024 to 2034
Figure 27: North America Market Y-o-Y Growth (%) Projections by Country, 2024 to 2034
Figure 28: North America Market Value (US$ Million) Analysis by Type, 2019 to 2034
Figure 29: North America Market Value Share (%) and BPS Analysis by Type, 2024 to 2034
Figure 30: North America Market Y-o-Y Growth (%) Projections by Type, 2024 to 2034
Figure 31: North America Market Value (US$ Million) Analysis by Service Type, 2019 to 2034
Figure 32: North America Market Value Share (%) and BPS Analysis by Service Type, 2024 to 2034
Figure 33: North America Market Y-o-Y Growth (%) Projections by Service Type, 2024 to 2034
Figure 34: North America Market Value (US$ Million) Analysis by End-User, 2019 to 2034
Figure 35: North America Market Value Share (%) and BPS Analysis by End-User, 2024 to 2034
Figure 36: North America Market Y-o-Y Growth (%) Projections by End-User, 2024 to 2034
Figure 37: North America Market Attractiveness by Type, 2024 to 2034
Figure 38: North America Market Attractiveness by Service Type, 2024 to 2034
Figure 39: North America Market Attractiveness by End-User, 2024 to 2034
Figure 40: North America Market Attractiveness by Country, 2024 to 2034
Figure 41: Latin America Market Value (US$ Million) by Type, 2024 to 2034
Figure 42: Latin America Market Value (US$ Million) by Service Type, 2024 to 2034
Figure 43: Latin America Market Value (US$ Million) by End-User, 2024 to 2034
Figure 44: Latin America Market Value (US$ Million) by Country, 2024 to 2034
Figure 45: Latin America Market Value (US$ Million) Analysis by Country, 2019 to 2034
Figure 46: Latin America Market Value Share (%) and BPS Analysis by Country, 2024 to 2034
Figure 47: Latin America Market Y-o-Y Growth (%) Projections by Country, 2024 to 2034
Figure 48: Latin America Market Value (US$ Million) Analysis by Type, 2019 to 2034
Figure 49: Latin America Market Value Share (%) and BPS Analysis by Type, 2024 to 2034
Figure 50: Latin America Market Y-o-Y Growth (%) Projections by Type, 2024 to 2034
Figure 51: Latin America Market Value (US$ Million) Analysis by Service Type, 2019 to 2034
Figure 52: Latin America Market Value Share (%) and BPS Analysis by Service Type, 2024 to 2034
Figure 53: Latin America Market Y-o-Y Growth (%) Projections by Service Type, 2024 to 2034
Figure 54: Latin America Market Value (US$ Million) Analysis by End-User, 2019 to 2034
Figure 55: Latin America Market Value Share (%) and BPS Analysis by End-User, 2024 to 2034
Figure 56: Latin America Market Y-o-Y Growth (%) Projections by End-User, 2024 to 2034
Figure 57: Latin America Market Attractiveness by Type, 2024 to 2034
Figure 58: Latin America Market Attractiveness by Service Type, 2024 to 2034
Figure 59: Latin America Market Attractiveness by End-User, 2024 to 2034
Figure 60: Latin America Market Attractiveness by Country, 2024 to 2034
Figure 61: Western Europe Market Value (US$ Million) by Type, 2024 to 2034
Figure 62: Western Europe Market Value (US$ Million) by Service Type, 2024 to 2034
Figure 63: Western Europe Market Value (US$ Million) by End-User, 2024 to 2034
Figure 64: Western Europe Market Value (US$ Million) by Country, 2024 to 2034
Figure 65: Western Europe Market Value (US$ Million) Analysis by Country, 2019 to 2034
Figure 66: Western Europe Market Value Share (%) and BPS Analysis by Country, 2024 to 2034
Figure 67: Western Europe Market Y-o-Y Growth (%) Projections by Country, 2024 to 2034
Figure 68: Western Europe Market Value (US$ Million) Analysis by Type, 2019 to 2034
Figure 69: Western Europe Market Value Share (%) and BPS Analysis by Type, 2024 to 2034
Figure 70: Western Europe Market Y-o-Y Growth (%) Projections by Type, 2024 to 2034
Figure 71: Western Europe Market Value (US$ Million) Analysis by Service Type, 2019 to 2034
Figure 72: Western Europe Market Value Share (%) and BPS Analysis by Service Type, 2024 to 2034
Figure 73: Western Europe Market Y-o-Y Growth (%) Projections by Service Type, 2024 to 2034
Figure 74: Western Europe Market Value (US$ Million) Analysis by End-User, 2019 to 2034
Figure 75: Western Europe Market Value Share (%) and BPS Analysis by End-User, 2024 to 2034
Figure 76: Western Europe Market Y-o-Y Growth (%) Projections by End-User, 2024 to 2034
Figure 77: Western Europe Market Attractiveness by Type, 2024 to 2034
Figure 78: Western Europe Market Attractiveness by Service Type, 2024 to 2034
Figure 79: Western Europe Market Attractiveness by End-User, 2024 to 2034
Figure 80: Western Europe Market Attractiveness by Country, 2024 to 2034
Figure 81: Eastern Europe Market Value (US$ Million) by Type, 2024 to 2034
Figure 82: Eastern Europe Market Value (US$ Million) by Service Type, 2024 to 2034
Figure 83: Eastern Europe Market Value (US$ Million) by End-User, 2024 to 2034
Figure 84: Eastern Europe Market Value (US$ Million) by Country, 2024 to 2034
Figure 85: Eastern Europe Market Value (US$ Million) Analysis by Country, 2019 to 2034
Figure 86: Eastern Europe Market Value Share (%) and BPS Analysis by Country, 2024 to 2034
Figure 87: Eastern Europe Market Y-o-Y Growth (%) Projections by Country, 2024 to 2034
Figure 88: Eastern Europe Market Value (US$ Million) Analysis by Type, 2019 to 2034
Figure 89: Eastern Europe Market Value Share (%) and BPS Analysis by Type, 2024 to 2034
Figure 90: Eastern Europe Market Y-o-Y Growth (%) Projections by Type, 2024 to 2034
Figure 91: Eastern Europe Market Value (US$ Million) Analysis by Service Type, 2019 to 2034
Figure 92: Eastern Europe Market Value Share (%) and BPS Analysis by Service Type, 2024 to 2034
Figure 93: Eastern Europe Market Y-o-Y Growth (%) Projections by Service Type, 2024 to 2034
Figure 94: Eastern Europe Market Value (US$ Million) Analysis by End-User, 2019 to 2034
Figure 95: Eastern Europe Market Value Share (%) and BPS Analysis by End-User, 2024 to 2034
Figure 96: Eastern Europe Market Y-o-Y Growth (%) Projections by End-User, 2024 to 2034
Figure 97: Eastern Europe Market Attractiveness by Type, 2024 to 2034
Figure 98: Eastern Europe Market Attractiveness by Service Type, 2024 to 2034
Figure 99: Eastern Europe Market Attractiveness by End-User, 2024 to 2034
Figure 100: Eastern Europe Market Attractiveness by Country, 2024 to 2034
Figure 101: South Asia and Pacific Market Value (US$ Million) by Type, 2024 to 2034
Figure 102: South Asia and Pacific Market Value (US$ Million) by Service Type, 2024 to 2034
Figure 103: South Asia and Pacific Market Value (US$ Million) by End-User, 2024 to 2034
Figure 104: South Asia and Pacific Market Value (US$ Million) by Country, 2024 to 2034
Figure 105: South Asia and Pacific Market Value (US$ Million) Analysis by Country, 2019 to 2034
Figure 106: South Asia and Pacific Market Value Share (%) and BPS Analysis by Country, 2024 to 2034
Figure 107: South Asia and Pacific Market Y-o-Y Growth (%) Projections by Country, 2024 to 2034
Figure 108: South Asia and Pacific Market Value (US$ Million) Analysis by Type, 2019 to 2034
Figure 109: South Asia and Pacific Market Value Share (%) and BPS Analysis by Type, 2024 to 2034
Figure 110: South Asia and Pacific Market Y-o-Y Growth (%) Projections by Type, 2024 to 2034
Figure 111: South Asia and Pacific Market Value (US$ Million) Analysis by Service Type, 2019 to 2034
Figure 112: South Asia and Pacific Market Value Share (%) and BPS Analysis by Service Type, 2024 to 2034
Figure 113: South Asia and Pacific Market Y-o-Y Growth (%) Projections by Service Type, 2024 to 2034
Figure 114: South Asia and Pacific Market Value (US$ Million) Analysis by End-User, 2019 to 2034
Figure 115: South Asia and Pacific Market Value Share (%) and BPS Analysis by End-User, 2024 to 2034
Figure 116: South Asia and Pacific Market Y-o-Y Growth (%) Projections by End-User, 2024 to 2034
Figure 117: South Asia and Pacific Market Attractiveness by Type, 2024 to 2034
Figure 118: South Asia and Pacific Market Attractiveness by Service Type, 2024 to 2034
Figure 119: South Asia and Pacific Market Attractiveness by End-User, 2024 to 2034
Figure 120: South Asia and Pacific Market Attractiveness by Country, 2024 to 2034
Figure 121: East Asia Market Value (US$ Million) by Type, 2024 to 2034
Figure 122: East Asia Market Value (US$ Million) by Service Type, 2024 to 2034
Figure 123: East Asia Market Value (US$ Million) by End-User, 2024 to 2034
Figure 124: East Asia Market Value (US$ Million) by Country, 2024 to 2034
Figure 125: East Asia Market Value (US$ Million) Analysis by Country, 2019 to 2034
Figure 126: East Asia Market Value Share (%) and BPS Analysis by Country, 2024 to 2034
Figure 127: East Asia Market Y-o-Y Growth (%) Projections by Country, 2024 to 2034
Figure 128: East Asia Market Value (US$ Million) Analysis by Type, 2019 to 2034
Figure 129: East Asia Market Value Share (%) and BPS Analysis by Type, 2024 to 2034
Figure 130: East Asia Market Y-o-Y Growth (%) Projections by Type, 2024 to 2034
Figure 131: East Asia Market Value (US$ Million) Analysis by Service Type, 2019 to 2034
Figure 132: East Asia Market Value Share (%) and BPS Analysis by Service Type, 2024 to 2034
Figure 133: East Asia Market Y-o-Y Growth (%) Projections by Service Type, 2024 to 2034
Figure 134: East Asia Market Value (US$ Million) Analysis by End-User, 2019 to 2034
Figure 135: East Asia Market Value Share (%) and BPS Analysis by End-User, 2024 to 2034
Figure 136: East Asia Market Y-o-Y Growth (%) Projections by End-User, 2024 to 2034
Figure 137: East Asia Market Attractiveness by Type, 2024 to 2034
Figure 138: East Asia Market Attractiveness by Service Type, 2024 to 2034
Figure 139: East Asia Market Attractiveness by End-User, 2024 to 2034
Figure 140: East Asia Market Attractiveness by Country, 2024 to 2034
Figure 141: Middle East and Africa Market Value (US$ Million) by Type, 2024 to 2034
Figure 142: Middle East and Africa Market Value (US$ Million) by Service Type, 2024 to 2034
Figure 143: Middle East and Africa Market Value (US$ Million) by End-User, 2024 to 2034
Figure 144: Middle East and Africa Market Value (US$ Million) by Country, 2024 to 2034
Figure 145: Middle East and Africa Market Value (US$ Million) Analysis by Country, 2019 to 2034
Figure 146: Middle East and Africa Market Value Share (%) and BPS Analysis by Country, 2024 to 2034
Figure 147: Middle East and Africa Market Y-o-Y Growth (%) Projections by Country, 2024 to 2034
Figure 148: Middle East and Africa Market Value (US$ Million) Analysis by Type, 2019 to 2034
Figure 149: Middle East and Africa Market Value Share (%) and BPS Analysis by Type, 2024 to 2034
Figure 150: Middle East and Africa Market Y-o-Y Growth (%) Projections by Type, 2024 to 2034
Figure 151: Middle East and Africa Market Value (US$ Million) Analysis by Service Type, 2019 to 2034
Figure 152: Middle East and Africa Market Value Share (%) and BPS Analysis by Service Type, 2024 to 2034
Figure 153: Middle East and Africa Market Y-o-Y Growth (%) Projections by Service Type, 2024 to 2034
Figure 154: Middle East and Africa Market Value (US$ Million) Analysis by End-User, 2019 to 2034
Figure 155: Middle East and Africa Market Value Share (%) and BPS Analysis by End-User, 2024 to 2034
Figure 156: Middle East and Africa Market Y-o-Y Growth (%) Projections by End-User, 2024 to 2034
Figure 157: Middle East and Africa Market Attractiveness by Type, 2024 to 2034
Figure 158: Middle East and Africa Market Attractiveness by Service Type, 2024 to 2034
Figure 159: Middle East and Africa Market Attractiveness by End-User, 2024 to 2034
Figure 160: Middle East and Africa Market Attractiveness by Country, 2024 to 2034


Full Research Suite comprises of:
Market outlook & trends analysis
Interviews & case studies
Strategic recommendations
Vendor profiles & capabilities analysis
5-year forecasts
8 regions and 60+ country-level data splits
Market segment data splits
12 months of continuous data updates
DELIVERED AS:
PDF EXCEL ONLINE
UK Golf Tourism Market Analysis
USA Golf Tourism Market Analysis
Japan Golf Tourism Market Analysis
Europe Golf Tourism Market Insights - Growth & Forecast 2025 to 2035
Germany Golf Tourism Market Trends – Growth, Demand & Forecast 2025–2035
GCC Countries Golf Tourism Market Analysis – Growth, Trends & Forecast 2025–2035
Golf Shoes Market Size and Share Forecast Outlook 2025 to 2035
Golf Cart Batteries Market Size and Share Forecast Outlook 2025 to 2035
Golf Equipment Market Size and Share Forecast Outlook 2025 to 2035
Golf Ball Picker Robot Market Size and Share Forecast Outlook 2025 to 2035
Golf Course Maintenance Robot Market Size and Share Forecast Outlook 2025 to 2035
Golf Putter Market Size and Share Forecast Outlook 2025 to 2035
Golf Cart Battery Market Size and Share Forecast Outlook 2025 to 2035
Golf Accessories Market Size and Share Forecast Outlook 2025 to 2035
Golf Cart Market Analysis - Size, Share, and Forecast 2025 to 2035
Golf Training Aids Market Analysis by Growth, Trends and Forecast from 2025 to 2035
Golf Outfit Market Growth - Trends & Forecast 2025 to 2035
Electric Golf Cart Market Growth – Trends & Forecast 2025 to 2035
GCC Electric Golf Cart Market Outlook – Demand, Growth & Forecast 2025-2035
Japan Electric Golf Cart Market Insights – Demand, Growth & Forecast 2025-2035

Thank you!
You will receive an email from our Business Development Manager. Please be sure to check your SPAM/JUNK folder too.
Chat With
MaRIA