Reports

- Global Locations -

Headquarters

Future Market Insights, Inc.

Christiana Corporate, 200
Continental Drive, Suite 401,
Newark, Delaware - 19713,
United States

T: +1-845-579-5705

Americas

Future Market Insights, Inc.

616 Corporate Way, Suite 2-9018,
Valley Cottage, NY 10989, United States

T: +1-347-918-3531

MEA

Future Market Insights

1602-6 Jumeirah Bay X2 Tower, Plot No: JLT-PH2-X2A,
Jumeirah Lakes Towers, Dubai,
United Arab Emirates

Europe

Future Market Insights

3rd Floor, 207 Regent Street,
W1B 3HH London
United Kingdom

T: + 44 (0) 20 8123 9659
D: +44 (0) 20 3287 4268

Asia Pacific

Future Market Insights

IndiaLand Global Tech Park, Unit UG-1, Behind Grand HighStreet, Phase 1, Hinjawadi, MH, Pune – 411057, India

Farm Equipment Market Outlook from 2024 to 2034

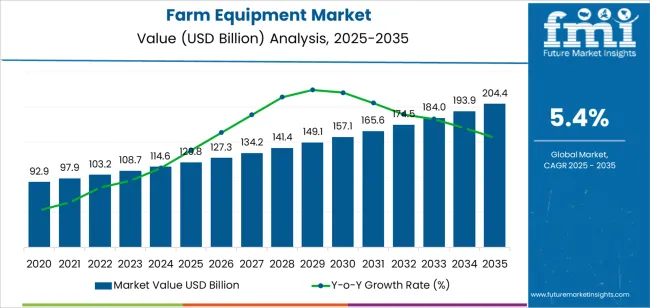
The farm equipment market is valued at US$ 114.6 billion in 2024 and is expected to reach US$ 194.0 billion by 2034. Sales of farm equipment are projected to rise at a CAGR of 5.40% over the forecast period.

Attributes Key Statistics
Farm Equipment Market Value (2024) US$ 114.6 billion
Anticipated Market Value (2034) US$ 194.00 billion
Estimated Growth (2024 to 2034) 5.40% CAGR

Don't pay for what you don't need

Customize your report by selecting specific countries or regions and save 30%!

Key Market Drivers

The farm equipment market generated an estimated revenue of US$ 82 billion in 2019. In four years, the market grew at a pace of 7.10% and added revenue of US$ 25.70 billion. Several reasons can be attributed to this growth:

  • Increased adoption of precision agriculture technologies using GPS, sensors, drones, and data analytics to optimize inputs such as water, fertilizers, and pesticides
  • Expansion of commercial farming operations, requiring more advanced and larger machinery to manage extensive acreage efficiently
  • Government incentives and subsidies for agricultural mechanization, encouraging farmers to invest in modern equipment to boost agricultural productivity, ensure food security, and support rural economies
  • Ongoing technological advancements in farm equipment, such as more powerful engines, better ergonomics, improved automation, and enhanced connectivity
  • Growing awareness of sustainability and environmental concerns about environmental degradation, climate change, and resource depletion pushing farmers to adopt eco-friendly farming practices
  • Expansion of agricultural land to meet increasing demand in emerging economies such as India, China, Brazil, Indonesia, etc.
  • Rising global population driving demand for efficient food production, necessitating greater investment in modern farm equipment

Consumption Analysis of the Farm Equipment Market

  • The agriculture sector is increasingly adopting farm equipment, especially for farmers who operate extensive acreage. These farmers require heavy-duty machinery for planting, cultivating, harvesting, and other tasks.
  • Sales of farm equipment are also growing among smaller farmers. Agriculturists in this group use basic equipment such as tractors, tillers, and harvesters to manage their crops efficiently.
  • Increasing demand for farm equipment from contract farmers who work on contracts for larger agricultural companies or cooperatives as they rely on these machines for various applications.
  • Livestock farmers also incorporate farm equipment, such as feeding systems, barn cleaners, and milking machines, into their daily activities to manage their operations effectively.
  • The growing adoption of farm equipment is also observed in government entities responsible for maintaining public lands, managing forests, or conducting research for land management and conservation purposes.
  • Sales of farm equipment are also touching the skies among individuals with small hobby farms or gardening interests. This consumer group uses basic farming equipment to manage their lands and crops.
Nandini Roy Choudhury

Principal Consultant

Talk to Analyst

Find your sweet spots for generating winning opportunities in this market.

Factors Adversely Affecting the Farm Equipment Market

The market is anticipated to surpass a valuation of US$ 194.00 billion, expanding at a 5.40% CAGR through 2034. While the market is expected to experience remarkable growth, several restraining factors could adversely affect its development:

  • The upfront cost associated with advanced and sophisticated farm equipment is very high. This keeps a substantial number of farmers in underdeveloped and developing countries away from the market.
  • Agricultural activities are heavily dependent on weather conditions and seasonal fluctuations. This significantly affects the income of the farmers and their ability to invest in new equipment during periods of economic uncertainty.
  • Operating and maintaining modern farm equipment requires specialized skills and training. Shortage of skilled labor in rural areas can considerably hinder the adoption of advanced machinery and technologies.
  • Emerging technologies, such as robotics, artificial intelligence, and vertical farming, can also restrict sales of farm equipment.

Comparative View of Adjacent Industries

The section provides a comparative analysis of three interrelated markets, which are the farm equipment market, the horse-drawn farming equipment market, and the poultry farming equipment market.

The growth rates and the current market valuation have been mentioned in the tables below. The growth factors and critical challenges in the respective markets have also been discussed below. Based on these numbers, the market for poultry farming equipment is anticipated to overpower the other two in the coming future.

Farm Equipment Market:

Attributes Farm Equipment Market
CAGR (2024 to 2034) 5.40%
Market Value (2024) US$ 114.60 billion
Growth Factor Government incentives and subsidies for agricultural mechanization in countries such as India, the United States, and China
Challenges The initial upfront investment required to acquire modern and sophisticated farming equipment

Poultry Farming Equipment Market:

Attributes Poultry Farming Equipment Market
CAGR (2023 to 2033) 6.00%
Market Value (2023) US$ 3.51 billion
Growth Factor The adoption of poultry farming equipment as a result of people's rising inclination for meat consumption
Challenges Various diseases such as avian influenza, Newcastle disease, and infectious bronchitis, deter farmers from practising poultry farming

Horse Drawn Farming Equipment Market:

Attributes Horse Drawn Farming Equipment Market
CAGR (2023 to 2033) 5.50%
Market Value (2023) US$ 4.48 billion
Growth Factor The increasing utilization of horses for agricultural operations in certain areas without access to mechanized equipment
Challenges The availability of draft animals like horses is limited and without them, this equipment cannot be operated.

Get the data you need at a Fraction of the cost

Personalize your report by choosing insights you need
and save 40%!

Category-wise Insights

Farmers Increasingly Prefer Low Horsepower Motors for Agricultural Activities

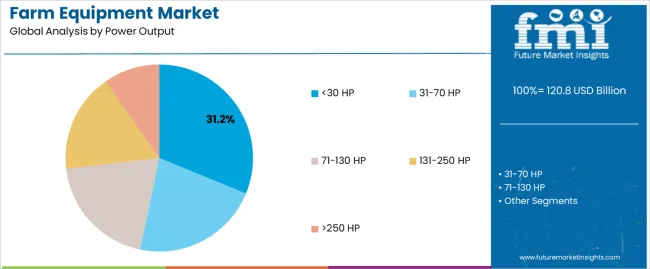
Depending on the power output, the farm equipment market is bifurcated into < 30 HP, 31-70 HP, 71-130 HP, 131-250 HP, and >250 HP. The <30 HP segment is anticipated to grow at a CAGR of 5.20% through 2034.

  • The demand for low-horsepower motors (<30 HP) is skyrocketing among farmers as they come at a lower initial cost compared to higher horsepower models, making them more affordable for small-scale farmers or those with limited budgets.
  • These motors are also more versatile and maneuverable, allowing farmers to work in tight spaces or navigate rough terrain more easily, especially in smaller farms or orchards
  • Agriculturists also prefer low-horsepower motors as they tend to consume less fuel, which can result in significant cost savings over time
Attributes Details
Top Power Output <30 HP
CAGR (2024 to 2034) 5.20%

Two-wheel Drive Farming Equipment Gaining Popularity among Small Farmers

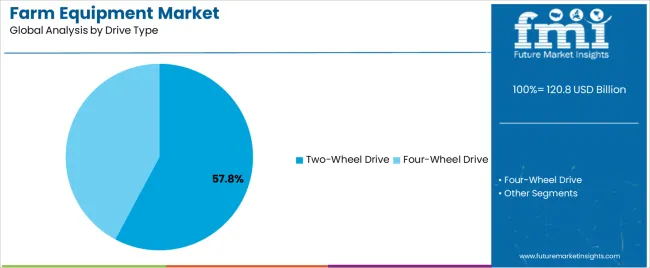
The farm equipment market is categorized by drive type into two-wheel drive and four-wheel drive. The two-wheel drive segment dominates the market and is anticipated to grow at a CAGR of 5.00% through 2034.

  • Just like low-horsepower motors, two-wheel drive equipment comes at a lower cost compared to four-wheel drive counterparts, making it more accessible to small-scale farmers with limited financial resources.
  • The demand for these films is also touching the skies as they are generally simpler in design and have fewer components, resulting in easier maintenance and lower repair costs for farmers.
Attributes Details
Top Drive Type Two-wheel Drive
CAGR (2024 to 2034) 5.00%

Country-wise Insights

The section provides an analysis of the farm equipment market by country, including Japan, China, the United States, South Korea, and the United Kingdom. The table presents the CAGRs for each country through 2034.

Countries CAGR (2024 to 2034)
South Korea 7.40%
Japan 6.90%
United Kingdom 6.60%
China 5.90%
United States 5.70%

Farm Equipment Market in South Korea

South Korea is one of the leading countries in the market. The South Korean farm equipment market is anticipated to retain its dominance by progressing at a CAGR of 7.40% until 2034.

  • South Korea's government provides subsidies and incentives to promote agricultural modernization and increase farm productivity. These initiatives encourage farmers to invest in advanced farm equipment and technology, driving market growth in the country.
  • Besides this, the country is also experiencing growth in farmer population. This naturally generates a need for labor-saving machinery and equipment to maintain agricultural productivity.

Farm Equipment Market in Japan

Japan also dominates the farm equipment market. The Japanese farm equipment market is anticipated to retain its dominance by progressing at an annual growth rate of 6.90% through 2034.

  • Similar to South Korea, Japan faces challenges related to an aging farming population and a declining farm labor force. This is why, there's a strong demand for labor-saving machinery and automation technologies to sustain agricultural production.
  • Japan is also known for its technological innovation in the agriculture sector. Companies in the country are continuously coming up with new features, such as GPS-guided tractors and drones for crop monitoring, spurring the demand for high-tech farm equipment among Korean farmers.

Farm Equipment Market in the United Kingdom

The United Kingdom, too, dominates the farm equipment market in the international marketplace. The United Kingdom farm equipment market is anticipated to exhibit an annual growth rate of 6.60% through 2034.

  • Farm consolidation trends in the United Kingdom have resulted in larger farms with greater acreage. This has increased the demand for larger and more advanced farm machinery to manage operations efficiently and maximize productivity.
  • Due to Brexit, there's a renewed focus on domestic food production and self-sufficiency in the UK. This has pushed significant investments in the agriculture sector from both, the private and public sectors to modernize farming infrastructure and equipment to enhance domestic agricultural capacity and reduce reliance on imports.

Farm Equipment Market in China

China is also one of the leading countries in the global farm equipment market, which is anticipated to register a CAGR of 5.90% through 2034.

  • Over the last few decades, the Chinese government has been actively promoting agricultural mechanization to increase productivity, reduce labor costs, and alleviate rural poverty. This has increased the adoption of farm equipment in the country.
  • The country has also seen a substantial plunge in the farming population due to rapid migration, industrialization, and urbanization. This has driven the need for labor-saving machinery and equipment to maintain agricultural output.

Farm Equipment Market in the United States

The United States, too, leads the farm equipment market. Over the next ten years, the demand for farm equipment is projected to rise at a 5.70% CAGR.
  • The United States is considered a leader in agricultural technology development. Companies in the United States always innovate by bringing new features to farm equipment, augmenting the adoption among the farmers.
  • The majority of farm equipment in the States is aging. This has generated excellent opportunities for farm equipment manufacturers to tap into the United States market. Active promotion, collaboration, and marketing have elevated the adoption rates in the country.

Competitive Landscape

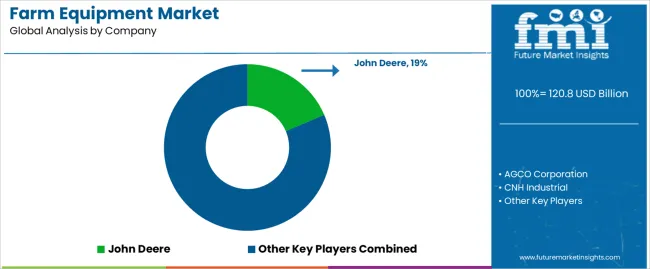
The market for farm equipment is filled with numerous players that cater to small as well as large farmers. Prominent companies in the market include John Deere, AGCO Corporation, CNH Industrial, Kubota Corporation, Mahindra & Mahindra Limited, Claas KGaA mbH, SDF Group, Escorts Group, Yanmar Co., Ltd., and Deutz-Fahr.

These companies offer a wide range of farm equipment and machinery, including tractors, harvesters, implements, and precision agriculture technologies, catering to the diverse needs of farmers. Government bodies also collaborate with these companies to provide affordable yet effective farming equipment to farmers with low per capita income.

Recent Developments

  • In January 2024, John Deere and Corteva partnered to provide farmers with customized agronomic solutions. The collaboration streamlined access to Corteva's agronomic recommendations through the John Deere Operations Center, merging Deere's digital capabilities with Corteva's agricultural expertise.
  • In December 2023, XING Mobility received investment from Kubota Corporation. This strategic investment accelerates Kubota’s roadmap toward machinery electrification, promoting sustainability in agriculture and beyond. It also enables XING Mobility to expedite the development of immersion cooling battery systems.
  • In January 2024, CNH Industrial announced that its engine plant in Noida would commence commercial production of Tier-IV and Trem-V engines by September-October. The plant, aiming to bolster off-road construction and agriculture sectors, signaled a significant milestone for the company's operations.

Key Companies in the Market

  • John Deere
  • AGCO Corporation
  • CNH Industrial
  • Kubota Corporation
  • Mahindra & Mahindra Limited
  • Claas KGaA mbH
  • SDF Group (Same Deutz-Fahr)
  • Escorts Group
  • Yanmar Co., Ltd.
  • Deutz-Fahr
  • Massey Ferguson
  • New Holland Agriculture
  • Case IH
  • JCB
  • Fendt
  • Valtra
  • Kuhn Group
  • McCormick Tractors
  • Challenger
  • Landini Tractors

Market Segmentation

By Power Output:

  • <30 HP
  • 31-70 HP
  • 71-130 HP
  • 131-250 HP
  • >250 HP

By Drive Type:

  • Two-wheel drive
  • Four-wheel drive

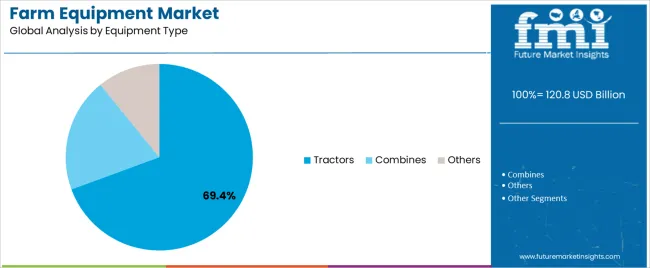
By Equipment Type:

  • Tractors
  • Combines
  • Others

By Region:

  • North America
  • Latin America
  • Asia Pacific
  • Middle East and Africa (MEA)
  • Europe

Frequently Asked Questions

How Big is the Farm Equipment Market in 2024?

The farm equipment market is expected to be worth US$ 114.60 billion in 2024.

What is the Sales Forecast for Farm Equipment through 2034?

The market is expected to reach a valuation of US$ 194.00 billion by 2034.

At What Rate is the Market Growing over the Forecast Period?

The market is expected to rise at a CAGR of 5.40% from 2024 to 2034.

Which are the Key Manufacturing Companies for Farm Equipment?

John Deere, AGCO Corporation, CNH Industrial, Kubota Corporation, Mahindra & Mahindra Limited are some of the major players in the market for farm equipment.

What was the Farm Equipment Market Valuation in 2023?

The valuation for the farm equipment market was US$ 107.7 billion in 2023.

Table of Content

1. Executive Summary

    1.1. Global Market Outlook

    1.2. Demand-side Trends

    1.3. Supply-side Trends

    1.4. Technology Roadmap Analysis

    1.5. Analysis and Recommendations

2. Market Overview

    2.1. Market Coverage / Taxonomy

    2.2. Market Definition / Scope / Limitations

3. Market Background

    3.1. Market Dynamics

        3.1.1. Drivers

        3.1.2. Restraints

        3.1.3. Opportunity

        3.1.4. Trends

    3.2. Scenario Forecast

        3.2.1. Demand in Optimistic Scenario

        3.2.2. Demand in Likely Scenario

        3.2.3. Demand in Conservative Scenario

    3.3. Opportunity Map Analysis

    3.4. Product Life Cycle Analysis

    3.5. Supply Chain Analysis

        3.5.1. Supply Side Participants and their Roles

            3.5.1.1. Producers

            3.5.1.2. Mid-Level Participants (Traders/ Agents/ Brokers)

            3.5.1.3. Wholesalers and Distributors

        3.5.2. Value Added and Value Created at Node in the Supply Chain

        3.5.3. List of Raw Material Suppliers

        3.5.4. List of Existing and Potential Buyer’s

    3.6. Investment Feasibility Matrix

    3.7. Value Chain Analysis

        3.7.1. Profit Margin Analysis

        3.7.2. Wholesalers and Distributors

        3.7.3. Retailers

    3.8. PESTLE and Porter’s Analysis

    3.9. Regulatory Landscape

        3.9.1. By Key Regions

        3.9.2. By Key Countries

    3.10. Regional Parent Market Outlook

    3.11. Production and Consumption Statistics

    3.12. Import and Export Statistics

4. Global Market Analysis 2019 to 2023 and Forecast, 2024 to 2034

    4.1. Historical Market Size Value (US$ Million) & Volume (Units) Analysis, 2019 to 2023

    4.2. Current and Future Market Size Value (US$ Million) & Volume (Units) Projections, 2024 to 2034

        4.2.1. Y-o-Y Growth Trend Analysis

        4.2.2. Absolute $ Opportunity Analysis

5. Global Market Analysis 2019 to 2023 and Forecast 2024 to 2034, By Power Output

    5.1. Introduction / Key Findings

    5.2. Historical Market Size Value (US$ Million) & Volume (Units) Analysis By Power Output, 2019 to 2023

    5.3. Current and Future Market Size Value (US$ Million) & Volume (Units) Analysis and Forecast By Power Output, 2024 to 2034

        5.3.1. <30 HP

        5.3.2. 31-70 HP

        5.3.3. 71-130 HP

        5.3.4. 131-250 HP

        5.3.5. >250 HP

    5.4. Y-o-Y Growth Trend Analysis By Power Output, 2019 to 2023

    5.5. Absolute $ Opportunity Analysis By Power Output, 2024 to 2034

6. Global Market Analysis 2019 to 2023 and Forecast 2024 to 2034, By Drive Type

    6.1. Introduction / Key Findings

    6.2. Historical Market Size Value (US$ Million) & Volume (Units) Analysis By Drive Type, 2019 to 2023

    6.3. Current and Future Market Size Value (US$ Million) & Volume (Units) Analysis and Forecast By Drive Type, 2024 to 2034

        6.3.1. Two-wheel drive

        6.3.2. Four-wheel drive

    6.4. Y-o-Y Growth Trend Analysis By Drive Type, 2019 to 2023

    6.5. Absolute $ Opportunity Analysis By Drive Type, 2024 to 2034

7. Global Market Analysis 2019 to 2023 and Forecast 2024 to 2034, By Equipment Type

    7.1. Introduction / Key Findings

    7.2. Historical Market Size Value (US$ Million) & Volume (Units) Analysis By Equipment Type, 2019 to 2023

    7.3. Current and Future Market Size Value (US$ Million) & Volume (Units) Analysis and Forecast By Equipment Type, 2024 to 2034

        7.3.1. Tractors

        7.3.2. Combines

        7.3.3. Others

    7.4. Y-o-Y Growth Trend Analysis By Equipment Type, 2019 to 2023

    7.5. Absolute $ Opportunity Analysis By Equipment Type, 2024 to 2034

8. Global Market Analysis 2019 to 2023 and Forecast 2024 to 2034, By Region

    8.1. Introduction

    8.2. Historical Market Size Value (US$ Million) & Volume (Units) Analysis By Region, 2019 to 2023

    8.3. Current Market Size Value (US$ Million) & Volume (Units) Analysis and Forecast By Region, 2024 to 2034

        8.3.1. North America

        8.3.2. Latin America

        8.3.3. Europe

        8.3.4. East Asia

        8.3.5. South Asia

        8.3.6. Oceania

        8.3.7. MEA

    8.4. Market Attractiveness Analysis By Region

9. North America Market Analysis 2019 to 2023 and Forecast 2024 to 2034, By Country

    9.1. Historical Market Size Value (US$ Million) & Volume (Units) Trend Analysis By Market Taxonomy, 2019 to 2023

    9.2. Market Size Value (US$ Million) & Volume (Units) Forecast By Market Taxonomy, 2024 to 2034

        9.2.1. By Country

            9.2.1.1. USA

            9.2.1.2. Canada

        9.2.2. By Power Output

        9.2.3. By Drive Type

        9.2.4. By Equipment Type

    9.3. Market Attractiveness Analysis

        9.3.1. By Country

        9.3.2. By Power Output

        9.3.3. By Drive Type

        9.3.4. By Equipment Type

    9.4. Key Takeaways

10. Latin America Market Analysis 2019 to 2023 and Forecast 2024 to 2034, By Country

    10.1. Historical Market Size Value (US$ Million) & Volume (Units) Trend Analysis By Market Taxonomy, 2019 to 2023

    10.2. Market Size Value (US$ Million) & Volume (Units) Forecast By Market Taxonomy, 2024 to 2034

        10.2.1. By Country

            10.2.1.1. Brazil

            10.2.1.2. Mexico

            10.2.1.3. Argentina

            10.2.1.4. Rest of Latin America

        10.2.2. By Power Output

        10.2.3. By Drive Type

        10.2.4. By Equipment Type

    10.3. Market Attractiveness Analysis

        10.3.1. By Country

        10.3.2. By Power Output

        10.3.3. By Drive Type

        10.3.4. By Equipment Type

    10.4. Key Takeaways

11. Europe Market Analysis 2019 to 2023 and Forecast 2024 to 2034, By Country

    11.1. Historical Market Size Value (US$ Million) & Volume (Units) Trend Analysis By Market Taxonomy, 2019 to 2023

    11.2. Market Size Value (US$ Million) & Volume (Units) Forecast By Market Taxonomy, 2024 to 2034

        11.2.1. By Country

            11.2.1.1. Germany

            11.2.1.2. Italy

            11.2.1.3. France

            11.2.1.4. UK

            11.2.1.5. Spain

            11.2.1.6. Russia

            11.2.1.7. BENELUX

            11.2.1.8. Rest of Europe

        11.2.2. By Power Output

        11.2.3. By Drive Type

        11.2.4. By Equipment Type

    11.3. Market Attractiveness Analysis

        11.3.1. By Country

        11.3.2. By Power Output

        11.3.3. By Drive Type

        11.3.4. By Equipment Type

    11.4. Key Takeaways

12. East Asia Market Analysis 2019 to 2023 and Forecast 2024 to 2034, By Country

    12.1. Historical Market Size Value (US$ Million) & Volume (Units) Trend Analysis By Market Taxonomy, 2019 to 2023

    12.2. Market Size Value (US$ Million) & Volume (Units) Forecast By Market Taxonomy, 2024 to 2034

        12.2.1. By Country

            12.2.1.1. China

            12.2.1.2. Japan

            12.2.1.3. South Korea

        12.2.2. By Power Output

        12.2.3. By Drive Type

        12.2.4. By Equipment Type

    12.3. Market Attractiveness Analysis

        12.3.1. By Country

        12.3.2. By Power Output

        12.3.3. By Drive Type

        12.3.4. By Equipment Type

    12.4. Key Takeaways

13. South Asia Market Analysis 2019 to 2023 and Forecast 2024 to 2034, By Country

    13.1. Historical Market Size Value (US$ Million) & Volume (Units) Trend Analysis By Market Taxonomy, 2019 to 2023

    13.2. Market Size Value (US$ Million) & Volume (Units) Forecast By Market Taxonomy, 2024 to 2034

        13.2.1. By Country

            13.2.1.1. India

            13.2.1.2. Thailand

            13.2.1.3. Malaysia

            13.2.1.4. Indonesia

            13.2.1.5. Rest of South Asia

        13.2.2. By Power Output

        13.2.3. By Drive Type

        13.2.4. By Equipment Type

    13.3. Market Attractiveness Analysis

        13.3.1. By Country

        13.3.2. By Power Output

        13.3.3. By Drive Type

        13.3.4. By Equipment Type

    13.4. Key Takeaways

14. Oceania Market Analysis 2019 to 2023 and Forecast 2024 to 2034, By Country

    14.1. Historical Market Size Value (US$ Million) & Volume (Units) Trend Analysis By Market Taxonomy, 2019 to 2023

    14.2. Market Size Value (US$ Million) & Volume (Units) Forecast By Market Taxonomy, 2024 to 2034

        14.2.1. By Country

            14.2.1.1. Australia

            14.2.1.2. New Zealand

        14.2.2. By Power Output

        14.2.3. By Drive Type

        14.2.4. By Equipment Type

    14.3. Market Attractiveness Analysis

        14.3.1. By Country

        14.3.2. By Power Output

        14.3.3. By Drive Type

        14.3.4. By Equipment Type

    14.4. Key Takeaways

15. MEA Market Analysis 2019 to 2023 and Forecast 2024 to 2034, By Country

    15.1. Historical Market Size Value (US$ Million) & Volume (Units) Trend Analysis By Market Taxonomy, 2019 to 2023

    15.2. Market Size Value (US$ Million) & Volume (Units) Forecast By Market Taxonomy, 2024 to 2034

        15.2.1. By Country

            15.2.1.1. GCC

            15.2.1.2. Rest of MEA

        15.2.2. By Power Output

        15.2.3. By Drive Type

        15.2.4. By Equipment Type

    15.3. Market Attractiveness Analysis

        15.3.1. By Country

        15.3.2. By Power Output

        15.3.3. By Drive Type

        15.3.4. By Equipment Type

    15.4. Key Takeaways

16. Key Countries Market Analysis

    16.1. USA

        16.1.1. Pricing Analysis

        16.1.2. Market Share Analysis, 2023

            16.1.2.1. By Power Output

            16.1.2.2. By Drive Type

            16.1.2.3. By Equipment Type

    16.2. Canada

        16.2.1. Pricing Analysis

        16.2.2. Market Share Analysis, 2023

            16.2.2.1. By Power Output

            16.2.2.2. By Drive Type

            16.2.2.3. By Equipment Type

    16.3. Brazil

        16.3.1. Pricing Analysis

        16.3.2. Market Share Analysis, 2023

            16.3.2.1. By Power Output

            16.3.2.2. By Drive Type

            16.3.2.3. By Equipment Type

    16.4. Mexico

        16.4.1. Pricing Analysis

        16.4.2. Market Share Analysis, 2023

            16.4.2.1. By Power Output

            16.4.2.2. By Drive Type

            16.4.2.3. By Equipment Type

    16.5. Argentina

        16.5.1. Pricing Analysis

        16.5.2. Market Share Analysis, 2023

            16.5.2.1. By Power Output

            16.5.2.2. By Drive Type

            16.5.2.3. By Equipment Type

    16.6. Germany

        16.6.1. Pricing Analysis

        16.6.2. Market Share Analysis, 2023

            16.6.2.1. By Power Output

            16.6.2.2. By Drive Type

            16.6.2.3. By Equipment Type

    16.7. Italy

        16.7.1. Pricing Analysis

        16.7.2. Market Share Analysis, 2023

            16.7.2.1. By Power Output

            16.7.2.2. By Drive Type

            16.7.2.3. By Equipment Type

    16.8. France

        16.8.1. Pricing Analysis

        16.8.2. Market Share Analysis, 2023

            16.8.2.1. By Power Output

            16.8.2.2. By Drive Type

            16.8.2.3. By Equipment Type

    16.9. UK

        16.9.1. Pricing Analysis

        16.9.2. Market Share Analysis, 2023

            16.9.2.1. By Power Output

            16.9.2.2. By Drive Type

            16.9.2.3. By Equipment Type

    16.10. Spain

        16.10.1. Pricing Analysis

        16.10.2. Market Share Analysis, 2023

            16.10.2.1. By Power Output

            16.10.2.2. By Drive Type

            16.10.2.3. By Equipment Type

    16.11. Russia

        16.11.1. Pricing Analysis

        16.11.2. Market Share Analysis, 2023

            16.11.2.1. By Power Output

            16.11.2.2. By Drive Type

            16.11.2.3. By Equipment Type

    16.12. BENELUX

        16.12.1. Pricing Analysis

        16.12.2. Market Share Analysis, 2023

            16.12.2.1. By Power Output

            16.12.2.2. By Drive Type

            16.12.2.3. By Equipment Type

    16.13. China

        16.13.1. Pricing Analysis

        16.13.2. Market Share Analysis, 2023

            16.13.2.1. By Power Output

            16.13.2.2. By Drive Type

            16.13.2.3. By Equipment Type

    16.14. Japan

        16.14.1. Pricing Analysis

        16.14.2. Market Share Analysis, 2023

            16.14.2.1. By Power Output

            16.14.2.2. By Drive Type

            16.14.2.3. By Equipment Type

    16.15. South Korea

        16.15.1. Pricing Analysis

        16.15.2. Market Share Analysis, 2023

            16.15.2.1. By Power Output

            16.15.2.2. By Drive Type

            16.15.2.3. By Equipment Type

    16.16. India

        16.16.1. Pricing Analysis

        16.16.2. Market Share Analysis, 2023

            16.16.2.1. By Power Output

            16.16.2.2. By Drive Type

            16.16.2.3. By Equipment Type

    16.17. Thailand

        16.17.1. Pricing Analysis

        16.17.2. Market Share Analysis, 2023

            16.17.2.1. By Power Output

            16.17.2.2. By Drive Type

            16.17.2.3. By Equipment Type

    16.18. Malaysia

        16.18.1. Pricing Analysis

        16.18.2. Market Share Analysis, 2023

            16.18.2.1. By Power Output

            16.18.2.2. By Drive Type

            16.18.2.3. By Equipment Type

    16.19. Indonesia

        16.19.1. Pricing Analysis

        16.19.2. Market Share Analysis, 2023

            16.19.2.1. By Power Output

            16.19.2.2. By Drive Type

            16.19.2.3. By Equipment Type

    16.20. Australia

        16.20.1. Pricing Analysis

        16.20.2. Market Share Analysis, 2023

            16.20.2.1. By Power Output

            16.20.2.2. By Drive Type

            16.20.2.3. By Equipment Type

    16.21. New Zealand

        16.21.1. Pricing Analysis

        16.21.2. Market Share Analysis, 2023

            16.21.2.1. By Power Output

            16.21.2.2. By Drive Type

            16.21.2.3. By Equipment Type

    16.22. GCC Countries

        16.22.1. Pricing Analysis

        16.22.2. Market Share Analysis, 2023

            16.22.2.1. By Power Output

            16.22.2.2. By Drive Type

            16.22.2.3. By Equipment Type

17. Market Structure Analysis

    17.1. Competition Dashboard

    17.2. Competition Benchmarking

    17.3. Market Share Analysis of Top Players

        17.3.1. By Regional

        17.3.2. By Power Output

        17.3.3. By Drive Type

        17.3.4. By Equipment Type

18. Competition Analysis

    18.1. Competition Deep Dive

        18.1.1. ARGO SpA

            18.1.1.1. Overview

            18.1.1.2. Product Portfolio

            18.1.1.3. Profitability by Market Segments

            18.1.1.4. Sales Footprint

            18.1.1.5. Strategy Overview

                18.1.1.5.1. Marketing Strategy

                18.1.1.5.2. Product Strategy

                18.1.1.5.3. Channel Strategy

        18.1.2. AGCO Corp

            18.1.2.1. Overview

            18.1.2.2. Product Portfolio

            18.1.2.3. Profitability by Market Segments

            18.1.2.4. Sales Footprint

            18.1.2.5. Strategy Overview

                18.1.2.5.1. Marketing Strategy

                18.1.2.5.2. Product Strategy

                18.1.2.5.3. Channel Strategy

        18.1.3. Foton Lovol International Heavy Industries Company Ltd

            18.1.3.1. Overview

            18.1.3.2. Product Portfolio

            18.1.3.3. Profitability by Market Segments

            18.1.3.4. Sales Footprint

            18.1.3.5. Strategy Overview

                18.1.3.5.1. Marketing Strategy

                18.1.3.5.2. Product Strategy

                18.1.3.5.3. Channel Strategy

        18.1.4. Kuhn Group

            18.1.4.1. Overview

            18.1.4.2. Product Portfolio

            18.1.4.3. Profitability by Market Segments

            18.1.4.4. Sales Footprint

            18.1.4.5. Strategy Overview

                18.1.4.5.1. Marketing Strategy

                18.1.4.5.2. Product Strategy

                18.1.4.5.3. Channel Strategy

        18.1.5. Kubota Tractor Corp

            18.1.5.1. Overview

            18.1.5.2. Product Portfolio

            18.1.5.3. Profitability by Market Segments

            18.1.5.4. Sales Footprint

            18.1.5.5. Strategy Overview

                18.1.5.5.1. Marketing Strategy

                18.1.5.5.2. Product Strategy

                18.1.5.5.3. Channel Strategy

        18.1.6. Mahindra & Mahindra Ltd.

            18.1.6.1. Overview

            18.1.6.2. Product Portfolio

            18.1.6.3. Profitability by Market Segments

            18.1.6.4. Sales Footprint

            18.1.6.5. Strategy Overview

                18.1.6.5.1. Marketing Strategy

                18.1.6.5.2. Product Strategy

                18.1.6.5.3. Channel Strategy

        18.1.7. Landini

            18.1.7.1. Overview

            18.1.7.2. Product Portfolio

            18.1.7.3. Profitability by Market Segments

            18.1.7.4. Sales Footprint

            18.1.7.5. Strategy Overview

                18.1.7.5.1. Marketing Strategy

                18.1.7.5.2. Product Strategy

                18.1.7.5.3. Channel Strategy

        18.1.8. Netafim Limited

            18.1.8.1. Overview

            18.1.8.2. Product Portfolio

            18.1.8.3. Profitability by Market Segments

            18.1.8.4. Sales Footprint

            18.1.8.5. Strategy Overview

                18.1.8.5.1. Marketing Strategy

                18.1.8.5.2. Product Strategy

                18.1.8.5.3. Channel Strategy

        18.1.9. Valmont Industries Incorporated

            18.1.9.1. Overview

            18.1.9.2. Product Portfolio

            18.1.9.3. Profitability by Market Segments

            18.1.9.4. Sales Footprint

            18.1.9.5. Strategy Overview

                18.1.9.5.1. Marketing Strategy

                18.1.9.5.2. Product Strategy

                18.1.9.5.3. Channel Strategy

        18.1.10. Alamo Group Incorporated

            18.1.10.1. Overview

            18.1.10.2. Product Portfolio

            18.1.10.3. Profitability by Market Segments

            18.1.10.4. Sales Footprint

            18.1.10.5. Strategy Overview

                18.1.10.5.1. Marketing Strategy

                18.1.10.5.2. Product Strategy

                18.1.10.5.3. Channel Strategy

19. Assumptions & Acronyms Used

20. Research Methodology

List of Tables

Table 1: Global Market Value (US$ Million) Forecast by Region, 2019 to 2034

Table 2: Global Market Volume (Units) Forecast by Region, 2019 to 2034

Table 3: Global Market Value (US$ Million) Forecast by Power Output, 2019 to 2034

Table 4: Global Market Volume (Units) Forecast by Power Output, 2019 to 2034

Table 5: Global Market Value (US$ Million) Forecast by Drive Type, 2019 to 2034

Table 6: Global Market Volume (Units) Forecast by Drive Type, 2019 to 2034

Table 7: Global Market Value (US$ Million) Forecast by Equipment Type, 2019 to 2034

Table 8: Global Market Volume (Units) Forecast by Equipment Type, 2019 to 2034

Table 9: North America Market Value (US$ Million) Forecast by Country, 2019 to 2034

Table 10: North America Market Volume (Units) Forecast by Country, 2019 to 2034

Table 11: North America Market Value (US$ Million) Forecast by Power Output, 2019 to 2034

Table 12: North America Market Volume (Units) Forecast by Power Output, 2019 to 2034

Table 13: North America Market Value (US$ Million) Forecast by Drive Type, 2019 to 2034

Table 14: North America Market Volume (Units) Forecast by Drive Type, 2019 to 2034

Table 15: North America Market Value (US$ Million) Forecast by Equipment Type, 2019 to 2034

Table 16: North America Market Volume (Units) Forecast by Equipment Type, 2019 to 2034

Table 17: Latin America Market Value (US$ Million) Forecast by Country, 2019 to 2034

Table 18: Latin America Market Volume (Units) Forecast by Country, 2019 to 2034

Table 19: Latin America Market Value (US$ Million) Forecast by Power Output, 2019 to 2034

Table 20: Latin America Market Volume (Units) Forecast by Power Output, 2019 to 2034

Table 21: Latin America Market Value (US$ Million) Forecast by Drive Type, 2019 to 2034

Table 22: Latin America Market Volume (Units) Forecast by Drive Type, 2019 to 2034

Table 23: Latin America Market Value (US$ Million) Forecast by Equipment Type, 2019 to 2034

Table 24: Latin America Market Volume (Units) Forecast by Equipment Type, 2019 to 2034

Table 25: Europe Market Value (US$ Million) Forecast by Country, 2019 to 2034

Table 26: Europe Market Volume (Units) Forecast by Country, 2019 to 2034

Table 27: Europe Market Value (US$ Million) Forecast by Power Output, 2019 to 2034

Table 28: Europe Market Volume (Units) Forecast by Power Output, 2019 to 2034

Table 29: Europe Market Value (US$ Million) Forecast by Drive Type, 2019 to 2034

Table 30: Europe Market Volume (Units) Forecast by Drive Type, 2019 to 2034

Table 31: Europe Market Value (US$ Million) Forecast by Equipment Type, 2019 to 2034

Table 32: Europe Market Volume (Units) Forecast by Equipment Type, 2019 to 2034

Table 33: East Asia Market Value (US$ Million) Forecast by Country, 2019 to 2034

Table 34: East Asia Market Volume (Units) Forecast by Country, 2019 to 2034

Table 35: East Asia Market Value (US$ Million) Forecast by Power Output, 2019 to 2034

Table 36: East Asia Market Volume (Units) Forecast by Power Output, 2019 to 2034

Table 37: East Asia Market Value (US$ Million) Forecast by Drive Type, 2019 to 2034

Table 38: East Asia Market Volume (Units) Forecast by Drive Type, 2019 to 2034

Table 39: East Asia Market Value (US$ Million) Forecast by Equipment Type, 2019 to 2034

Table 40: East Asia Market Volume (Units) Forecast by Equipment Type, 2019 to 2034

Table 41: South Asia Market Value (US$ Million) Forecast by Country, 2019 to 2034

Table 42: South Asia Market Volume (Units) Forecast by Country, 2019 to 2034

Table 43: South Asia Market Value (US$ Million) Forecast by Power Output, 2019 to 2034

Table 44: South Asia Market Volume (Units) Forecast by Power Output, 2019 to 2034

Table 45: South Asia Market Value (US$ Million) Forecast by Drive Type, 2019 to 2034

Table 46: South Asia Market Volume (Units) Forecast by Drive Type, 2019 to 2034

Table 47: South Asia Market Value (US$ Million) Forecast by Equipment Type, 2019 to 2034

Table 48: South Asia Market Volume (Units) Forecast by Equipment Type, 2019 to 2034

Table 49: Oceania Market Value (US$ Million) Forecast by Country, 2019 to 2034

Table 50: Oceania Market Volume (Units) Forecast by Country, 2019 to 2034

Table 51: Oceania Market Value (US$ Million) Forecast by Power Output, 2019 to 2034

Table 52: Oceania Market Volume (Units) Forecast by Power Output, 2019 to 2034

Table 53: Oceania Market Value (US$ Million) Forecast by Drive Type, 2019 to 2034

Table 54: Oceania Market Volume (Units) Forecast by Drive Type, 2019 to 2034

Table 55: Oceania Market Value (US$ Million) Forecast by Equipment Type, 2019 to 2034

Table 56: Oceania Market Volume (Units) Forecast by Equipment Type, 2019 to 2034

Table 57: MEA Market Value (US$ Million) Forecast by Country, 2019 to 2034

Table 58: MEA Market Volume (Units) Forecast by Country, 2019 to 2034

Table 59: MEA Market Value (US$ Million) Forecast by Power Output, 2019 to 2034

Table 60: MEA Market Volume (Units) Forecast by Power Output, 2019 to 2034

Table 61: MEA Market Value (US$ Million) Forecast by Drive Type, 2019 to 2034

Table 62: MEA Market Volume (Units) Forecast by Drive Type, 2019 to 2034

Table 63: MEA Market Value (US$ Million) Forecast by Equipment Type, 2019 to 2034

Table 64: MEA Market Volume (Units) Forecast by Equipment Type, 2019 to 2034

List of Charts

Figure 1: Global Market Value (US$ Million) by Power Output, 2024 to 2034

Figure 2: Global Market Value (US$ Million) by Drive Type, 2024 to 2034

Figure 3: Global Market Value (US$ Million) by Equipment Type, 2024 to 2034

Figure 4: Global Market Value (US$ Million) by Region, 2024 to 2034

Figure 5: Global Market Value (US$ Million) Analysis by Region, 2019 to 2034

Figure 6: Global Market Volume (Units) Analysis by Region, 2019 to 2034

Figure 7: Global Market Value Share (%) and BPS Analysis by Region, 2024 to 2034

Figure 8: Global Market Y-o-Y Growth (%) Projections by Region, 2024 to 2034

Figure 9: Global Market Value (US$ Million) Analysis by Power Output, 2019 to 2034

Figure 10: Global Market Volume (Units) Analysis by Power Output, 2019 to 2034

Figure 11: Global Market Value Share (%) and BPS Analysis by Power Output, 2024 to 2034

Figure 12: Global Market Y-o-Y Growth (%) Projections by Power Output, 2024 to 2034

Figure 13: Global Market Value (US$ Million) Analysis by Drive Type, 2019 to 2034

Figure 14: Global Market Volume (Units) Analysis by Drive Type, 2019 to 2034

Figure 15: Global Market Value Share (%) and BPS Analysis by Drive Type, 2024 to 2034

Figure 16: Global Market Y-o-Y Growth (%) Projections by Drive Type, 2024 to 2034

Figure 17: Global Market Value (US$ Million) Analysis by Equipment Type, 2019 to 2034

Figure 18: Global Market Volume (Units) Analysis by Equipment Type, 2019 to 2034

Figure 19: Global Market Value Share (%) and BPS Analysis by Equipment Type, 2024 to 2034

Figure 20: Global Market Y-o-Y Growth (%) Projections by Equipment Type, 2024 to 2034

Figure 21: Global Market Attractiveness by Power Output, 2024 to 2034

Figure 22: Global Market Attractiveness by Drive Type, 2024 to 2034

Figure 23: Global Market Attractiveness by Equipment Type, 2024 to 2034

Figure 24: Global Market Attractiveness by Region, 2024 to 2034

Figure 25: North America Market Value (US$ Million) by Power Output, 2024 to 2034

Figure 26: North America Market Value (US$ Million) by Drive Type, 2024 to 2034

Figure 27: North America Market Value (US$ Million) by Equipment Type, 2024 to 2034

Figure 28: North America Market Value (US$ Million) by Country, 2024 to 2034

Figure 29: North America Market Value (US$ Million) Analysis by Country, 2019 to 2034

Figure 30: North America Market Volume (Units) Analysis by Country, 2019 to 2034

Figure 31: North America Market Value Share (%) and BPS Analysis by Country, 2024 to 2034

Figure 32: North America Market Y-o-Y Growth (%) Projections by Country, 2024 to 2034

Figure 33: North America Market Value (US$ Million) Analysis by Power Output, 2019 to 2034

Figure 34: North America Market Volume (Units) Analysis by Power Output, 2019 to 2034

Figure 35: North America Market Value Share (%) and BPS Analysis by Power Output, 2024 to 2034

Figure 36: North America Market Y-o-Y Growth (%) Projections by Power Output, 2024 to 2034

Figure 37: North America Market Value (US$ Million) Analysis by Drive Type, 2019 to 2034

Figure 38: North America Market Volume (Units) Analysis by Drive Type, 2019 to 2034

Figure 39: North America Market Value Share (%) and BPS Analysis by Drive Type, 2024 to 2034

Figure 40: North America Market Y-o-Y Growth (%) Projections by Drive Type, 2024 to 2034

Figure 41: North America Market Value (US$ Million) Analysis by Equipment Type, 2019 to 2034

Figure 42: North America Market Volume (Units) Analysis by Equipment Type, 2019 to 2034

Figure 43: North America Market Value Share (%) and BPS Analysis by Equipment Type, 2024 to 2034

Figure 44: North America Market Y-o-Y Growth (%) Projections by Equipment Type, 2024 to 2034

Figure 45: North America Market Attractiveness by Power Output, 2024 to 2034

Figure 46: North America Market Attractiveness by Drive Type, 2024 to 2034

Figure 47: North America Market Attractiveness by Equipment Type, 2024 to 2034

Figure 48: North America Market Attractiveness by Country, 2024 to 2034

Figure 49: Latin America Market Value (US$ Million) by Power Output, 2024 to 2034

Figure 50: Latin America Market Value (US$ Million) by Drive Type, 2024 to 2034

Figure 51: Latin America Market Value (US$ Million) by Equipment Type, 2024 to 2034

Figure 52: Latin America Market Value (US$ Million) by Country, 2024 to 2034

Figure 53: Latin America Market Value (US$ Million) Analysis by Country, 2019 to 2034

Figure 54: Latin America Market Volume (Units) Analysis by Country, 2019 to 2034

Figure 55: Latin America Market Value Share (%) and BPS Analysis by Country, 2024 to 2034

Figure 56: Latin America Market Y-o-Y Growth (%) Projections by Country, 2024 to 2034

Figure 57: Latin America Market Value (US$ Million) Analysis by Power Output, 2019 to 2034

Figure 58: Latin America Market Volume (Units) Analysis by Power Output, 2019 to 2034

Figure 59: Latin America Market Value Share (%) and BPS Analysis by Power Output, 2024 to 2034

Figure 60: Latin America Market Y-o-Y Growth (%) Projections by Power Output, 2024 to 2034

Figure 61: Latin America Market Value (US$ Million) Analysis by Drive Type, 2019 to 2034

Figure 62: Latin America Market Volume (Units) Analysis by Drive Type, 2019 to 2034

Figure 63: Latin America Market Value Share (%) and BPS Analysis by Drive Type, 2024 to 2034

Figure 64: Latin America Market Y-o-Y Growth (%) Projections by Drive Type, 2024 to 2034

Figure 65: Latin America Market Value (US$ Million) Analysis by Equipment Type, 2019 to 2034

Figure 66: Latin America Market Volume (Units) Analysis by Equipment Type, 2019 to 2034

Figure 67: Latin America Market Value Share (%) and BPS Analysis by Equipment Type, 2024 to 2034

Figure 68: Latin America Market Y-o-Y Growth (%) Projections by Equipment Type, 2024 to 2034

Figure 69: Latin America Market Attractiveness by Power Output, 2024 to 2034

Figure 70: Latin America Market Attractiveness by Drive Type, 2024 to 2034

Figure 71: Latin America Market Attractiveness by Equipment Type, 2024 to 2034

Figure 72: Latin America Market Attractiveness by Country, 2024 to 2034

Figure 73: Europe Market Value (US$ Million) by Power Output, 2024 to 2034

Figure 74: Europe Market Value (US$ Million) by Drive Type, 2024 to 2034

Figure 75: Europe Market Value (US$ Million) by Equipment Type, 2024 to 2034

Figure 76: Europe Market Value (US$ Million) by Country, 2024 to 2034

Figure 77: Europe Market Value (US$ Million) Analysis by Country, 2019 to 2034

Figure 78: Europe Market Volume (Units) Analysis by Country, 2019 to 2034

Figure 79: Europe Market Value Share (%) and BPS Analysis by Country, 2024 to 2034

Figure 80: Europe Market Y-o-Y Growth (%) Projections by Country, 2024 to 2034

Figure 81: Europe Market Value (US$ Million) Analysis by Power Output, 2019 to 2034

Figure 82: Europe Market Volume (Units) Analysis by Power Output, 2019 to 2034

Figure 83: Europe Market Value Share (%) and BPS Analysis by Power Output, 2024 to 2034

Figure 84: Europe Market Y-o-Y Growth (%) Projections by Power Output, 2024 to 2034

Figure 85: Europe Market Value (US$ Million) Analysis by Drive Type, 2019 to 2034

Figure 86: Europe Market Volume (Units) Analysis by Drive Type, 2019 to 2034

Figure 87: Europe Market Value Share (%) and BPS Analysis by Drive Type, 2024 to 2034

Figure 88: Europe Market Y-o-Y Growth (%) Projections by Drive Type, 2024 to 2034

Figure 89: Europe Market Value (US$ Million) Analysis by Equipment Type, 2019 to 2034

Figure 90: Europe Market Volume (Units) Analysis by Equipment Type, 2019 to 2034

Figure 91: Europe Market Value Share (%) and BPS Analysis by Equipment Type, 2024 to 2034

Figure 92: Europe Market Y-o-Y Growth (%) Projections by Equipment Type, 2024 to 2034

Figure 93: Europe Market Attractiveness by Power Output, 2024 to 2034

Figure 94: Europe Market Attractiveness by Drive Type, 2024 to 2034

Figure 95: Europe Market Attractiveness by Equipment Type, 2024 to 2034

Figure 96: Europe Market Attractiveness by Country, 2024 to 2034

Figure 97: East Asia Market Value (US$ Million) by Power Output, 2024 to 2034

Figure 98: East Asia Market Value (US$ Million) by Drive Type, 2024 to 2034

Figure 99: East Asia Market Value (US$ Million) by Equipment Type, 2024 to 2034

Figure 100: East Asia Market Value (US$ Million) by Country, 2024 to 2034

Figure 101: East Asia Market Value (US$ Million) Analysis by Country, 2019 to 2034

Figure 102: East Asia Market Volume (Units) Analysis by Country, 2019 to 2034

Figure 103: East Asia Market Value Share (%) and BPS Analysis by Country, 2024 to 2034

Figure 104: East Asia Market Y-o-Y Growth (%) Projections by Country, 2024 to 2034

Figure 105: East Asia Market Value (US$ Million) Analysis by Power Output, 2019 to 2034

Figure 106: East Asia Market Volume (Units) Analysis by Power Output, 2019 to 2034

Figure 107: East Asia Market Value Share (%) and BPS Analysis by Power Output, 2024 to 2034

Figure 108: East Asia Market Y-o-Y Growth (%) Projections by Power Output, 2024 to 2034

Figure 109: East Asia Market Value (US$ Million) Analysis by Drive Type, 2019 to 2034

Figure 110: East Asia Market Volume (Units) Analysis by Drive Type, 2019 to 2034

Figure 111: East Asia Market Value Share (%) and BPS Analysis by Drive Type, 2024 to 2034

Figure 112: East Asia Market Y-o-Y Growth (%) Projections by Drive Type, 2024 to 2034

Figure 113: East Asia Market Value (US$ Million) Analysis by Equipment Type, 2019 to 2034

Figure 114: East Asia Market Volume (Units) Analysis by Equipment Type, 2019 to 2034

Figure 115: East Asia Market Value Share (%) and BPS Analysis by Equipment Type, 2024 to 2034

Figure 116: East Asia Market Y-o-Y Growth (%) Projections by Equipment Type, 2024 to 2034

Figure 117: East Asia Market Attractiveness by Power Output, 2024 to 2034

Figure 118: East Asia Market Attractiveness by Drive Type, 2024 to 2034

Figure 119: East Asia Market Attractiveness by Equipment Type, 2024 to 2034

Figure 120: East Asia Market Attractiveness by Country, 2024 to 2034

Figure 121: South Asia Market Value (US$ Million) by Power Output, 2024 to 2034

Figure 122: South Asia Market Value (US$ Million) by Drive Type, 2024 to 2034

Figure 123: South Asia Market Value (US$ Million) by Equipment Type, 2024 to 2034

Figure 124: South Asia Market Value (US$ Million) by Country, 2024 to 2034

Figure 125: South Asia Market Value (US$ Million) Analysis by Country, 2019 to 2034

Figure 126: South Asia Market Volume (Units) Analysis by Country, 2019 to 2034

Figure 127: South Asia Market Value Share (%) and BPS Analysis by Country, 2024 to 2034

Figure 128: South Asia Market Y-o-Y Growth (%) Projections by Country, 2024 to 2034

Figure 129: South Asia Market Value (US$ Million) Analysis by Power Output, 2019 to 2034

Figure 130: South Asia Market Volume (Units) Analysis by Power Output, 2019 to 2034

Figure 131: South Asia Market Value Share (%) and BPS Analysis by Power Output, 2024 to 2034

Figure 132: South Asia Market Y-o-Y Growth (%) Projections by Power Output, 2024 to 2034

Figure 133: South Asia Market Value (US$ Million) Analysis by Drive Type, 2019 to 2034

Figure 134: South Asia Market Volume (Units) Analysis by Drive Type, 2019 to 2034

Figure 135: South Asia Market Value Share (%) and BPS Analysis by Drive Type, 2024 to 2034

Figure 136: South Asia Market Y-o-Y Growth (%) Projections by Drive Type, 2024 to 2034

Figure 137: South Asia Market Value (US$ Million) Analysis by Equipment Type, 2019 to 2034

Figure 138: South Asia Market Volume (Units) Analysis by Equipment Type, 2019 to 2034

Figure 139: South Asia Market Value Share (%) and BPS Analysis by Equipment Type, 2024 to 2034

Figure 140: South Asia Market Y-o-Y Growth (%) Projections by Equipment Type, 2024 to 2034

Figure 141: South Asia Market Attractiveness by Power Output, 2024 to 2034

Figure 142: South Asia Market Attractiveness by Drive Type, 2024 to 2034

Figure 143: South Asia Market Attractiveness by Equipment Type, 2024 to 2034

Figure 144: South Asia Market Attractiveness by Country, 2024 to 2034

Figure 145: Oceania Market Value (US$ Million) by Power Output, 2024 to 2034

Figure 146: Oceania Market Value (US$ Million) by Drive Type, 2024 to 2034

Figure 147: Oceania Market Value (US$ Million) by Equipment Type, 2024 to 2034

Figure 148: Oceania Market Value (US$ Million) by Country, 2024 to 2034

Figure 149: Oceania Market Value (US$ Million) Analysis by Country, 2019 to 2034

Figure 150: Oceania Market Volume (Units) Analysis by Country, 2019 to 2034

Figure 151: Oceania Market Value Share (%) and BPS Analysis by Country, 2024 to 2034

Figure 152: Oceania Market Y-o-Y Growth (%) Projections by Country, 2024 to 2034

Figure 153: Oceania Market Value (US$ Million) Analysis by Power Output, 2019 to 2034

Figure 154: Oceania Market Volume (Units) Analysis by Power Output, 2019 to 2034

Figure 155: Oceania Market Value Share (%) and BPS Analysis by Power Output, 2024 to 2034

Figure 156: Oceania Market Y-o-Y Growth (%) Projections by Power Output, 2024 to 2034

Figure 157: Oceania Market Value (US$ Million) Analysis by Drive Type, 2019 to 2034

Figure 158: Oceania Market Volume (Units) Analysis by Drive Type, 2019 to 2034

Figure 159: Oceania Market Value Share (%) and BPS Analysis by Drive Type, 2024 to 2034

Figure 160: Oceania Market Y-o-Y Growth (%) Projections by Drive Type, 2024 to 2034

Figure 161: Oceania Market Value (US$ Million) Analysis by Equipment Type, 2019 to 2034

Figure 162: Oceania Market Volume (Units) Analysis by Equipment Type, 2019 to 2034

Figure 163: Oceania Market Value Share (%) and BPS Analysis by Equipment Type, 2024 to 2034

Figure 164: Oceania Market Y-o-Y Growth (%) Projections by Equipment Type, 2024 to 2034

Figure 165: Oceania Market Attractiveness by Power Output, 2024 to 2034

Figure 166: Oceania Market Attractiveness by Drive Type, 2024 to 2034

Figure 167: Oceania Market Attractiveness by Equipment Type, 2024 to 2034

Figure 168: Oceania Market Attractiveness by Country, 2024 to 2034

Figure 169: MEA Market Value (US$ Million) by Power Output, 2024 to 2034

Figure 170: MEA Market Value (US$ Million) by Drive Type, 2024 to 2034

Figure 171: MEA Market Value (US$ Million) by Equipment Type, 2024 to 2034

Figure 172: MEA Market Value (US$ Million) by Country, 2024 to 2034

Figure 173: MEA Market Value (US$ Million) Analysis by Country, 2019 to 2034

Figure 174: MEA Market Volume (Units) Analysis by Country, 2019 to 2034

Figure 175: MEA Market Value Share (%) and BPS Analysis by Country, 2024 to 2034

Figure 176: MEA Market Y-o-Y Growth (%) Projections by Country, 2024 to 2034

Figure 177: MEA Market Value (US$ Million) Analysis by Power Output, 2019 to 2034

Figure 178: MEA Market Volume (Units) Analysis by Power Output, 2019 to 2034

Figure 179: MEA Market Value Share (%) and BPS Analysis by Power Output, 2024 to 2034

Figure 180: MEA Market Y-o-Y Growth (%) Projections by Power Output, 2024 to 2034

Figure 181: MEA Market Value (US$ Million) Analysis by Drive Type, 2019 to 2034

Figure 182: MEA Market Volume (Units) Analysis by Drive Type, 2019 to 2034

Figure 183: MEA Market Value Share (%) and BPS Analysis by Drive Type, 2024 to 2034

Figure 184: MEA Market Y-o-Y Growth (%) Projections by Drive Type, 2024 to 2034

Figure 185: MEA Market Value (US$ Million) Analysis by Equipment Type, 2019 to 2034

Figure 186: MEA Market Volume (Units) Analysis by Equipment Type, 2019 to 2034

Figure 187: MEA Market Value Share (%) and BPS Analysis by Equipment Type, 2024 to 2034

Figure 188: MEA Market Y-o-Y Growth (%) Projections by Equipment Type, 2024 to 2034

Figure 189: MEA Market Attractiveness by Power Output, 2024 to 2034

Figure 190: MEA Market Attractiveness by Drive Type, 2024 to 2034

Figure 191: MEA Market Attractiveness by Equipment Type, 2024 to 2034

Figure 192: MEA Market Attractiveness by Country, 2024 to 2034

Recommendations

Process Automation

Horse Drawn Farming Equipment Market

Published : January 2023

Food and Beverage

Poultry Farming Equipment Market

Published : December 2022

Explore Process Automation Insights

View Reports