Farm Tire Market Size, Share & Forecast Outlook 2025 to 2035

The global farm tire market is projected to grow from USD 9 billion in 2025 to USD 15.9 billion by 2035, registering a CAGR of 5.9% during the forecast period.
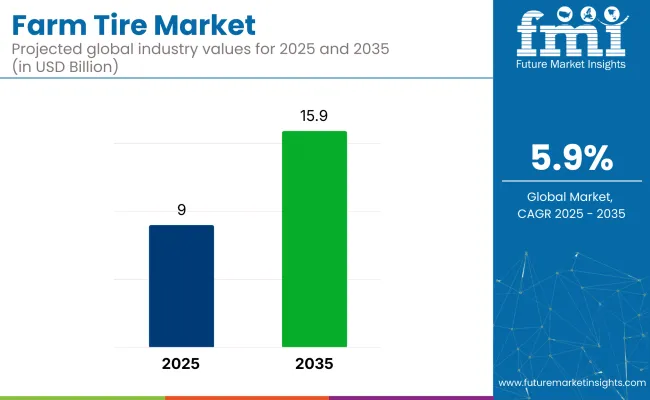
Quick Stats of the Farm Tire Market

  • Market Value (2025): USD 9 billion
  • Industry Forecast Value (2035): USD 15.9 billion
  • Global CAGR: 5.9%
  • Leading Segment in 2035: Radial tires(65% share)
  • Key Growth Region: Asia Pacific (India)
  • Key Players: Balkrishna Industries Limited (BKT), Bridgestone Corporation, Michelin, Continental AG, and Titan International Inc.

Farm Tire Market

Growth is being driven by increased mechanization in agriculture. The rising demand for durable and high-performance tires is further accelerating industry expansion. Agricultural activities are being expanded globally, boosting demand for specialized tires. The need for improved efficiency, reduced soil compaction, and enhanced traction in farming operations is fueling adoption of advanced tire technologies.

The industry holds a specialized share within its parent markets. In the tire market, it accounts for approximately 3-4%, as these tires are just one category within the larger tire industry. Within the agricultural equipment market, the share is higher, around 10-12%, driven by the essential role of tires in agricultural machinery like tractors, harvesters, and plows.

In the broader automotive and transportation market, these tires represent around 1-2%, as they are used specifically for agricultural vehicles. In the construction and mining equipment market, these tires make up approximately 2-3%, as they are similar to off-road tires used in heavy machinery. Within the rubber and plastics market, farm tires contribute about 2-3%, being a part of the overall tire manufacturing sector.

In a recent interview, Thom Clark, President of Ascenso Tires North America, discussed the challenges in the farm tire market, stating, “With less government financial support, farmers are feeling more pressure to save where they can.” This highlights the financial strain on farmers, making them more cautious in their purchasing decisions, particularly in the industry, where cost-saving measures are becoming increasingly important due to reduced government assistance.

Analyzing Farm Tire Market by Top Investment Segments

The industry is being shaped by investments in radial tire manufacturing and tractor-based applications, driven by agricultural automation, fuel efficiency, and soil conservation needs. Radial tires are expected to capture 65% of the industry share, while tractors will hold 40%, and OEMs will dominate the distribution channel with 55-60% share in 2025.

Radial tires lead demand for farm tires by product type in 2025

Radial tires are projected to dominate the industry, capturing 65% of the industry share in 2025. Their superiority in traction, fuel savings, and reduced soil compaction has made them the preferred choice for modern farming. Companies like Michelin, Trelleborg, and Mitas are at the forefront of developing advanced radial tire systems, integrating digital pressure monitoring and innovative tread compounds.

These technological advancements are particularly beneficial for modern tractors used in plowing, tilling, and precision seeding. Radial tires are increasingly utilized in row crop and large-scale farming operations, where soil preservation is vital, enhancing their relevance in North America, Europe, and Asia-Pacific.
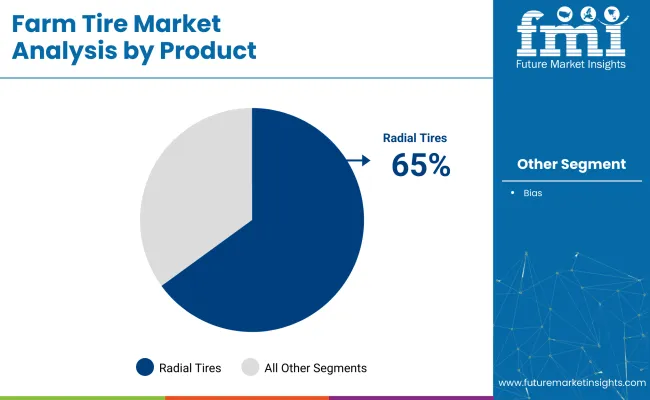
  • Superior traction, reduced soil compaction, and fuel efficiency
  • Innovations in smart radial tire systems improve performance in modern farming
  • Increasing adoption in large-scale farming operations focused on soil preservation

Farm Tire Market Analysis By Product

Tractors are likely to dominate with 40% industry share in 2025

Tractors are expected to remain the leading application for these tires, capturing 40% of the industry share in 2025. This is driven by rising farm mechanization, supported by government subsidies and rural modernization programs, particularly in emerging industries like India, Brazil, and China. Companies like BKT, CEAT, and Continental are manufacturing durable tires designed for a wide range of tractors, from compact to high-horsepower models.

These tires are engineered for improved load-bearing capacity, lateral stability, and tread longevity to handle both field and road conditions. The growing adoption of precision farming and high-horsepower tractors creates new demand for technologically advanced tires.
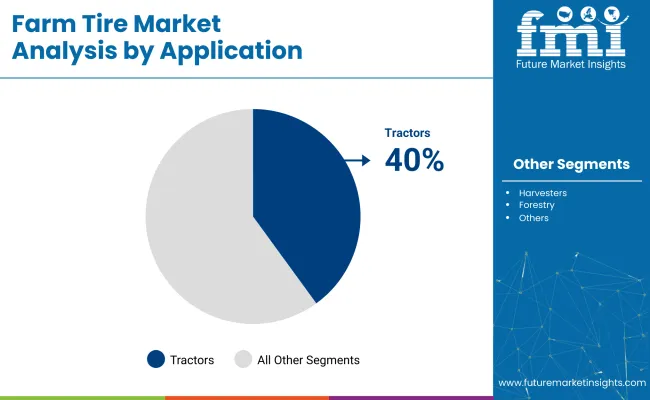
  • Driven by increasing farm mechanization and government support in emerging industries
  • Tires designed for a wide range of tractor types with enhanced durability
  • Demand for high-performance tires driven by precision farming and high-horsepower tractors

Farm Tire Market Analysis By Application

OEM distribution channel dominates with 55-60% industry share

The OEM distribution channel is projected to capture 55-60% of the industry share in 2025. OEMs supply tires as part of agricultural machinery, including tractors, harvesters, and sprayers. This channel holds a significant share due to its direct integration with machinery manufacturers, ensuring seamless tire supply to farmers.

OEMs offer specialized, durable tires tailored to the specific needs of various farming operations. The widespread adoption of mechanized farming, along with government support for agricultural infrastructure, further strengthens the OEM distribution channel’s dominance in the industry.

  • OEMs provide integrated tire solutions as part of agricultural machinery
  • Specialized tires designed to meet the unique needs of farming operations
  • Mechanized farming adoption and government support for agriculture bolster OEM dominance

Top Farm Tire Market Dynamics

The industry is growing due to increased agricultural mechanization, rising food demand, and technological advancements in tire design. However, high operational costs and complex regulatory challenges limit broader industry growth, particularly for small-scale farmers and in developing regions.

Increasing Mechanization and Demand for Food Are Driving Farm Tire Adoption

The global expansion of agricultural mechanization is significantly boosting the demand for specialized tires used in equipment like tractors, harvesters, and sprayers. This trend is driven by the growing global population and increasing food demand, which require more efficient and productive farming.

High-performance tires are essential for modern machinery, providing stability, durability, and improved performance in the field. The integration of advanced equipment is growing in both developed and emerging industries, enhancing the importance of these tires in agricultural operations.

  • Agricultural mechanization and the growing food demand are driving the adoption of advanced tires.
  • High-performance tires improve efficiency and performance in modern farming equipment.
  • The global rise in mechanized farming, especially in emerging industries, fuels the demand.

High Operational Costs and Regulatory Complexities Are Limiting Market Growth

The adoption of advanced technologies and specialized agricultural equipment is driving up operational costs, creating barriers for small and medium-sized farms. High costs limit access to modern tires and equipment, hindering widespread adoption.

Additionally, the complexity of complying with varying regional and international regulations on manufacturing, quality standards, and distribution raises expenses, further limiting industry penetration, particularly in developing countries. Overcoming these challenges with cost-reduction strategies and streamlined regulatory frameworks is vital for enhancing industry access and fostering sustainable growth.

  • High operational costs and specialized equipment pose barriers for small and medium-sized farms.
  • Regulatory challenges increase supply chain complexity and limit affordability.
  • Addressing cost and regulatory barriers is essential for broader adoption, particularly in developing regions.

Analyzing Top Countries Manufacturing, Distributing, and Supplying Farm Tires

The global industry demand is projected to rise at a 5.9% CAGR from 2025 to 2035. Of the five profiled markets out of 40 covered, India leads at 8%, followed by China at 7% and the United Kingdom at 5.5%, while the United States records 4.5% and Germany posts 3.5%. These rates translate to a growth premium of +35% for India, +19% for China, and -23% for Germany versus the baseline, whereas the United States and the United Kingdom show more moderate growth.

Divergence reflects local catalysts: increasing demand for mechanization in India, growth in agricultural technology and machinery adoption in China, steady demand in the UK, and slower growth driven by industry saturation in the USA and traditional farming practices in Germany.

Countries CAGR (2025 to 2035)
United States 4.5%
United Kingdom 5.5%
China 7%
India 8%
Germany 3.5%

Growth Analysis of Farm Tire Market in the United States

The industry in the United States is set to record a CAGR of 4.5% through 2035. Advancements in tire design for traction, flotation, and fuel efficiency have aligned with the evolution of precision agriculture. Firms such as Goodyear, Bridgestone, Michelin, and Alliance Tire Group have introduced radials and IF/VF tires to match high-horsepower equipment. Integration of smart tire technologies with telematics has expanded across Midwest and Southern states. Strong aftermarket distribution and OEM demand sustain volume.

  • Remote tire pressure monitoring is now embedded in Tier 1 tractors.
  • Dealer financing programs have increased the replacement cycle in grain-producing regions.
  • Supply chain partnerships between tire makers and equipment dealers are expanding.

Future Outlook for Farm Tire Market in the United Kingdom

Sales of these tires in the United Kingdom are projected to grow at a CAGR of 5.5% through 2035. Mechanization grants and efficiency-driven land management policies have increased the demand for advanced tire systems. Cold-weather compounds and low-compaction treads have been prioritized by brands like Michelin, Continental, and Trelleborg. Collaboration with agricultural universities has advanced field trials of new-generation tires. The push for automation in livestock and arable farms supports continued expansion.

  • OEM alignments with tire firms have boosted telematics-ready tire availability.
  • Multi-crop farms are adopting flotation tires for varied terrain performance.
  • Fuel-saving radial tire models are being tested under DEFRA-funded programs.

Demand Forecast for Farm Tire Market in China

Demand for these tires in China is estimated to grow at a CAGR of 7.0% through 2035. Strategic initiatives tied to the country’s rural revitalization plan have catalyzed mechanization and increased tire procurement. Domestic manufacturers such as ZC Rubber, Double Coin, and Linglong Tire have expanded rural dealer networks. Government funding tied to equipment renewal has increased IF tire installation in smart farming zones. Partnerships with European brands have added competitive pressure in high-end segments.

  • Radial tire adoption is rising in rice belt mechanization projects.
  • State incentives have driven tire sensor adoption in large fleet tractors.
  • Supply agreements are increasing between tire firms and state-owned agro-enterprises.

Analysis of Farm Tire Market in India

The industry in India is forecasted to grow at a CAGR of 8.0% through 2035.Tractorization under central schemes and higher awareness of tire lifespan have boosted demand in tier-2 and tier-3 rural industries. JK Tyre, MRF, Apollo, and BKT are scaling production of bias-ply and radial models tailored for variable field conditions. Increasing awareness of soil health and fuel economy is reinforcing the shift to low-pressure tires. State-level subsidy programs continue to expand procurement.

  • Entry-level tractor OEMs now bundle premium rear tires to attract rural buyers.
  • Low-compaction treads are being promoted in states with high paddy acreage.
  • Tele-advisory apps now include tire inflation and maintenance guidance.

Farm Tire Market Growth Outlook in Germany

The industry in Germany is expected to grow at a CAGR of 3.5% through 2035. High standards for environmental compliance and export-ready tire design drive development. Continental, Mitas, and Trelleborg have launched energy-efficient tires to meet strict EU norms. Adoption of precision machinery and reduced soil-pressure systems is reinforcing demand. Germany’s role as a manufacturing hub supports cross-border tire exports, aided by logistical efficiency and consistent quality benchmarks.

  • OEMs are embedding automated tire-inflation systems for tillage and harvesting equipment.
  • Biobased rubber materials are being trialed in next-gen radial tires.
  • Cooperative farming models are pooling procurement for high-performance tire lines.

Leading Farm Tire Market Suppliers

Leading Company -Balkrishna Industries Limited (BKT) Industry Share - 15%
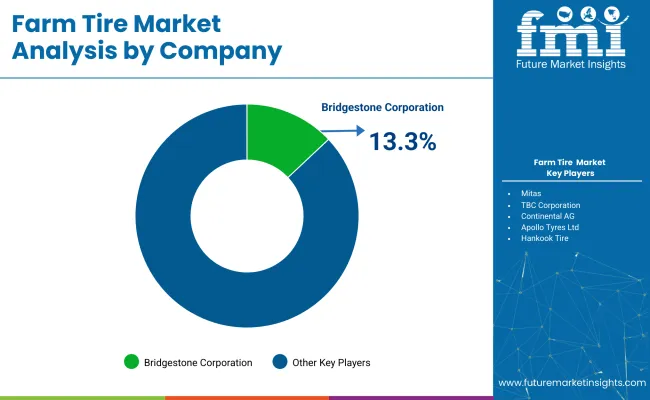
Farm Tire Market Analysis By Company

The global industry features a competitive landscape with dominant players, key players, and emerging players. Dominant players such as Balkrishna Industries Limited (BKT), Bridgestone Corporation, and CompagnieGénérale des Établissements Michelin (CGEM) lead the industry with extensive product portfolios, strong R&D capabilities, and robust distribution networks across agricultural machinery, construction, and industrial sectors.

Key players including Continental AG, Sumitomo Rubber Industries, Ltd., and Titan International, Inc. offer specialized solutions tailored to specific applications and regional industries. Emerging players, such as Mitas, TBC Corporation, and Apollo Tyres Ltd., focus on innovative technologies and cost-effective solutions, expanding their presence in the global industry.

Recent Industry Developments

  • Between 2024 and 2025, CEAT Limited made a strategic move by acquiring Michelin's Camso brand for USD 225 million in December 2024. This acquisition aims to expand CEAT's presence in the off-highway tire segment, boosting its product portfolio and industry footprint.
  • In November 2024, Goodyear Farm Tires announced plans to expand its product range in 2025, focusing on enhancing Low Sidewall Technology (LSW). This development, supported by a new European Development Centre, aims to improve tire performance and meet modern farming needs.

Research Coverage and Scope Summary

Report Attributes Details
Industry Size (2025) USD 9 billion
Projected Industry Size (2035) USD 15.9 billion
CAGR (2025 to 2035) 5.9%
Base Year for Estimation 2024
Historical Period 2020 to 2024
Projections Period 2025 to 2035
Quantitative Units USD billion for value and million units for volume
Product Segmentation Bias Tires, Radial Tires
Application Segmentation Tractors, Harvesters, Forestry, Irrigation, Implements, Sprayers
Distribution Channel Segmentation OEM, Aftermarket
Regions Covered North America, Asia Pacific, Europe, Latin America, Middle East & Africa
Countries Covered United States, Canada, Mexico, Brazil, Argentina, Germany, France, United Kingdom, Italy, Spain, Netherlands, China, India, Japan, South Korea, Australia, New Zealand, GCC Countries, South Africa
Key Players Influencing the Industry Balkrishna Industries Limited (BKT), Bridgestone Corporation, Continental AG, Compagnie Générale des Établissements Michelin (CGEM), Sumitomo Rubber Industries, Ltd., Titan International, Inc., Mitas, TBC Corporation, Apollo Tyres Ltd., Hankook Tire, MRF Limited, JK Tyre & Industries Ltd., CEAT, The Carlstar Group, LLC, Specialty Tires of America, Inc., Alliance Tire Group (ATG), Trelleborg AB
Additional Attributes Dollar sales by product type, application, and distribution channel, increasing demand for high-performance tires in agricultural machinery, growing adoption in emerging industrie s, regional trends in agricultural mechanization and tire technology.

Key Players in Farm Tire Market

  • Balkrishna Industries Limited (BKT)
  • Bridgestone Corporation
  • Continental AG
  • CompagnieGénérale des Établissements Michelin (CGEM)
  • Sumitomo Rubber Industries, Ltd.
  • Titan International, Inc.
  • Mitas
  • TBC Corporation
  • Apollo Tyres Ltd.
  • Hankook Tire
  • MRF Limited
  • JK Tyre & Industries Ltd.
  • CEAT
  • The Carlstar Group, LLC
  • Specialty Tires of America, Inc.
  • Alliance Tire Group (ATG)
  • Trelleborg AB

Farm Tire Market Analyzed by Key Investment Segments

By Product:

The industry is segmented by product into bias and radial tires.

By Application:

By application, the industry includes tractors, harvesters, forestry, irrigation, implements, and sprayers.

By Distribution Channel:

By distribution channel, the industry is categorized into OEM and aftermarket.

By Region:

The industry covers North America, Asia Pacific, Europe, Latin America, and Middle East & Africa.

Table of Content

  1. Executive Summary
    • Global Market Outlook
    • Demand-side Trends
    • Supply-side Trends
    • Technology Roadmap Analysis
    • Analysis and Recommendations
  2. Market Overview
    • Market Coverage / Taxonomy
    • Market Definition / Scope / Limitations
  3. Market Background
    • Market Dynamics
      • Drivers
      • Restraints
      • Opportunity
      • Trends
    • Scenario Forecast
      • Demand in Optimistic Scenario
      • Demand in Likely Scenario
      • Demand in Conservative Scenario
    • Opportunity Map Analysis
    • Product Life Cycle Analysis
    • Supply Chain Analysis
      • Supply Side Participants and their Roles
        • Producers
        • Mid-Level Participants (Traders/ Agents/ Brokers)
        • Wholesalers and Distributors
      • Value Added and Value Created at Node in the Supply Chain
      • List of Raw Material Suppliers
      • List of Existing and Potential Buyer’s
    • Investment Feasibility Matrix
    • Value Chain Analysis
      • Profit Margin Analysis
      • Wholesalers and Distributors
      • Retailers
    • PESTLE and Porter’s Analysis
    • Regulatory Landscape
      • By Key Regions
      • By Key Countries
    • Regional Parent Market Outlook
    • Production and Consumption Statistics
    • Import and Export Statistics
  4. Global Market Analysis 2020 to 2024 and Forecast, 2025 to 2035
    • Historical Market Size Value (USD Billion) & Volume (Million Units) Analysis, 2020 to 2024
    • Current and Future Market Size Value (USD Billion) & Volume (Million Units) Projections, 2025 to 2035
      • Y-o-Y Growth Trend Analysis
      • Absolute $ Opportunity Analysis
  5. Global Market Pricing Analysis 2020 to 2024 and Forecast 2025 to 2035
  6. Global Market Analysis 2020 to 2024 and Forecast 2025 to 2035, By Product
    • Introduction / Key Findings
    • Historical Market Size Value (USD Billion) & Volume (Million Units) Analysis By Product, 2020 to 2024
    • Current and Future Market Size Value (USD Billion) & Volume (Million Units) Analysis and Forecast By Product, 2025 to 2035
      • Bias Tires
      • Radial Tires
    • Y-o-Y Growth Trend Analysis By Product, 2020 to 2024
    • Absolute $ Opportunity Analysis By Product, 2025 to 2035
  7. Global Market Analysis 2020 to 2024 and Forecast 2025 to 2035, By Application
    • Introduction / Key Findings
    • Historical Market Size Value (USD Billion) & Volume (Million Units) Analysis By Application, 2020 to 2024
    • Current and Future Market Size Value (USD Billion) & Volume (Million Units) Analysis and Forecast By Application, 2025 to 2035
      • Tractors
      • Harvesters
      • Forestry
      • Irrigation
      • Implements
      • Sprayers
    • Y-o-Y Growth Trend Analysis By Application, 2020 to 2024
    • Absolute $ Opportunity Analysis By Application, 2025 to 2035
  8. Global Market Analysis 2020 to 2024 and Forecast 2025 to 2035, By Distribution Channel
    • Introduction / Key Findings
    • Historical Market Size Value (USD Billion) & Volume (Million Units) Analysis By Distribution Channel, 2020 to 2024
    • Current and Future Market Size Value (USD Billion) & Volume (Million Units) Analysis and Forecast By Distribution Channel, 2025 to 2035
      • OEM
      • Aftermarket
    • Y-o-Y Growth Trend Analysis By Distribution Channel, 2020 to 2024
    • Absolute $ Opportunity Analysis By Distribution Channel, 2025 to 2035
  9. Global Market Analysis 2020 to 2024 and Forecast 2025 to 2035, By Region
    • Introduction
    • Historical Market Size Value (USD Billion) & Volume (Million Units) Analysis By Region, 2020 to 2024
    • Current Market Size Value (USD Billion) & Volume (Million Units) Analysis and Forecast By Region, 2025 to 2035
      • North America
      • Latin America
      • Western Europe
      • Eastern Europe
      • East Asia
      • South Asia & Pacific
      • Middle East and Africa
    • Market Attractiveness Analysis By Region
  10. North America Market Analysis 2020 to 2024 and Forecast 2025 to 2035, By Country
    • Historical Market Size Value (USD Billion) & Volume (Million Units) Trend Analysis By Market Taxonomy, 2020 to 2024
    • Market Size Value (USD Billion) & Volume (Million Units) Forecast By Market Taxonomy, 2025 to 2035
      • By Country
        • USA
        • Canada
        • Mexico
      • By Product
      • By Application
      • By Distribution Channel
    • Market Attractiveness Analysis
      • By Country
      • By Product
      • By Application
      • By Distribution Channel
    • Key Takeaways
  11. Latin America Market Analysis 2020 to 2024 and Forecast 2025 to 2035, By Country
    • Historical Market Size Value (USD Billion) & Volume (Million Units) Trend Analysis By Market Taxonomy, 2020 to 2024
    • Market Size Value (USD Billion) & Volume (Million Units) Forecast By Market Taxonomy, 2025 to 2035
      • By Country
        • Brazil
        • Argentina
        • Rest of LATAM
      • By Product
      • By Application
      • By Distribution Channel
    • Market Attractiveness Analysis
      • By Country
      • By Product
      • By Application
      • By Distribution Channel
    • Key Takeaways
  12. Western Europe Market Analysis 2020 to 2024 and Forecast 2025 to 2035, By Country
    • Historical Market Size Value (USD Billion) & Volume (Million Units) Trend Analysis By Market Taxonomy, 2020 to 2024
    • Market Size Value (USD Billion) & Volume (Million Units) Forecast By Market Taxonomy, 2025 to 2035
      • By Country
        • Germany
        • Italy
        • France
        • UK
        • Spain
        • BENELUX
        • Nordic
        • Rest of W. Europe
      • By Product
      • By Application
      • By Distribution Channel
    • Market Attractiveness Analysis
      • By Country
      • By Product
      • By Application
      • By Distribution Channel
    • Key Takeaways
  13. Eastern Europe Market Analysis 2020 to 2024 and Forecast 2025 to 2035, By Country
    • Historical Market Size Value (USD Billion) & Volume (Million Units) Trend Analysis By Market Taxonomy, 2020 to 2024
    • Market Size Value (USD Billion) & Volume (Million Units) Forecast By Market Taxonomy, 2025 to 2035
      • By Country
        • Russia
        • Hungary
        • Poland
        • Balkan & Baltics
        • Rest of E. Europe
      • By Product
      • By Application
      • By Distribution Channel
    • Market Attractiveness Analysis
      • By Country
      • By Product
      • By Application
      • By Distribution Channel
    • Key Takeaways
  14. East Asia Market Analysis 2020 to 2024 and Forecast 2025 to 2035, By Country
    • Historical Market Size Value (USD Billion) & Volume (Million Units) Trend Analysis By Market Taxonomy, 2020 to 2024
    • Market Size Value (USD Billion) & Volume (Million Units) Forecast By Market Taxonomy, 2025 to 2035
      • By Country
        • China
        • Japan
        • South Korea
      • By Product
      • By Application
      • By Distribution Channel
    • Market Attractiveness Analysis
      • By Country
      • By Product
      • By Application
      • By Distribution Channel
    • Key Takeaways
  15. South Asia & Pacific Market Analysis 2020 to 2024 and Forecast 2025 to 2035, By Country
    • Historical Market Size Value (USD Billion) & Volume (Million Units) Trend Analysis By Market Taxonomy, 2020 to 2024
    • Market Size Value (USD Billion) & Volume (Million Units) Forecast By Market Taxonomy, 2025 to 2035
      • By Country
        • India
        • Australia & New Zealand
        • ASEAN
        • Rest of SAP
      • By Product
      • By Application
      • By Distribution Channel
    • Market Attractiveness Analysis
      • By Country
      • By Product
      • By Application
      • By Distribution Channel
    • Key Takeaways
  16. Middle East and Africa Market Analysis 2020 to 2024 and Forecast 2025 to 2035, By Country
    • Historical Market Size Value (USD Billion) & Volume (Million Units) Trend Analysis By Market Taxonomy, 2020 to 2024
    • Market Size Value (USD Billion) & Volume (Million Units) Forecast By Market Taxonomy, 2025 to 2035
      • By Country
        • GCC Countries
        • Northern Africa
        • South Africa
        • Turkiye
        • Rest of MEA
      • By Product
      • By Application
      • By Distribution Channel
    • Market Attractiveness Analysis
      • By Country
      • By Product
      • By Application
      • By Distribution Channel
    • Key Takeaways
  17. Key Countries Market Analysis
    • USA
      • Pricing Analysis
      • Market Share Analysis, 2024
        • By Product
        • By Application
        • By Distribution Channel
    • Canada
      • Pricing Analysis
      • Market Share Analysis, 2024
        • By Product
        • By Application
        • By Distribution Channel
    • Brazil
      • Pricing Analysis
      • Market Share Analysis, 2024
        • By Product
        • By Application
        • By Distribution Channel
    • Mexico
      • Pricing Analysis
      • Market Share Analysis, 2024
        • By Product
        • By Application
        • By Distribution Channel
    • Argentina
      • Pricing Analysis
      • Market Share Analysis, 2024
        • By Product
        • By Application
        • By Distribution Channel
  18. Market Structure Analysis
    • Competition Dashboard
    • Competition Benchmarking
    • Market Share Analysis of Top Players
      • By Regional
      • By Product
      • By Application
      • By Distribution Channel
  19. Competition Analysis
    • Competition Deep Dive
      • Balkrishna Industries Limited (BKT)
        • Overview
        • Product Portfolio
        • Profitability by Market Segments (Product/Age /Sales Channel/Region)
        • Sales Footprint
        • Strategy Overview
          • Marketing Strategy
          • Product Strategy
          • Channel Strategy
      • Bridgestone Corporation
        • Overview
        • Product Portfolio
        • Profitability by Market Segments (Product/Age /Sales Channel/Region)
        • Sales Footprint
        • Strategy Overview
          • Marketing Strategy
          • Product Strategy
          • Channel Strategy
      • Continental AG
        • Overview
        • Product Portfolio
        • Profitability by Market Segments (Product/Age /Sales Channel/Region)
        • Sales Footprint
        • Strategy Overview
          • Marketing Strategy
          • Product Strategy
          • Channel Strategy
      • Compagnie Générale des Établissements Michelin (CGEM)
        • Overview
        • Product Portfolio
        • Profitability by Market Segments (Product/Age /Sales Channel/Region)
        • Sales Footprint
        • Strategy Overview
          • Marketing Strategy
          • Product Strategy
          • Channel Strategy
      • Sumitomo Rubber Industries, Ltd.
        • Overview
        • Product Portfolio
        • Profitability by Market Segments (Product/Age /Sales Channel/Region)
        • Sales Footprint
        • Strategy Overview
          • Marketing Strategy
          • Product Strategy
          • Channel Strategy
      • Titan International, Inc.
        • Overview
        • Product Portfolio
        • Profitability by Market Segments (Product/Age /Sales Channel/Region)
        • Sales Footprint
        • Strategy Overview
          • Marketing Strategy
          • Product Strategy
          • Channel Strategy
      • Mitas
        • Overview
        • Product Portfolio
        • Profitability by Market Segments (Product/Age /Sales Channel/Region)
        • Sales Footprint
        • Strategy Overview
          • Marketing Strategy
          • Product Strategy
          • Channel Strategy
      • TBC Corporation
        • Overview
        • Product Portfolio
        • Profitability by Market Segments (Product/Age /Sales Channel/Region)
        • Sales Footprint
        • Strategy Overview
          • Marketing Strategy
          • Product Strategy
          • Channel Strategy
      • Apollo Tyres Ltd.
        • Overview
        • Product Portfolio
        • Profitability by Market Segments (Product/Age /Sales Channel/Region)
        • Sales Footprint
        • Strategy Overview
          • Marketing Strategy
          • Product Strategy
          • Channel Strategy
      • Hankook Tire
        • Overview
        • Product Portfolio
        • Profitability by Market Segments (Product/Age /Sales Channel/Region)
        • Sales Footprint
        • Strategy Overview
          • Marketing Strategy
          • Product Strategy
          • Channel Strategy
      • MRF Limited
        • Overview
        • Product Portfolio
        • Profitability by Market Segments (Product/Age /Sales Channel/Region)
        • Sales Footprint
        • Strategy Overview
          • Marketing Strategy
          • Product Strategy
          • Channel Strategy
      • JK Tyre & Industries Ltd.
        • Overview
        • Product Portfolio
        • Profitability by Market Segments (Product/Age /Sales Channel/Region)
        • Sales Footprint
        • Strategy Overview
          • Marketing Strategy
          • Product Strategy
          • Channel Strategy
      • CEAT
        • Overview
        • Product Portfolio
        • Profitability by Market Segments (Product/Age /Sales Channel/Region)
        • Sales Footprint
        • Strategy Overview
          • Marketing Strategy
          • Product Strategy
          • Channel Strategy
      • The Carlstar Group, LLC
        • Overview
        • Product Portfolio
        • Profitability by Market Segments (Product/Age /Sales Channel/Region)
        • Sales Footprint
        • Strategy Overview
          • Marketing Strategy
          • Product Strategy
          • Channel Strategy
      • Specialty Tires of America, Inc.
        • Overview
        • Product Portfolio
        • Profitability by Market Segments (Product/Age /Sales Channel/Region)
        • Sales Footprint
        • Strategy Overview
          • Marketing Strategy
          • Product Strategy
          • Channel Strategy
      • Alliance Tire Group (ATG)
        • Overview
        • Product Portfolio
        • Profitability by Market Segments (Product/Age /Sales Channel/Region)
        • Sales Footprint
        • Strategy Overview
          • Marketing Strategy
          • Product Strategy
          • Channel Strategy
      • Trelleborg AB
        • Overview
        • Product Portfolio
        • Profitability by Market Segments (Product/Age /Sales Channel/Region)
        • Sales Footprint
        • Strategy Overview
          • Marketing Strategy
          • Product Strategy
          • Channel Strategy
  20. Assumptions & Acronyms Used
  21. Research Methodology

List of Tables

  • Table 1: Global Market Value (USD Billion) Forecast by Region, 2020 to 2035
  • Table 2: Global Market Volume (Million Units) Forecast by Region, 2020 to 2035
  • Table 3: Global Market Value (USD Billion) Forecast by Product, 2020 to 2035
  • Table 4: Global Market Volume (Million Units) Forecast by Product, 2020 to 2035
  • Table 5: Global Market Value (USD Billion) Forecast by Application, 2020 to 2035
  • Table 6: Global Market Volume (Million Units) Forecast by Application, 2020 to 2035
  • Table 7: Global Market Value (USD Billion) Forecast by Distribution Channel, 2020 to 2035
  • Table 8: Global Market Volume (Million Units) Forecast by Distribution Channel, 2020 to 2035
  • Table 9: North America Market Value (USD Billion) Forecast by Country, 2020 to 2035
  • Table 10: North America Market Volume (Million Units) Forecast by Country, 2020 to 2035
  • Table 11: North America Market Value (USD Billion) Forecast by Product, 2020 to 2035
  • Table 12: North America Market Volume (Million Units) Forecast by Product, 2020 to 2035
  • Table 13: North America Market Value (USD Billion) Forecast by Application, 2020 to 2035
  • Table 14: North America Market Volume (Million Units) Forecast by Application, 2020 to 2035
  • Table 15: North America Market Value (USD Billion) Forecast by Distribution Channel, 2020 to 2035
  • Table 16: North America Market Volume (Million Units) Forecast by Distribution Channel, 2020 to 2035
  • Table 17: Latin America Market Value (USD Billion) Forecast by Country, 2020 to 2035
  • Table 18: Latin America Market Volume (Million Units) Forecast by Country, 2020 to 2035
  • Table 19: Latin America Market Value (USD Billion) Forecast by Product, 2020 to 2035
  • Table 20: Latin America Market Volume (Million Units) Forecast by Product, 2020 to 2035
  • Table 21: Latin America Market Value (USD Billion) Forecast by Application, 2020 to 2035
  • Table 22: Latin America Market Volume (Million Units) Forecast by Application, 2020 to 2035
  • Table 23: Latin America Market Value (USD Billion) Forecast by Distribution Channel, 2020 to 2035
  • Table 24: Latin America Market Volume (Million Units) Forecast by Distribution Channel, 2020 to 2035
  • Table 25: Western Europe Market Value (USD Billion) Forecast by Country, 2020 to 2035
  • Table 26: Western Europe Market Volume (Million Units) Forecast by Country, 2020 to 2035
  • Table 27: Western Europe Market Value (USD Billion) Forecast by Product, 2020 to 2035
  • Table 28: Western Europe Market Volume (Million Units) Forecast by Product, 2020 to 2035
  • Table 29: Western Europe Market Value (USD Billion) Forecast by Application, 2020 to 2035
  • Table 30: Western Europe Market Volume (Million Units) Forecast by Application, 2020 to 2035
  • Table 31: Western Europe Market Value (USD Billion) Forecast by Distribution Channel, 2020 to 2035
  • Table 32: Western Europe Market Volume (Million Units) Forecast by Distribution Channel, 2020 to 2035
  • Table 33: Eastern Europe Market Value (USD Billion) Forecast by Country, 2020 to 2035
  • Table 34: Eastern Europe Market Volume (Million Units) Forecast by Country, 2020 to 2035
  • Table 35: Eastern Europe Market Value (USD Billion) Forecast by Product, 2020 to 2035
  • Table 36: Eastern Europe Market Volume (Million Units) Forecast by Product, 2020 to 2035
  • Table 37: Eastern Europe Market Value (USD Billion) Forecast by Application, 2020 to 2035
  • Table 38: Eastern Europe Market Volume (Million Units) Forecast by Application, 2020 to 2035
  • Table 39: Eastern Europe Market Value (USD Billion) Forecast by Distribution Channel, 2020 to 2035
  • Table 40: Eastern Europe Market Volume (Million Units) Forecast by Distribution Channel, 2020 to 2035
  • Table 41: East Asia Market Value (USD Billion) Forecast by Country, 2020 to 2035
  • Table 42: East Asia Market Volume (Million Units) Forecast by Country, 2020 to 2035
  • Table 43: East Asia Market Value (USD Billion) Forecast by Product, 2020 to 2035
  • Table 44: East Asia Market Volume (Million Units) Forecast by Product, 2020 to 2035
  • Table 45: East Asia Market Value (USD Billion) Forecast by Application, 2020 to 2035
  • Table 46: East Asia Market Volume (Million Units) Forecast by Application, 2020 to 2035
  • Table 47: East Asia Market Value (USD Billion) Forecast by Distribution Channel, 2020 to 2035
  • Table 48: East Asia Market Volume (Million Units) Forecast by Distribution Channel, 2020 to 2035
  • Table 49: South Asia & Pacific Market Value (USD Billion) Forecast by Country, 2020 to 2035
  • Table 50: South Asia & Pacific Market Volume (Million Units) Forecast by Country, 2020 to 2035
  • Table 51: South Asia & Pacific Market Value (USD Billion) Forecast by Product, 2020 to 2035
  • Table 52: South Asia & Pacific Market Volume (Million Units) Forecast by Product, 2020 to 2035
  • Table 53: South Asia & Pacific Market Value (USD Billion) Forecast by Application, 2020 to 2035
  • Table 54: South Asia & Pacific Market Volume (Million Units) Forecast by Application, 2020 to 2035
  • Table 55: South Asia & Pacific Market Value (USD Billion) Forecast by Distribution Channel, 2020 to 2035
  • Table 56: South Asia & Pacific Market Volume (Million Units) Forecast by Distribution Channel, 2020 to 2035
  • Table 57: Middle East and Africa Market Value (USD Billion) Forecast by Country, 2020 to 2035
  • Table 58: Middle East and Africa Market Volume (Million Units) Forecast by Country, 2020 to 2035
  • Table 59: Middle East and Africa Market Value (USD Billion) Forecast by Product, 2020 to 2035
  • Table 60: Middle East and Africa Market Volume (Million Units) Forecast by Product, 2020 to 2035
  • Table 61: Middle East and Africa Market Value (USD Billion) Forecast by Application, 2020 to 2035
  • Table 62: Middle East and Africa Market Volume (Million Units) Forecast by Application, 2020 to 2035
  • Table 63: Middle East and Africa Market Value (USD Billion) Forecast by Distribution Channel, 2020 to 2035
  • Table 64: Middle East and Africa Market Volume (Million Units) Forecast by Distribution Channel, 2020 to 2035

List of Figures

  • Figure 1: Global Market Volume (Million Units) Forecast 2020 to 2035
  • Figure 2: Global Market Pricing Analysis
  • Figure 3: Global Market Value (USD Billion) Forecast 2020 to 2035
  • Figure 4: Global Market Value Share and BPS Analysis by Product, 2025 and 2035
  • Figure 5: Global Market Y-o-Y Growth Comparison by Product, 2025 to 2035
  • Figure 6: Global Market Attractiveness Analysis by Product
  • Figure 7: Global Market Value Share and BPS Analysis by Application, 2025 and 2035
  • Figure 8: Global Market Y-o-Y Growth Comparison by Application, 2025 to 2035
  • Figure 9: Global Market Attractiveness Analysis by Application
  • Figure 10: Global Market Value Share and BPS Analysis by Distribution Channel, 2025 and 2035
  • Figure 11: Global Market Y-o-Y Growth Comparison by Distribution Channel, 2025 to 2035
  • Figure 12: Global Market Attractiveness Analysis by Distribution Channel
  • Figure 13: Global Market Value (USD Billion) Share and BPS Analysis by Region, 2025 and 2035
  • Figure 14: Global Market Y-o-Y Growth Comparison by Region, 2025 to 2035
  • Figure 15: Global Market Attractiveness Analysis by Region
  • Figure 16: North America Market Incremental $ Opportunity, 2025 to 2035
  • Figure 17: Latin America Market Incremental $ Opportunity, 2025 to 2035
  • Figure 18: Western Europe Market Incremental $ Opportunity, 2025 to 2035
  • Figure 19: Eastern Europe Market Incremental $ Opportunity, 2025 to 2035
  • Figure 20: East Asia Market Incremental $ Opportunity, 2025 to 2035
  • Figure 21: South Asia & Pacific Market Incremental $ Opportunity, 2025 to 2035
  • Figure 22: Middle East and Africa Market Incremental $ Opportunity, 2025 to 2035
  • Figure 23: North America Market Value Share and BPS Analysis by Country, 2025 and 2035
  • Figure 24: North America Market Value Share and BPS Analysis by Product, 2025 and 2035
  • Figure 25: North America Market Y-o-Y Growth Comparison by Product, 2025 to 2035
  • Figure 26: North America Market Attractiveness Analysis by Product
  • Figure 27: North America Market Value Share and BPS Analysis by Application, 2025 and 2035
  • Figure 28: North America Market Y-o-Y Growth Comparison by Application, 2025 to 2035
  • Figure 29: North America Market Attractiveness Analysis by Application
  • Figure 30: North America Market Value Share and BPS Analysis by Distribution Channel, 2025 and 2035
  • Figure 31: North America Market Y-o-Y Growth Comparison by Distribution Channel, 2025 to 2035
  • Figure 32: North America Market Attractiveness Analysis by Distribution Channel
  • Figure 33: Latin America Market Value Share and BPS Analysis by Country, 2025 and 2035
  • Figure 34: Latin America Market Value Share and BPS Analysis by Product, 2025 and 2035
  • Figure 35: Latin America Market Y-o-Y Growth Comparison by Product, 2025 to 2035
  • Figure 36: Latin America Market Attractiveness Analysis by Product
  • Figure 37: Latin America Market Value Share and BPS Analysis by Application, 2025 and 2035
  • Figure 38: Latin America Market Y-o-Y Growth Comparison by Application, 2025 to 2035
  • Figure 39: Latin America Market Attractiveness Analysis by Application
  • Figure 40: Latin America Market Value Share and BPS Analysis by Distribution Channel, 2025 and 2035
  • Figure 41: Latin America Market Y-o-Y Growth Comparison by Distribution Channel, 2025 to 2035
  • Figure 42: Latin America Market Attractiveness Analysis by Distribution Channel
  • Figure 43: Western Europe Market Value Share and BPS Analysis by Country, 2025 and 2035
  • Figure 44: Western Europe Market Value Share and BPS Analysis by Product, 2025 and 2035
  • Figure 45: Western Europe Market Y-o-Y Growth Comparison by Product, 2025 to 2035
  • Figure 46: Western Europe Market Attractiveness Analysis by Product
  • Figure 47: Western Europe Market Value Share and BPS Analysis by Application, 2025 and 2035
  • Figure 48: Western Europe Market Y-o-Y Growth Comparison by Application, 2025 to 2035
  • Figure 49: Western Europe Market Attractiveness Analysis by Application
  • Figure 50: Western Europe Market Value Share and BPS Analysis by Distribution Channel, 2025 and 2035
  • Figure 51: Western Europe Market Y-o-Y Growth Comparison by Distribution Channel, 2025 to 2035
  • Figure 52: Western Europe Market Attractiveness Analysis by Distribution Channel
  • Figure 53: Eastern Europe Market Value Share and BPS Analysis by Country, 2025 and 2035
  • Figure 54: Eastern Europe Market Value Share and BPS Analysis by Product, 2025 and 2035
  • Figure 55: Eastern Europe Market Y-o-Y Growth Comparison by Product, 2025 to 2035
  • Figure 56: Eastern Europe Market Attractiveness Analysis by Product
  • Figure 57: Eastern Europe Market Value Share and BPS Analysis by Application, 2025 and 2035
  • Figure 58: Eastern Europe Market Y-o-Y Growth Comparison by Application, 2025 to 2035
  • Figure 59: Eastern Europe Market Attractiveness Analysis by Application
  • Figure 60: Eastern Europe Market Value Share and BPS Analysis by Distribution Channel, 2025 and 2035
  • Figure 61: Eastern Europe Market Y-o-Y Growth Comparison by Distribution Channel, 2025 to 2035
  • Figure 62: Eastern Europe Market Attractiveness Analysis by Distribution Channel
  • Figure 63: East Asia Market Value Share and BPS Analysis by Country, 2025 and 2035
  • Figure 64: East Asia Market Value Share and BPS Analysis by Product, 2025 and 2035
  • Figure 65: East Asia Market Y-o-Y Growth Comparison by Product, 2025 to 2035
  • Figure 66: East Asia Market Attractiveness Analysis by Product
  • Figure 67: East Asia Market Value Share and BPS Analysis by Application, 2025 and 2035
  • Figure 68: East Asia Market Y-o-Y Growth Comparison by Application, 2025 to 2035
  • Figure 69: East Asia Market Attractiveness Analysis by Application
  • Figure 70: East Asia Market Value Share and BPS Analysis by Distribution Channel, 2025 and 2035
  • Figure 71: East Asia Market Y-o-Y Growth Comparison by Distribution Channel, 2025 to 2035
  • Figure 72: East Asia Market Attractiveness Analysis by Distribution Channel
  • Figure 73: South Asia & Pacific Market Value Share and BPS Analysis by Country, 2025 and 2035
  • Figure 74: South Asia & Pacific Market Value Share and BPS Analysis by Product, 2025 and 2035
  • Figure 75: South Asia & Pacific Market Y-o-Y Growth Comparison by Product, 2025 to 2035
  • Figure 76: South Asia & Pacific Market Attractiveness Analysis by Product
  • Figure 77: South Asia & Pacific Market Value Share and BPS Analysis by Application, 2025 and 2035
  • Figure 78: South Asia & Pacific Market Y-o-Y Growth Comparison by Application, 2025 to 2035
  • Figure 79: South Asia & Pacific Market Attractiveness Analysis by Application
  • Figure 80: South Asia & Pacific Market Value Share and BPS Analysis by Distribution Channel, 2025 and 2035
  • Figure 81: South Asia & Pacific Market Y-o-Y Growth Comparison by Distribution Channel, 2025 to 2035
  • Figure 82: South Asia & Pacific Market Attractiveness Analysis by Distribution Channel
  • Figure 83: Middle East and Africa Market Value Share and BPS Analysis by Country, 2025 and 2035
  • Figure 84: Middle East and Africa Market Value Share and BPS Analysis by Product, 2025 and 2035
  • Figure 85: Middle East and Africa Market Y-o-Y Growth Comparison by Product, 2025 to 2035
  • Figure 86: Middle East and Africa Market Attractiveness Analysis by Product
  • Figure 87: Middle East and Africa Market Value Share and BPS Analysis by Application, 2025 and 2035
  • Figure 88: Middle East and Africa Market Y-o-Y Growth Comparison by Application, 2025 to 2035
  • Figure 89: Middle East and Africa Market Attractiveness Analysis by Application
  • Figure 90: Middle East and Africa Market Value Share and BPS Analysis by Distribution Channel, 2025 and 2035
  • Figure 91: Middle East and Africa Market Y-o-Y Growth Comparison by Distribution Channel, 2025 to 2035
  • Figure 92: Middle East and Africa Market Attractiveness Analysis by Distribution Channel
  • Figure 93: Global Market - Tier Structure Analysis
  • Figure 94: Global Market - Company Share Analysis

Frequently Asked Questions

What is the projected size of the farm tire market in 2025 and 2035?

The industry size is projected to be USD 9 billion in 2025 and USD 15.9 billion by 2035.

What is the expected CAGR for the farm tire market from 2025 to 2035?

The expected CAGR is 5.9% from 2025 to 2035.

Which tire segment is expected to dominate the farm tire market in 2035?

Radial tires are expected to dominate with a 65% industry share in 2035.

Who is the leading company in the farm tire market?

Balkrishna Industries Limited (BKT) is the leading company, holding a 15% industry share.

What is the projected CAGR of the farm tire market in India?

India is projected to grow at a CAGR of 8% from 2025 to 2035.

Explore Similar Insights

Future Market Insights

Farm Tire Market