Reports

- Global Locations -

Headquarters

Future Market Insights, Inc.

Christiana Corporate, 200
Continental Drive, Suite 401,
Newark, Delaware - 19713,
United States

T: +1-845-579-5705

Americas

Future Market Insights, Inc.

616 Corporate Way, Suite 2-9018,
Valley Cottage, NY 10989, United States

T: +1-347-918-3531

MEA

Future Market Insights

1602-6 Jumeirah Bay X2 Tower, Plot No: JLT-PH2-X2A,
Jumeirah Lakes Towers, Dubai,
United Arab Emirates

Europe

Future Market Insights

3rd Floor, 207 Regent Street,
W1B 3HH London
United Kingdom

T: + 44 (0) 20 8123 9659
D: +44 (0) 20 3287 4268

Asia Pacific

Future Market Insights

IndiaLand Global Tech Park, Unit UG-1, Behind Grand HighStreet, Phase 1, Hinjawadi, MH, Pune – 411057, India

Farm Animal Drugs Market Outlook (2022 to 2032)

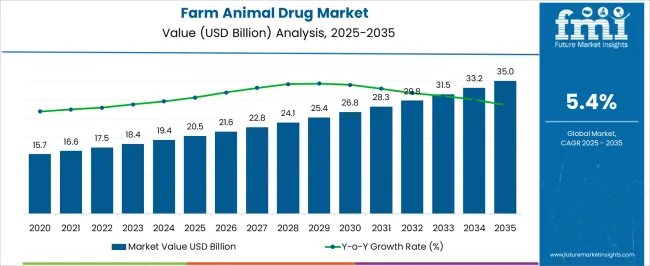
[250 Pages Report] The global farm animal drugs market size is expected to reach a valuation of US$ 17.2 Billion by the end of 2022, and further expand at a CAGR of 5.5% from 2022 to 2032. The market is projected to reach a valuation of ~US$ 29.4 Billion by the end of 2032. Livestock animals are leading the market in terms of animals and the segment held a share of about 92.4% in 2021.

Omnivorous people are directly dependent on healthy, productive animals for their food supply and financial security, especially in low- and middle-income nations, where a high percentage of people make a living by raising animals. The Health for Animals Organization estimates that 1.3 billion individuals keep livestock worldwide (2021). As a result, controlling and preventing animal diseases is essential to achieving sustainable development goals and is a worldwide public benefit.

In addition, antibiotics are frequently used to treat sick animals. Failure to follow drug withdrawal periods in farm animals leads to the production of contaminated products and raises concerns about their safety when consumed by humans. Over certain maximum levels of antibiotic residue, items are regarded unfit for ingestion and should be thrown away in a manner that minimizes the risk of environmental contamination.

Humans can contract antimicrobial-resistant bacteria from food animals either directly or indirectly through contaminated environments, compromised foods, or direct contact with animals. These factors are projected to compel pharmaceutical companies to develop innovative farm animal drugs.

Attributes Key Statistics
Farm Animal Drugs Market Estimated Valuation (2022E) US$ 17.2 Billion
Projected Market Valuation (2032F) US$ 29.4 Billion
Value-based CAGR (2022 to 2032) 5.5%
Collective Value Share: Top 5 Countries 51.8%

Don't pay for what you don't need

Customize your report by selecting specific countries or regions and save 30%!

2012 to 2021 Global Farm Animal Drugs Demand Outlook Compared to 2022 to 2032 Forecast

The market for farm animal drugs held approximately 54.9% of the global veterinary medicine market, which was worth ~US$ 29.4 Billion in 2021. Sales of farm animal drugs expanded at a CAGR of 5.8% from 2012 to 2021 owing to rising advancements in the field of zoonotic disease diagnostics.

Cross-sectoral cooperation is prioritized in order to control risks and effects from the interface between people, animals, and the environment to enhance global health security. A key element in reaching this goal is making sure that veterinary medications are of high quality. Veterinary medicinal items that are substandard and falsified (SF) will logically have a negative impact on food security, farming & animal trading networks, and agricultural production.

Limited active pharmaceutical ingredient (API) concentrations in SF antibiotics or low bioavailability, as seen by poor dissolving, increase the risk of sub-therapeutic plasma levels. Antimicrobial resistance (AMR), which can be transmitted to people through contact with animals, food, or their environment, may be selected for by pathogens that "see" suboptimal drug levels in animals.

Farmers have been under constant pressure to produce more food, but in limited spaces, in an effort to meet the rising food demand, which is being fuelled by rapid population growth, urbanization, and growing income. Additionally, antibiotics are present in animal foods. They are introduced to animal feeds in little (sub-therapeutic) amounts to encourage growth, but this can result in the rise of AMR bacteria. Many regions, notably the European Union, have outlawed the use of growth boosters.

Long hospital admissions, rising mortality, reduction in the protection provided to patients needing surgery, and higher treatment expenses are some of the negative effects of infection associated with AMR bacteria. With the high demand for safe food for consumption, the market for farm animal drugs is expected to witness growth at a CAGR of 5.5% during the forecast period from 2022 to 2032.

Farm Animal Drugs Market

Top Trend Pushing Sales of Farm Animal Drugs

  • Emergence of Controlled Release Technology

Controlled-release (CR) technology has a lot of potential in the veterinary sector. The welfare of animals (reduced strain from restrictions and handling needed for more regular dosing of conventional dosage forms), caregiver or veterinarian convenience, and cost-effectiveness are some of the primary drivers for the development of a controlled and/or prolonged-release system in veterinary medicine.

Contrary to the delivery of medicine in drinking water or food, controlled-release systems are not only easier to use than repeat-injection dosing but also allow for the measurement of the drug's dosage. When compared to dosage via oral or injectable routes, topical administration for local or systemic effects frequently offers additional advantages such as reduced handling during administration. Thus, the emergence of the controlled release technology is set to provide traction to the overall growth in the farm animal drugs market during the forecast period.

Sabyasachi Ghosh
Sabyasachi Ghosh

Principal Consultant

Talk to Analyst

Find your sweet spots for generating winning opportunities in this market.

Which Factors Are Restraining the Demand for Farm Animal Drugs?

The National Regulatory Authorities (NRAs) are still underfunded in many low-and middle-income countries (LMICs). Even if the World Health Organization's (WHO) Global Benchmarking of Regulatory Systems can currently revolutionize the way regulatory strengthening is directed, significant investments will be required to achieve an adequate level of regulatory maturity globally. The relatively heavy weight of the aforementioned issues in LMICs is mostly attributable to weak regulatory frameworks, limited resources, inadequate infrastructure, and a lack of skilled employees.

It is essential to evaluate the efficacy of medications using strict standards and to keep an eye on their sensible usage, including in the veterinary industry, in order to determine the severity and scope of the issue & to guarantee the provision of high-quality healthcare services. Owing to the aforementioned factors, the global farm animal drugs market may be hampered in the upcoming decade.

Country-wise Insights

What Makes the USA a Significant Manufacturing Hub for Farm Animal Drugs?

“Surging Meat Exports from the USA to Spur Sales of Antibiotics for Livestock”

The USA dominates the North American region and generated a farm animal drugs market share of about 56.5% in 2021. As per FMI, the country is expected to continue to experience the same growth rate throughout the forecast period. The rising prevalence of various animal diseases brought on by increased globalization, high demand for meat exports from the USA, and antibiotic resistance in animals are projected to encourage key players to develop innovative farm animal drugs in the country.

How Are Farm Animal Drugs Manufacturers Progressing in Germany?

“Strict Rules Governing Antibiotics Used for Animals to Push Growth in Germany”

Germany held a share of about 2.7% in the global farm animal drugs market in 2021. One aspect that is affecting antibiotic sales in the country is stringent legislation governing the use of antibiotics for increasing the productivity of farm animals. The majority of livestock production in Germany is highly industrialized and modernized, and the percentages of production that employ various biosecurity measures & disease-threat reduction techniques have been rising. Regulations or consumer pressures have pushed the nation to embrace disease-reduction strategies, which would boost the German farm animal drugs market.

What Makes India a Highly Lucrative Industry for Farm Animal Drugs?

“Expansion of the Indian Dairy Sector to Boost Demand for Antibiotics for Farm Animals”

India held approximately 3.8% of the share of the global farm animals market in 2021. Livestock production, especially the dairy industry, is crucial for the food and nutritional security of various communities in India. It also provides a living for many farmers and supports the nation's economy. Antimicrobial resistance (AMR) is a significant public health concern, and India is a country with high consumption of antibiotics. This factor would thus propel the Indian farm animal drugs market in the upcoming decade.

Get the data you need at a Fraction of the cost

Personalize your report by choosing insights you need
and save 40%!

Category-wise Insights

Which is the Highly Preferred Product in the Farm Animal Drugs Industry?

“High Prevalence of Zoonotic Diseases to Drive Sales of Anti-infective Medications”

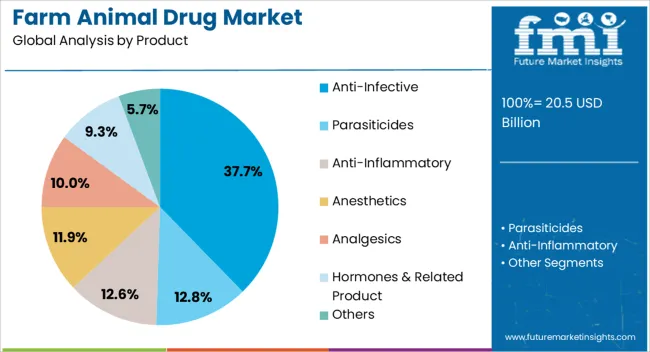
By product, the anti-infective segment held a share of around 36.9% in the global farm animal drugs market in 2021. The segment is expected to hold the largest market share in the next decade owing to rising concerns regarding animal health, the surging prevalence of zoonotic diseases, as well as transmission of these diseases to humans from animals.

Which Animals Are Set to Be the Dominant Users of Drugs?

“Antibiotics for Livestock to Gain Impetus with High Demand for Meat Products”

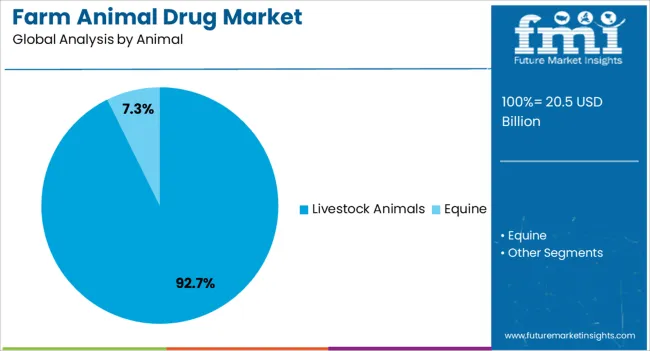
By animal, the livestock animals segment held the highest farm animal drugs market share of about 92.4% in 2021. With increasing reliance on animal and dairy products globally, there is an urgent need to prevent contamination of meat products, which would thus propel the livestock animals segment in the market. Disease prevention and control, as well as the development of novel formulations for producing safe and quality foods, are further expected to foster this segment.

Which is the Most Preferred Route of Administration of Drugs for Farm Animals?

“Large Animal Antibiotics to Be Provided through the Oral Route of Administration”

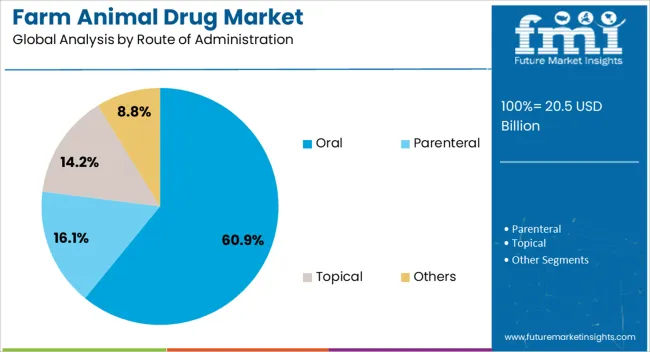
The oral route of administration segment held the highest market share of about 41.3% in 2021. In cattle, poultry, and pigs, the oral mode of administration is most frequently employed. Premixes, drinking water additives, tablets, capsules, drenches, licks, boluses, and pastes are some of the common examples of oral formulations. The segment is expected to hold a high market share over the forecast period owing to its ease of administration.

Which is the Leading Distribution Channel in the Farm Animal Drugs Industry?

“Antibiotics for Farm Animals to Be Made Available in Veterinary Hospitals”

Veterinary hospitals held a revenue share of about 45.6% in 2021 in the global farm animal drugs market. With the presence of skilled professionals, greater awareness about the health & management of livestock animals, and favorable government incentives, veterinary hospitals hold a dominant market share based on distribution channels in the global farm animal drugs market.

Competitive Landscape

Key players present in the global farm animal drugs market are focusing on expanding their product portfolios by engaging in acquisitions and mergers with local companies. A few other key players are investing huge sums in research and development activities to come up with novel formulations for maintaining the overall health of farm animals, as well as for increasing the quality of dairy products and meats while processing.

Some of the recent industry developments in the global market are:

  • In September 2022, the Indian Council of Agricultural Research (ICAR) announced that it is planning to commercially launch its indigenously-developed vaccine against the Lumpy Skin Disease (LSD) virus. The virus has killed nearly 50,000 heads of cattle across India since April.
  • In September 2022, the Chhattisgarh government is planning to introduce Mukhyamantri Govansh Mobile Chikitsa Yojana, which would include a couple of veterinary units and veterinarians will be provided in every district. It would help in providing quality medical facilities to cattle in inaccessible & remote areas as part of the government’s measures toward the protection & welfare of livestock.

Scope of the Farm Animal Drugs Market Report

Attribute Details
Estimated Market Size (2022) US$ 17.2 Billion
Projected Market Valuation (2032) US$ 29.4 Billion
Value-based CAGR (2022 to 2032) 5.5%
Forecast Period 2012 to 2021
Historical Data Available for 2022 to 2032
Market Analysis Value (US$ Billion)
Key Regions Covered North America, Latin America, Europe, South Asia, East Asia, Oceania, and Middle East & Africa (MEA)
Key Countries Covered The USA, Canada, Brazil, Mexico, Argentina, The UK, Germany, Italy, Russia, Spain, France, BENELUX, India, Thailand, Indonesia, Malaysia, Japan, China, South Korea, Australia, New Zealand, Turkey, GCC Countries, North Africa, and South Africa
Key Market Segments Covered Product, Route of Administration, Animal, Distribution Channel, and Region
Key Companies Profiled
  • Bayer AG
  • Boehringer Ingelheim GmbH
  • Zoetis, Inc.
  • Ceva Santé Animale
  • Dechra Pharmaceuticals PLC
  • Elanco Animal Health (Sub. Eli Lilly)
  • Merck Animal Health
  • Virbac SA
  • Vetoquinol SA
  • Intas Animal Health
  • Alembic Animal Health
  • Sequent Scientific
  • Hester Biosciences
  • Ashish Life Sciences
  • Ouro Fino Saude Animal (Ourofino)
  • Zydus Animal Health (Sub. Cadila Healthcare Ltd)
  • Phibro Animal Health Corporation
  • Nippon Zenyaku Kogyo Co., Ltd
  • Norbrook
  • Kyoritsu Seiyaku Corporation
Report Coverage Market Forecast, Company Share Analysis, Competition Intelligence, DROT Analysis, Market Dynamics and Challenges, and Strategic Growth Initiatives

Key Segments Covered in Farm Animal Drugs Market Analysis

By Product:

  • Anti-Infective
  • Parasiticides
    • Endo-parasiticides
    • Ecto-parasiticides
    • Endectocides
  • Anti-Inflammatory
  • Anesthetics
  • Analgesics
  • Hormones & Related Product
  • Others

By Animal:

  • Livestock Animals
    • Ruminants
    • Swine
    • Poultry
  • Equine

By Route of Administration:

  • Oral
  • Parenteral
  • Topical
  • Others

By Distribution Channel:

  • Veterinary Hospitals
  • Veterinary Clinics
  • Pharmacies and Drug Stores
  • Others

By Region:

  • North America
  • Latin America
  • Europe
  • South Asia
  • East Asia
  • Oceania
  • Middle East and Africa (MEA)

Frequently Asked Questions

How large is the global farm animal drugs market?

The global farm animal drugs market was valued at around US$ 16.1 Billion in 2021.

What is the sales forecast for the farm animal drugs market through 2032?

Sales in the farm animal drugs market are set to witness a CAGR of 5.5% and the market is to be valued at around US$ 29.4 Billion by 2032.

What was the historical CAGR of the farm animal drugs market?

The global farm animal drugs market grew at 5.8% CAGR from 2012 to 2021.

Which countries would drive the demand for farm animal drugs in the forecast period?

The USA, Canada, China, the UK, and Russia are expected to surge the demand for farm animal drugs. Together, these countries are currently holding 51.8% of the market share.

What is the U.S. farm animal drugs market outlook?

The USA accounted for around 56.5% of the share in the North America farm animal drugs market in 2021.

Who are the top three manufacturers of farm animal drugs?

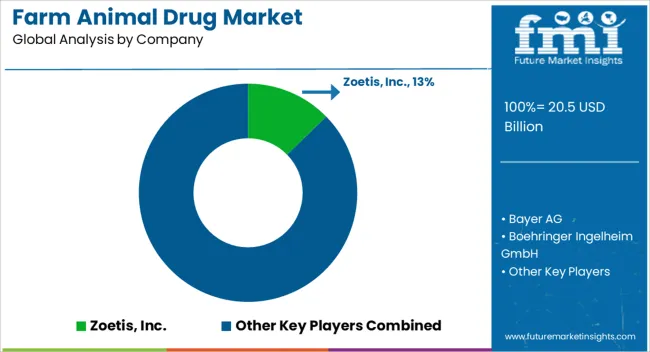
Bayer AG, Boehringer Ingelheim GmbH, and Zoetis, Inc. are the top three manufacturers in the farm animal drugs market.

How is the China farm animal drugs faring?

The China farm animal drugs market held a share of about 5.7% in 2021.

How is the Japan farm animal drugs progressing?

The Japan farm animal drugs market held a share of about 9.2% in 2021.

What is the expected growth rate of the farm animal drugs market in Germany?

The German farm animal drugs market is set to hold a share of around 2.7%.

Who are the key players operating in the farm animal drugs market?

Key players operating in the farm animal drugs market include Bayer AG, Boehringer Ingelheim GmbH, Zoetis, Inc., Ceva Santé Animale, Dechra Pharmaceuticals PLC, Elanco Animal Health (Sub. Eli Lilly), Merck Animal Health, Virbac SA, Vetoquinol SA, and Intas Animal Health among others.

Table of Content

1. Executive Summary | Farm Animal Drugs Market

    1.1. Global Market Outlook

    1.2. Demand Side Trends

    1.3. Supply Side Trends

    1.4. Analysis and Recommendations

2. Market Overview

    2.1. Market Coverage / Taxonomy

    2.2. Market Definition / Scope / Limitations

    2.3. Inclusions and Exclusions

3. Key Market Trends

    3.1. Key Trends Impacting the Market

    3.2. Drug Innovation / Development Trends

4. Key Success Factors

    4.1. Promotional Strategies Adopted by Key Manufacturers

    4.2. Key Regulations

    4.3. Reimbursement Scenario

    4.4. PESTEL Analysis

    4.5. Porter’s Analysis

5. Market Background

    5.1. Macro-Economic Factors

        5.1.1. Global GDP Growth Outlook

        5.1.2. Global Healthcare Expenditure Outlook

        5.1.3. Global Veterinary Medicine Market Outlook

    5.2. Forecast Factors - Relevance & Impact

        5.2.1. Technological Developments

        5.2.2. Introduction of Novel Formulations

        5.2.3. Rising Cases of Zoonotic Diseases

        5.2.4. Demand for Infection-Free Meat and Dairy Products

        5.2.5. Government Regulations

        5.2.6. Growing Incidence of Food-Borne Infections

        5.2.7. Rising Demand for Quality Pharmaceuticals

        5.2.8. Increasing Research and Development Activities

    5.3. Market Dynamics

        5.3.1. Drivers

        5.3.2. Restraints

        5.3.3. Opportunity Analysis

6. COVID-19 Crisis Analysis

    6.1. COVID-19 and Impact Analysis

        6.1.1. By Product

        6.1.2. By Animal

        6.1.3. By Route of Administration

        6.1.4. By Distribution Channel

        6.1.5. By Country

    6.2. 2021 Market Scenario

7. Global Market - Pricing Analysis

    7.1. Regional Pricing Analysis By Product

    7.2. Pricing Break-up

        7.2.1. Manufacturer-Level Pricing

        7.2.2. Distributor Level Pricing

    7.3. Global Average Pricing Analysis Benchmark

    7.4. Pricing Assumptions

8. Global Market Demand (in Value or Size in US$ Billion) Analysis 2012 to 2021 and Forecast, 2022 to 2032

    8.1. Historical Market Value (US$ Billion) Analysis, 2012 to 2021

    8.2. Current and Future Market Value (US$ Billion) Projections, 2022 to 2032

        8.2.1. Y-o-Y Growth Trend Analysis

        8.2.2. Absolute $ Opportunity Analysis

9. Global Market Analysis 2012 to 2021 and Forecast 2022 to 2032, By Product 

    9.1. Introduction / Key Findings

    9.2. Historical Market Size (US$ Billion) Analysis By Product, 2012 to 2021

    9.3. Current and Future Market Size (US$ Billion) Analysis and Forecast By Product, 2022 to 2032

        9.3.1. Anti-Infective

        9.3.2. Parasiticides

            9.3.2.1. Endo-parasiticides

            9.3.2.2. Ecto-parasiticides

            9.3.2.3. Endectocides

        9.3.3. Anti-Inflammatory

        9.3.4. Anesthetics

        9.3.5. Analgesics

        9.3.6. Hormones & Related Product

        9.3.7. Others

    9.4. Market Attractiveness Analysis By Product

10. Global Market Analysis 2012 to 2021 and Forecast 2022 to 2032, By Animal 

    10.1. Introduction / Key Findings

    10.2. Historical Market Size (US$ Billion) Analysis By Animal, 2012 to 2021

    10.3. Current and Future Market Size (US$ Billion) Analysis and Forecast By Animal, 2022 to 2032

        10.3.1. Livestock Animals

            10.3.1.1. Ruminants

            10.3.1.2. Swine

            10.3.1.3. Poultry

        10.3.2. Equine

    10.4. Market Attractiveness Analysis By Animal

11. Global Market Analysis 2012 to 2021 and Forecast 2022 to 2032, By Route of Administration

    11.1. Introduction / Key Findings

    11.2. Historical Market Size (US$ Billion) Analysis By Route of Administration, 2012 to 2021

    11.3. Current and Future Market Size (US$ Billion) Analysis and Forecast By Route of Administration, 2022 to 2032

        11.3.1. Oral

        11.3.2. Parenteral

        11.3.3. Topical

        11.3.4. Others

    11.4. Market Attractiveness Analysis By Route of Administration

12. Global Market Analysis 2012 to 2021 and Forecast 2022 to 2032, By Distribution Channel 

    12.1. Introduction / Key Findings

    12.2. Historical Market Size (US$ Billion) Analysis By Distribution Channel, 2012 to 2021

    12.3. Current and Future Market Size (US$ Billion) Analysis and Forecast By Distribution Channel, 2022 to 2032

        12.3.1. Veterinary Hospitals

        12.3.2. Veterinary Clinics

        12.3.3. Pharmacies and Drug Stores

        12.3.4. Others

    12.4. Market Attractiveness Analysis By Distribution Channel

13. Global Market Analysis 2012 to 2021 and Forecast 2022 to 2032, By Region

    13.1. Introduction / Key Findings

    13.2. Historical Market Size (US$ Billion) Analysis By Region, 2012 to 2021

    13.3. Current and Future Market Size (US$ Billion) Analysis and Forecast By Region, 2022 to 2032

        13.3.1. North America

        13.3.2. Latin America

        13.3.3. Europe

        13.3.4. East Asia

        13.3.5. South Asia

        13.3.6. Oceania

        13.3.7. Middle East and Africa

    13.4. Market Attractiveness Analysis By Region

14. North America Market Analysis 2012 to 2021 and Forecast 2022 to 2032

    14.1. Introduction

    14.2. Historical Market Size (US$ Billion) Trend Analysis By Market Taxonomy, 2012 to 2021

    14.3. Current and Future Market Size (US$ Billion) Analysis & Forecast By Market Taxonomy, 2022 to 2032

        14.3.1. By Country

            14.3.1.1. The USA

            14.3.1.2. Canada

        14.3.2. By Product

        14.3.3. By Animal

        14.3.4. By Route of Administration

        14.3.5. By Distribution Channel

    14.4. Market Attractiveness Analysis

        14.4.1. By Country

        14.4.2. By Product

        14.4.3. By Animal

        14.4.4. By Route of Administration

        14.4.5. By Distribution Channel

    14.5. Market Trends

    14.6. Key Market Participants - Intensity Mapping

    14.7. Drivers and Restraints - Impact Analysis

    14.8. Country-Level Analysis & Forecast

        14.8.1. The USA Market Analysis

            14.8.1.1. Introduction

            14.8.1.2. Market Analysis and Forecast By Market Taxonomy

                14.8.1.2.1. By Country

                14.8.1.2.2. By Product

                14.8.1.2.3. By Animal

                14.8.1.2.4. By Route of Administration

                14.8.1.2.5. By Distribution Channel

        14.8.2. Canada Market Analysis

            14.8.2.1. Introduction

            14.8.2.2. Market Analysis and Forecast By Market Taxonomy

                14.8.2.2.1. By Country

                14.8.2.2.2. By Product

                14.8.2.2.3. By Animal

                14.8.2.2.4. By Route of Administration

                14.8.2.2.5. By Distribution Channel

15. Latin America Market Analysis 2012 to 2021 and Forecast 2022 to 2032

    15.1. Introduction

    15.2. Historical Market Size (US$ Billion) Trend Analysis By Market Taxonomy, 2012 to 2021

    15.3. Current and Future Market Size (US$ Billion) Analysis & Forecast By Market Taxonomy, 2022 to 2032

        15.3.1. By Country

            15.3.1.1. Mexico

            15.3.1.2. Brazil

            15.3.1.3. Argentina

            15.3.1.4. Rest of Latin America

                15.3.1.4.1. By Country

                15.3.1.4.2. By Product

                15.3.1.4.3. By Animal

                15.3.1.4.4. By Route of Administration

                15.3.1.4.5. By Distribution Channel

    15.4. Market Attractiveness Analysis

                15.4.1. By Country

                15.4.2. By Product

                15.4.3. By Animal

                15.4.4. By Route of Administration

                15.4.5. By Distribution Channel

    15.5. Market Trends

    15.6. Key Market Participants - Intensity Mapping

    15.7. Drivers and Restraints - Impact Analysis

    15.8. Country-Level Analysis & Forecast

        15.8.1. Mexico Market Analysis

            15.8.1.1. Introduction

            15.8.1.2. Market Analysis and Forecast By Market Taxonomy

                15.8.1.2.1. By Product

                15.8.1.2.2. By Animal

                15.8.1.2.3. By Route of Administration

                15.8.1.2.4. By Distribution Channel

        15.8.2. Brazil Market Analysis

            15.8.2.1. Introduction

            15.8.2.2. Market Analysis and Forecast By Market Taxonomy

                15.8.2.2.1. By Country

                15.8.2.2.2. By Product

                15.8.2.2.3. By Animal

                15.8.2.2.4. By Route of Administration

                15.8.2.2.5. By Distribution Channel

        15.8.3. Argentina Market Analysis

            15.8.3.1. Introduction

            15.8.3.2. Market Analysis and Forecast By Market Taxonomy

                15.8.3.2.1. By Product

                15.8.3.2.2. By Animal

                15.8.3.2.3. By Route of Administration

                15.8.3.2.4. By Distribution Channel

16. Europe Market Analysis 2012 to 2021 and Forecast 2022 to 2032

    16.1. Introduction

    16.2. Historical Market Size (US$ Billion) Trend Analysis By Market Taxonomy, 2012 to 2021

    16.3. Current and Future Market Size (US$ Billion) Analysis & Forecast By Market Taxonomy, 2022 to 2032

        16.3.1. By Country

            16.3.1.1. Germany

            16.3.1.2. Italy

            16.3.1.3. France

            16.3.1.4. The UK

            16.3.1.5. Spain

            16.3.1.6. BENELUX

            16.3.1.7. Russia

            16.3.1.8. Rest of Europe

        16.3.2. By Product

        16.3.3. By Animal

        16.3.4. By Route of Administration

        16.3.5. By Distribution Channel

    16.4. Market Attractiveness Analysis

        16.4.1. By Country

        16.4.2. By Product

        16.4.3. By Animal

        16.4.4. By Route of Administration

        16.4.5. By Distribution Channel

    16.5. Market Trends

    16.6. Key Market Participants - Intensity Mapping

    16.7. Drivers and Restraints - Impact Analysis

    16.8. Country-Level Analysis & Forecast

        16.8.1. Germany Market Analysis

            16.8.1.1. Introduction

            16.8.1.2. Market Analysis and Forecast By Market Taxonomy

                16.8.1.2.1. By Product

                16.8.1.2.2. By Animal

                16.8.1.2.3. By Route of Administration

                16.8.1.2.4. By Distribution Channel

        16.8.2. Italy Market Analysis

            16.8.2.1. Introduction

            16.8.2.2. Market Analysis and Forecast By Market Taxonomy

                16.8.2.2.1. By Product

                16.8.2.2.2. By Animal

                16.8.2.2.3. By Route of Administration

                16.8.2.2.4. By Distribution Channel

        16.8.3. France Market Analysis

            16.8.3.1. Introduction

            16.8.3.2. Market Analysis and Forecast By Market Taxonomy

                16.8.3.2.1. By Product

                16.8.3.2.2. By Animal

                16.8.3.2.3. By Route of Administration

                16.8.3.2.4. By Distribution Channel

        16.8.4. The UK Market Analysis

            16.8.4.1. Introduction

            16.8.4.2. Market Analysis and Forecast By Market Taxonomy

                16.8.4.2.1. By Product

                16.8.4.2.2. By Animal

                16.8.4.2.3. By Route of Administration

                16.8.4.2.4. By Distribution Channel

        16.8.5. Spain Market Analysis

            16.8.5.1. Introduction

            16.8.5.2. Market Analysis and Forecast By Market Taxonomy

                16.8.5.2.1. By Product

                16.8.5.2.2. By Animal

                16.8.5.2.3. By Route of Administration

                16.8.5.2.4. By Distribution Channel

        16.8.6. BENELUX Market Analysis

            16.8.6.1. Introduction

            16.8.6.2. Market Analysis and Forecast By Market Taxonomy

                16.8.6.2.1. By Product

                16.8.6.2.2. By Animal

                16.8.6.2.3. By Route of Administration

                16.8.6.2.4. By Distribution Channel

        16.8.7. Russia Market Analysis

            16.8.7.1. Introduction

            16.8.7.2. Market Analysis and Forecast By Market Taxonomy

                16.8.7.2.1. By Product

                16.8.7.2.2. By Animal

                16.8.7.2.3. By Route of Administration

                16.8.7.2.4. By Distribution Channel

17. East Asia Market Analysis 2012 to 2021 and Forecast 2022 to 2032

    17.1. Introduction

    17.2. Historical Market Size (US$ Billion) Trend Analysis By Market Taxonomy, 2012 to 2021

    17.3. Current and Future Market Size (US$ Billion) Analysis & Forecast By Market Taxonomy, 2022 to 2032

        17.3.1. By Country

            17.3.1.1. China

            17.3.1.2. Japan

            17.3.1.3. South Korea

        17.3.2. By Product

        17.3.3. By Animal

        17.3.4. By Route of Administration

        17.3.5. By Distribution Channel

    17.4. Market Attractiveness Analysis

        17.4.1. By Country

        17.4.2. By Product

        17.4.3. By Animal

        17.4.4. By Route of Administration

        17.4.5. By Distribution Channel

    17.5. Market Trends

    17.6. Key Market Participants - Intensity Mapping

    17.7. Drivers and Restraints - Impact Analysis

    17.8. Country-Level Analysis & Forecast

        17.8.1. China Market Analysis

            17.8.1.1. Introduction

            17.8.1.2. Market Analysis and Forecast By Market Taxonomy

                17.8.1.2.1. By Product

                17.8.1.2.2. By Animal

                17.8.1.2.3. By Route of Administration

                17.8.1.2.4. By Distribution Channel

        17.8.2. Japan Market Analysis

            17.8.2.1. Introduction

            17.8.2.2. Market Analysis and Forecast By Market Taxonomy

                17.8.2.2.1. By Product

                17.8.2.2.2. By Animal

                17.8.2.2.3. By Route of Administration

                17.8.2.2.4. By Distribution Channel

        17.8.3. South Korea Market Analysis

            17.8.3.1. Introduction

            17.8.3.2. Market Analysis and Forecast By Market Taxonomy

                17.8.3.2.1. By Product

                17.8.3.2.2. By Animal

                17.8.3.2.3. By Route of Administration

                17.8.3.2.4. By Distribution Channel

18. South Asia Market Analysis 2012 to 2021 and Forecast 2022 to 2032

    18.1. Introduction

    18.2. Historical Market Size (US$ Billion) Trend Analysis By Market Taxonomy, 2012 to 2021

    18.3. Current and Future Market Size (US$ Billion) Analysis & Forecast By Market Taxonomy, 2022 to 2032

        18.3.1. By Country

            18.3.1.1. India

            18.3.1.2. Indonesia

            18.3.1.3. Malaysia

            18.3.1.4. Thailand

            18.3.1.5. Rest of South Asia

        18.3.2. By Product

        18.3.3. By Animal

        18.3.4. By Route of Administration

        18.3.5. By Distribution Channel

    18.4. Market Attractiveness Analysis

        18.4.1. By Country

        18.4.2. By Product

        18.4.3. By Animal

        18.4.4. By Route of Administration

        18.4.5. By Distribution Channel

    18.5. Market Trends

    18.6. Key Market Participants - Intensity Mapping

    18.7. Drivers and Restraints - Impact Analysis

    18.8. Country-Level Analysis & Forecast

        18.8.1. India Market Analysis

            18.8.1.1. Introduction

            18.8.1.2. Market Analysis and Forecast By Market Taxonomy

                18.8.1.2.1. By Product

                18.8.1.2.2. By Animal

                18.8.1.2.3. By Route of Administration

                18.8.1.2.4. By Distribution Channel

        18.8.2. Indonesia Market Analysis

            18.8.2.1. Introduction

            18.8.2.2. Market Analysis and Forecast By Market Taxonomy

                18.8.2.2.1. By Product

                18.8.2.2.2. By Animal

                18.8.2.2.3. By Route of Administration

                18.8.2.2.4. By Distribution Channel

        18.8.3. Malaysia Market Analysis

            18.8.3.1. Introduction

            18.8.3.2. Market Analysis and Forecast By Market Taxonomy

                18.8.3.2.1. By Product

                18.8.3.2.2. By Animal

                18.8.3.2.3. By Route of Administration

                18.8.3.2.4. By Distribution Channel

        18.8.4. Thailand Market Analysis

            18.8.4.1. Introduction

            18.8.4.2. Market Analysis and Forecast By Market Taxonomy

                18.8.4.2.1. By Product

                18.8.4.2.2. By Animal

                18.8.4.2.3. By Route of Administration

                18.8.4.2.4. By Distribution Channel

19. Oceania Market 2012 to 2021 and Forecast 2022-2032

    19.1. Introduction

    19.2. Historical Market Size (US$ Billion) Trend Analysis By Market Taxonomy, 2012 to 2021

    19.3. Current and Future Market Size (US$ Billion) Analysis & Forecast By Market Taxonomy, 2022 to 2032

        19.3.1. By Country

            19.3.1.1. Australia

            19.3.1.2. New Zealand

        19.3.2. By Product

        19.3.3. By Animal

        19.3.4. By Route of Administration

        19.3.5. By Distribution Channel

    19.4. Market Attractiveness Analysis

        19.4.1. By Country

        19.4.2. By Product

        19.4.3. By Animal

        19.4.4. By Route of Administration

        19.4.5. By Distribution Channel

    19.5. Key Market Participants - Intensity Mapping

    19.6. Drivers and Restraints - Impact Analysis

    19.7. Country-Level Analysis & Forecast

        19.7.1. Australia Market Analysis

            19.7.1.1. Introduction

            19.7.1.2. Market Analysis and Forecast By Market Taxonomy

                19.7.1.2.1. By Product

                19.7.1.2.2. By Animal

                19.7.1.2.3. By Route of Administration

                19.7.1.2.4. By Distribution Channel

        19.7.2. New Zealand Market Analysis

            19.7.2.1. Introduction

            19.7.2.2. Market Analysis and Forecast By Market Taxonomy

                19.7.2.2.1. By Product

                19.7.2.2.2. By Animal

                19.7.2.2.3. By Route of Administration

                19.7.2.2.4. By Distribution Channel

20. Middle East and Africa (MEA) Market Analysis 2012 to 2021 and Forecast 2022 to 2032

    20.1. Introduction

    20.2. Historical Market Size (US$ Billion) Trend Analysis By Market Taxonomy, 2012 to 2021

    20.3. Current and Future Market Size (US$ Billion) Analysis & Forecast By Market Taxonomy, 2022 to 2032

        20.3.1. By Country

            20.3.1.1. GCC Countries

            20.3.1.2. Turkey

            20.3.1.3. South Africa

            20.3.1.4. North Africa

            20.3.1.5. Rest of Middle East and Africa

        20.3.2. By Product

        20.3.3. By Animal

        20.3.4. By Route of Administration

        20.3.5. By Distribution Channel

    20.4. Market Attractiveness Analysis

        20.4.1. By Country

        20.4.2. By Product

        20.4.3. By Animal

        20.4.4. By Route of Administration

        20.4.5. By Distribution Channel

    20.5. Market Trends

    20.6. Key Market Participants - Intensity Mapping

    20.7. Drivers and Restraints - Impact Analysis

    20.8. Country-Level Analysis & Forecast

        20.8.1. GCC Countries Market Analysis

            20.8.1.1. Introduction

            20.8.1.2. Market Analysis and Forecast By Market Taxonomy

                20.8.1.2.1. By Product

                20.8.1.2.2. By Animal

                20.8.1.2.3. By Route of Administration

                20.8.1.2.4. By Distribution Channel

        20.8.2. Turkey Market Analysis

            20.8.2.1. Introduction

            20.8.2.2. Market Analysis and Forecast By Market Taxonomy

                20.8.2.2.1. By Product

                20.8.2.2.2. By Animal

                20.8.2.2.3. By Route of Administration

                20.8.2.2.4. By Distribution Channel

        20.8.3. South Africa Market Analysis

            20.8.3.1. Introduction

            20.8.3.2. Market Analysis and Forecast By Market Taxonomy

                20.8.3.2.1. By Product

                20.8.3.2.2. By Animal

                20.8.3.2.3. By Route of Administration

                20.8.3.2.4. By Distribution Channel

        20.8.4. North Africa Market Analysis

            20.8.4.1. Introduction

            20.8.4.2. Market Analysis and Forecast By Market Taxonomy

                20.8.4.2.1. By Product

                20.8.4.2.2. By Animal

                20.8.4.2.3. By Route of Administration

                20.8.4.2.4. By Distribution Channel

21. Market Structure Analysis

    21.1. Market Analysis By Tier of Companies

    21.2. Market Concentration

    21.3. Market Share Analysis of Top Players

    21.4. Market Presence Analysis

22. Competition Analysis

    22.1. Competition Dashboard

    22.2. Competition Benchmarking

    22.3. Competition Deep Dive

        22.3.1. Bayer AG

            22.3.1.1. Overview

            22.3.1.2. Product Portfolio

            22.3.1.3. Sales Footprint

            22.3.1.4. Key Financials

            22.3.1.5. SWOT Analysis

            22.3.1.6. Strategic Overview

        22.3.2. Boehringer Ingelheim GmbH

            22.3.2.1. Overview

            22.3.2.2. Product Portfolio

            22.3.2.3. Sales Footprint

            22.3.2.4. Key Financials

            22.3.2.5. SWOT Analysis

            22.3.2.6. Strategic Overview

        22.3.3. Zoetis, Inc.

            22.3.3.1. Overview

            22.3.3.2. Product Portfolio

            22.3.3.3. Sales Footprint

            22.3.3.4. Key Financials

            22.3.3.5. SWOT Analysis

            22.3.3.6. Strategic Overview

        22.3.4. Ceva Santé Animale

            22.3.4.1. Overview

            22.3.4.2. Product Portfolio

            22.3.4.3. Sales Footprint

            22.3.4.4. Key Financials

            22.3.4.5. SWOT Analysis

            22.3.4.6. Strategic Overview

        22.3.5. Dechra Pharmaceuticals PLC

            22.3.5.1. Overview

            22.3.5.2. Product Portfolio

            22.3.5.3. Sales Footprint

            22.3.5.4. Key Financials

            22.3.5.5. SWOT Analysis

            22.3.5.6. Strategic Overview

        22.3.6. Elanco Animal Health (Sub. Eli Lilly)

            22.3.6.1. Overview

            22.3.6.2. Product Portfolio

            22.3.6.3. Sales Footprint

            22.3.6.4. Key Financials

            22.3.6.5. SWOT Analysis

            22.3.6.6. Strategic Overview

        22.3.7. Merck Animal Health

            22.3.7.1. Overview

            22.3.7.2. Product Portfolio

            22.3.7.3. Sales Footprint

            22.3.7.4. Key Financials

            22.3.7.5. SWOT Analysis

            22.3.7.6. Strategic Overview

        22.3.8. Virbac SA

            22.3.8.1. Overview

            22.3.8.2. Product Portfolio

            22.3.8.3. Sales Footprint

            22.3.8.4. Key Financials

            22.3.8.5. SWOT Analysis

            22.3.8.6. Strategic Overview

        22.3.9. Vetoquinol SA

            22.3.9.1. Overview

            22.3.9.2. Product Portfolio

            22.3.9.3. Sales Footprint

            22.3.9.4. Key Financials

            22.3.9.5. SWOT Analysis

            22.3.9.6. Strategic Overview

        22.3.10. Intas Animal Health

            22.3.10.1. Overview

            22.3.10.2. Product Portfolio

            22.3.10.3. Sales Footprint

            22.3.10.4. Key Financials

            22.3.10.5. SWOT Analysis

            22.3.10.6. Strategic Overview

        22.3.11. Alembic Animal Health

            22.3.11.1. Overview

            22.3.11.2. Product Portfolio

            22.3.11.3. Sales Footprint

            22.3.11.4. Key Financials

            22.3.11.5. SWOT Analysis

            22.3.11.6. Strategic Overview

        22.3.12. Sequent Scientific

            22.3.12.1. Overview

            22.3.12.2. Product Portfolio

            22.3.12.3. Sales Footprint

            22.3.12.4. Key Financials

            22.3.12.5. SWOT Analysis

            22.3.12.6. Strategic Overview

        22.3.13. Hester Biosciences

            22.3.13.1. Overview

            22.3.13.2. Product Portfolio

            22.3.13.3. Sales Footprint

            22.3.13.4. Key Financials

            22.3.13.5. SWOT Analysis

            22.3.13.6. Strategic Overview

        22.3.14. Ashish Life Sciences

            22.3.14.1. Overview

            22.3.14.2. Product Portfolio

            22.3.14.3. Sales Footprint

            22.3.14.4. Key Financials

            22.3.14.5. SWOT Analysis

            22.3.14.6. Strategic Overview

        22.3.15. Ouro Fino Saude Animal (Ourofino)

            22.3.15.1. Overview

            22.3.15.2. Product Portfolio

            22.3.15.3. Sales Footprint

            22.3.15.4. Key Financials

            22.3.15.5. SWOT Analysis

            22.3.15.6. Strategic Overview

        22.3.16. Zydus Animal Health (Sub. Cadila Healthcare Ltd)

            22.3.16.1. Overview

            22.3.16.2. Product Portfolio

            22.3.16.3. Sales Footprint

            22.3.16.4. Key Financials

            22.3.16.5. SWOT Analysis

            22.3.16.6. Strategic Overview

        22.3.17. Phibro Animal Health Corporation

            22.3.17.1. Overview

            22.3.17.2. Product Portfolio

            22.3.17.3. Sales Footprint

            22.3.17.4. Key Financials

            22.3.17.5. SWOT Analysis

            22.3.17.6. Strategic Overview

        22.3.18. Nippon Zenyaku Kogyo Co., Ltd

            22.3.18.1. Overview

            22.3.18.2. Product Portfolio

            22.3.18.3. Sales Footprint

            22.3.18.4. Key Financials

            22.3.18.5. SWOT Analysis

            22.3.18.6. Strategic Overview

        22.3.19. Norbrook

            22.3.19.1. Overview

            22.3.19.2. Product Portfolio

            22.3.19.3. Sales Footprint

            22.3.19.4. Key Financials

            22.3.19.5. SWOT Analysis

            22.3.19.6. Strategic Overview

        22.3.20. Kyoritsu Seiyaku Corporation

            22.3.20.1. Overview

            22.3.20.2. Product Portfolio

            22.3.20.3. Sales Footprint

            22.3.20.4. Key Financials

            22.3.20.5. SWOT Analysis

            22.3.20.6. Strategic Overview

23. Assumptions and Acronyms Used

24. Research Methodology

Don't pay for what you don't need

Customize your report by selecting specific countries or regions and save 30%!

List of Tables

Table 1: Global Market Value (US$ Billion) Forecast by Region, 2012 to 2032

Table 2: Global Market Value (US$ Billion) Forecast by Product, 2012 to 2032

Table 3: Global Market Value (US$ Billion) Forecast by Animal, 2012 to 2032

Table 4: Global Market Value (US$ Billion) Forecast by Route of Administration, 2012 to 2032

Table 5: Global Market Value (US$ Billion) Forecast by Distribution Channel, 2012 to 2032

Table 6: North America Market Value (US$ Billion) Forecast by Country, 2012 to 2032

Table 7: North America Market Value (US$ Billion) Forecast by Product, 2012 to 2032

Table 8: North America Market Value (US$ Billion) Forecast by Animal, 2012 to 2032

Table 9: North America Market Value (US$ Billion) Forecast by Route of Administration, 2012 to 2032

Table 10: North America Market Value (US$ Billion) Forecast by Distribution Channel, 2012 to 2032

Table 11: Latin America Market Value (US$ Billion) Forecast by Country, 2012 to 2032

Table 12: Latin America Market Value (US$ Billion) Forecast by Product, 2012 to 2032

Table 13: Latin America Market Value (US$ Billion) Forecast by Animal, 2012 to 2032

Table 14: Latin America Market Value (US$ Billion) Forecast by Route of Administration, 2012 to 2032

Table 15: Latin America Market Value (US$ Billion) Forecast by Distribution Channel, 2012 to 2032

Table 16: Europe Market Value (US$ Billion) Forecast by Country, 2012 to 2032

Table 17: Europe Market Value (US$ Billion) Forecast by Product, 2012 to 2032

Table 18: Europe Market Value (US$ Billion) Forecast by Animal, 2012 to 2032

Table 19: Europe Market Value (US$ Billion) Forecast by Route of Administration, 2012 to 2032

Table 20: Europe Market Value (US$ Billion) Forecast by Distribution Channel, 2012 to 2032

Table 21: East Asia Market Value (US$ Billion) Forecast by Country, 2012 to 2032

Table 22: East Asia Market Value (US$ Billion) Forecast by Product, 2012 to 2032

Table 23: East Asia Market Value (US$ Billion) Forecast by Animal, 2012 to 2032

Table 24: East Asia Market Value (US$ Billion) Forecast by Route of Administration, 2012 to 2032

Table 25: East Asia Market Value (US$ Billion) Forecast by Distribution Channel, 2012 to 2032

Table 26: South Asia Market Value (US$ Billion) Forecast by Country, 2012 to 2032

Table 27: South Asia Market Value (US$ Billion) Forecast by Product, 2012 to 2032

Table 28: South Asia Market Value (US$ Billion) Forecast by Animal, 2012 to 2032

Table 29: South Asia Market Value (US$ Billion) Forecast by Route of Administration, 2012 to 2032

Table 30: South Asia Market Value (US$ Billion) Forecast by Distribution Channel, 2012 to 2032

Table 31: Oceania Market Value (US$ Billion) Forecast by Country, 2012 to 2032

Table 32: Oceania Market Value (US$ Billion) Forecast by Product, 2012 to 2032

Table 33: Oceania Market Value (US$ Billion) Forecast by Animal, 2012 to 2032

Table 34: Oceania Market Value (US$ Billion) Forecast by Route of Administration, 2012 to 2032

Table 35: Oceania Market Value (US$ Billion) Forecast by Distribution Channel, 2012 to 2032

Table 36: MEA Market Value (US$ Billion) Forecast by Country, 2012 to 2032

Table 37: MEA Market Value (US$ Billion) Forecast by Product, 2012 to 2032

Table 38: MEA Market Value (US$ Billion) Forecast by Animal, 2012 to 2032

Table 39: MEA Market Value (US$ Billion) Forecast by Route of Administration, 2012 to 2032

Table 40: MEA Market Value (US$ Billion) Forecast by Distribution Channel, 2012 to 2032
Sabyasachi Ghosh
Sabyasachi Ghosh

Principal Consultant

Talk to Analyst

Find your sweet spots for generating winning opportunities in this market.

List of Charts

Figure 1: Global Market Value (US$ Billion) by Product, 2022 to 2032

Figure 2: Global Market Value (US$ Billion) by Animal, 2022 to 2032

Figure 3: Global Market Value (US$ Billion) by Route of Administration, 2022 to 2032

Figure 4: Global Market Value (US$ Billion) by Distribution Channel, 2022 to 2032

Figure 5: Global Market Value (US$ Billion) by Region, 2022 to 2032

Figure 6: Global Market Value (US$ Billion) Analysis by Region, 2012 to 2032

Figure 7: Global Market Value Share (%) Analysis by Region, 2022 to 2032

Figure 8: Global Market Y-o-Y Growth (%) Projections by Region, 2022 to 2032

Figure 9: Global Market Value (US$ Billion) Analysis by Product, 2012 to 2032

Figure 10: Global Market Value Share (%) Analysis by Product, 2022 to 2032

Figure 11: Global Market Y-o-Y Growth (%) Projections by Product, 2022 to 2032

Figure 12: Global Market Value (US$ Billion) Analysis by Animal, 2012 to 2032

Figure 13: Global Market Value Share (%) Analysis by Animal, 2022 to 2032

Figure 14: Global Market Y-o-Y Growth (%) Projections by Animal, 2022 to 2032

Figure 15: Global Market Value (US$ Billion) Analysis by Route of Administration, 2012 to 2032

Figure 16: Global Market Value Share (%) Analysis by Route of Administration, 2022 to 2032

Figure 17: Global Market Y-o-Y Growth (%) Projections by Route of Administration, 2022 to 2032

Figure 18: Global Market Value (US$ Billion) Analysis by Distribution Channel, 2012 to 2032

Figure 19: Global Market Value Share (%) Analysis by Distribution Channel, 2022 to 2032

Figure 20: Global Market Y-o-Y Growth (%) Projections by Distribution Channel, 2022 to 2032

Figure 21: Global Market Attractiveness by Product, 2022 to 2032

Figure 22: Global Market Attractiveness by Animal, 2022 to 2032

Figure 23: Global Market Attractiveness by Route of Administration, 2022 to 2032

Figure 24: Global Market Attractiveness by Distribution Channel, 2022 to 2032

Figure 25: Global Market Attractiveness by Region, 2022 to 2032

Figure 26: North America Market Value (US$ Billion) by Product, 2022 to 2032

Figure 27: North America Market Value (US$ Billion) by Animal, 2022 to 2032

Figure 28: North America Market Value (US$ Billion) by Route of Administration, 2022 to 2032

Figure 29: North America Market Value (US$ Billion) by Distribution Channel, 2022 to 2032

Figure 30: North America Market Value (US$ Billion) by Country, 2022 to 2032

Figure 31: North America Market Value (US$ Billion) Analysis by Country, 2012 to 2032

Figure 32: North America Market Value Share (%) Analysis by Country, 2022 to 2032

Figure 33: North America Market Y-o-Y Growth (%) Projections by Country, 2022 to 2032

Figure 34: North America Market Value (US$ Billion) Analysis by Product, 2012 to 2032

Figure 35: North America Market Value Share (%) Analysis by Product, 2022 to 2032

Figure 36: North America Market Y-o-Y Growth (%) Projections by Product, 2022 to 2032

Figure 37: North America Market Value (US$ Billion) Analysis by Animal, 2012 to 2032

Figure 38: North America Market Value Share (%) Analysis by Animal, 2022 to 2032

Figure 39: North America Market Y-o-Y Growth (%) Projections by Animal, 2022 to 2032

Figure 40: North America Market Value (US$ Billion) Analysis by Route of Administration, 2012 to 2032

Figure 41: North America Market Value Share (%) Analysis by Route of Administration, 2022 to 2032

Figure 42: North America Market Y-o-Y Growth (%) Projections by Distribution Channel, 2022 to 2032

Figure 43: North America Market Value (US$ Billion) Analysis by Distribution Channel, 2012 to 2032

Figure 44: North America Market Value Share (%) Analysis by Distribution Channel, 2022 to 2032

Figure 45: North America Market Y-o-Y Growth (%) Projections by Distribution Channel, 2022 to 2032

Figure 46: North America Market Attractiveness by Product, 2022 to 2032

Figure 47: North America Market Attractiveness by Animal, 2022 to 2032

Figure 48: North America Market Attractiveness by Route of Administration, 2022 to 2032

Figure 49: North America Market Attractiveness by Distribution Channel, 2022 to 2032

Figure 50: North America Market Attractiveness by Country, 2022 to 2032

Figure 51: Latin America Market Value (US$ Billion) by Product, 2022 to 2032

Figure 52: Latin America Market Value (US$ Billion) by Animal, 2022 to 2032

Figure 53: Latin America Market Value (US$ Billion) by Route of Administration, 2022 to 2032

Figure 54: Latin America Market Value (US$ Billion) by Distribution Channel, 2022 to 2032

Figure 55: Latin America Market Value (US$ Billion) by Country, 2022 to 2032

Figure 56: Latin America Market Value (US$ Billion) Analysis by Country, 2012 to 2032

Figure 57: Latin America Market Value Share (%) Analysis by Country, 2022 to 2032

Figure 58: Latin America Market Y-o-Y Growth (%) Projections by Country, 2022 to 2032

Figure 59: Latin America Market Value (US$ Billion) Analysis by Product, 2012 to 2032

Figure 60: Latin America Market Value Share (%) Analysis by Product, 2022 to 2032

Figure 61: Latin America Market Y-o-Y Growth (%) Projections by Product, 2022 to 2032

Figure 62: Latin America Market Value (US$ Billion) Analysis by Animal, 2012 to 2032

Figure 63: Latin America Market Value Share (%) Analysis by Animal, 2022 to 2032

Figure 64: Latin America Market Y-o-Y Growth (%) Projections by Animal, 2022 to 2032

Figure 65: Latin America Market Value (US$ Billion) Analysis by Route of Administration, 2012 to 2032

Figure 66: Latin America Market Value Share (%) Analysis by Route of Administration, 2022 to 2032

Figure 67: Latin America Market Y-o-Y Growth (%) Projections by Route of Administration, 2022 to 2032

Figure 68: Latin America Market Value (US$ Billion) Analysis by Distribution Channel, 2012 to 2032

Figure 69: Latin America Market Value Share (%) Analysis by Distribution Channel, 2022 to 2032

Figure 70: Latin America Market Y-o-Y Growth (%) Projections by Distribution Channel, 2022 to 2032

Figure 71: Latin America Market Attractiveness by Product, 2022 to 2032

Figure 72: Latin America Market Attractiveness by Animal, 2022 to 2032

Figure 73: Latin America Market Attractiveness by Route of Administration, 2022 to 2032

Figure 74: Latin America Market Attractiveness by Distribution Channel, 2022 to 2032

Figure 75: Latin America Market Attractiveness by Country, 2022 to 2032

Figure 76: Europe Market Value (US$ Billion) by Product, 2022 to 2032

Figure 77: Europe Market Value (US$ Billion) by Animal, 2022 to 2032

Figure 78: Europe Market Value (US$ Billion) by Route of Administration, 2022 to 2032

Figure 79: Europe Market Value (US$ Billion) by Distribution Channel, 2022 to 2032

Figure 80: Europe Market Value (US$ Billion) by Country, 2022 to 2032

Figure 81: Europe Market Value (US$ Billion) Analysis by Country, 2012 to 2032

Figure 82: Europe Market Value Share (%) Analysis by Country, 2022 to 2032

Figure 83: Europe Market Y-o-Y Growth (%) Projections by Country, 2022 to 2032

Figure 84: Europe Market Value (US$ Billion) Analysis by Product, 2012 to 2032

Figure 85: Europe Market Value Share (%) Analysis by Product, 2022 to 2032

Figure 86: Europe Market Y-o-Y Growth (%) Projections by Product, 2022 to 2032

Figure 87: Europe Market Value (US$ Billion) Analysis by Animal, 2012 to 2032

Figure 88: Europe Market Value Share (%) Analysis by Animal, 2022 to 2032

Figure 89: Europe Market Y-o-Y Growth (%) Projections by Animal, 2022 to 2032

Figure 90: Europe Market Value (US$ Billion) Analysis by Route of Administration, 2012 to 2032

Figure 91: Europe Market Value Share (%) Analysis by Route of Administration, 2022 to 2032

Figure 92: Europe Market Y-o-Y Growth (%) Projections by Route of Administration, 2022 to 2032

Figure 93: Europe Market Value (US$ Billion) Analysis by Distribution Channel, 2012 to 2032

Figure 94: Europe Market Value Share (%) Analysis by Distribution Channel, 2022 to 2032

Figure 95: Europe Market Y-o-Y Growth (%) Projections by Distribution Channel, 2022 to 2032

Figure 96: Europe Market Attractiveness by Product, 2022 to 2032

Figure 97: Europe Market Attractiveness by Animal, 2022 to 2032

Figure 98: Europe Market Attractiveness by Route of Administration, 2022 to 2032

Figure 99: Europe Market Attractiveness by Distribution Channel, 2022 to 2032

Figure 100: Europe Market Attractiveness by Country, 2022 to 2032

Figure 101: East Asia Market Value (US$ Billion) by Product, 2022 to 2032

Figure 102: East Asia Market Value (US$ Billion) by Animal, 2022 to 2032

Figure 103: East Asia Market Value (US$ Billion) by Route of Administration, 2022 to 2032

Figure 104: East Asia Market Value (US$ Billion) by Distribution Channel, 2022 to 2032

Figure 105: East Asia Market Value (US$ Billion) by Country, 2022 to 2032

Figure 106: East Asia Market Value (US$ Billion) Analysis by Country, 2012 to 2032

Figure 107: East Asia Market Value Share (%) Analysis by Country, 2022 to 2032

Figure 108: East Asia Market Y-o-Y Growth (%) Projections by Country, 2022 to 2032

Figure 109: East Asia Market Value (US$ Billion) Analysis by Product, 2012 to 2032

Figure 110: East Asia Market Value Share (%) Analysis by Product, 2022 to 2032

Figure 111: East Asia Market Y-o-Y Growth (%) Projections by Product, 2022 to 2032

Figure 112: East Asia Market Value (US$ Billion) Analysis by Animal, 2012 to 2032

Figure 113: East Asia Market Value Share (%) Analysis by Animal, 2022 to 2032

Figure 114: East Asia Market Y-o-Y Growth (%) Projections by Animal, 2022 to 2032

Figure 115: East Asia Market Value (US$ Billion) Analysis by Route of Administration, 2012 to 2032

Figure 116: East Asia Market Value Share (%) Analysis by Route of Administration, 2022 to 2032

Figure 117: East Asia Market Y-o-Y Growth (%) Projections by Route of Administration, 2022 to 2032

Figure 118: East Asia Market Value (US$ Billion) Analysis by Distribution Channel, 2012 to 2032

Figure 119: East Asia Market Value Share (%) Analysis by Distribution Channel, 2022 to 2032

Figure 120: East Asia Market Y-o-Y Growth (%) Projections by Distribution Channel, 2022 to 2032

Figure 121: East Asia Market Attractiveness by Product, 2022 to 2032

Figure 122: East Asia Market Attractiveness by Animal, 2022 to 2032

Figure 123: East Asia Market Attractiveness by Route of Administration, 2022 to 2032

Figure 124: East Asia Market Attractiveness by End user, 2022 to 2032

Figure 125: East Asia Market Attractiveness by Country, 2022 to 2032

Figure 126: South Asia Market Value (US$ Billion) by Product, 2022 to 2032

Figure 127: South Asia Market Value (US$ Billion) by Animal, 2022 to 2032

Figure 128: South Asia Market Value (US$ Billion) by Route of Administration, 2022 to 2032

Figure 129: South Asia Market Value (US$ Billion) by Distribution Channel, 2022 to 2032

Figure 130: South Asia Market Value (US$ Billion) by Country, 2022 to 2032

Figure 131: South Asia Market Value (US$ Billion) Analysis by Country, 2012 to 2032

Figure 132: South Asia Market Value Share (%) Analysis by Country, 2022 to 2032

Figure 133: South Asia Market Y-o-Y Growth (%) Projections by Country, 2022 to 2032

Figure 134: South Asia Market Value (US$ Billion) Analysis by Product, 2012 to 2032

Figure 135: South Asia Market Value Share (%) Analysis by Product, 2022 to 2032

Figure 136: South Asia Market Y-o-Y Growth (%) Projections by Product, 2022 to 2032

Figure 137: South Asia Market Value (US$ Billion) Analysis by Animal, 2012 to 2032

Figure 138: South Asia Market Value Share (%) Analysis by Animal, 2022 to 2032

Figure 139: South Asia Market Y-o-Y Growth (%) Projections by Animal, 2022 to 2032

Figure 140: South Asia Market Value (US$ Billion) Analysis by Route of Administration, 2012 to 2032

Figure 141: South Asia Market Value Share (%) Analysis by Route of Administration, 2022 to 2032

Figure 142: South Asia Market Y-o-Y Growth (%) Projections by Route of Administration, 2022 to 2032

Figure 143: South Asia Market Value (US$ Billion) Analysis by Distribution Channel, 2012 to 2032

Figure 144: South Asia Market Value Share (%) Analysis by Distribution Channel, 2022 to 2032

Figure 145: South Asia Market Y-o-Y Growth (%) Projections by Distribution Channel, 2022 to 2032

Figure 146: South Asia Market Attractiveness by Product, 2022 to 2032

Figure 147: South Asia Market Attractiveness by Animal, 2022 to 2032

Figure 148: South Asia Market Attractiveness by Route of Administration, 2022 to 2032

Figure 149: South Asia Market Attractiveness by Distribution Channel, 2022 to 2032

Figure 150: South Asia Market Attractiveness by Country, 2022 to 2032

Figure 151: Oceania Market Value (US$ Billion) by Product, 2022 to 2032

Figure 152: Oceania Market Value (US$ Billion) by Animal, 2022 to 2032

Figure 153: Oceania Market Value (US$ Billion) by Route of Administration, 2022 to 2032

Figure 154: Oceania Market Value (US$ Billion) by Distribution Channel, 2022 to 2032

Figure 155: Oceania Market Value (US$ Billion) by Country, 2022 to 2032

Figure 156: Oceania Market Value (US$ Billion) Analysis by Country, 2012 to 2032

Figure 157: Oceania Market Value Share (%) Analysis by Country, 2022 to 2032

Figure 158: Oceania Market Y-o-Y Growth (%) Projections by Country, 2022 to 2032

Figure 159: Oceania Market Value (US$ Billion) Analysis by Product, 2012 to 2032

Figure 160: Oceania Market Value Share (%) Analysis by Product, 2022 to 2032

Figure 161: Oceania Market Y-o-Y Growth (%) Projections by Product, 2022 to 2032

Figure 162: Oceania Market Value (US$ Billion) Analysis by Animal, 2012 to 2032

Figure 163: Oceania Market Value Share (%) Analysis by Animal, 2022 to 2032

Figure 164: Oceania Market Y-o-Y Growth (%) Projections by Animal, 2022 to 2032

Figure 165: Oceania Market Value (US$ Billion) Analysis by Route of Administration, 2012 to 2032

Figure 166: Oceania Market Value Share (%) Analysis by Route of Administration, 2022 to 2032

Figure 167: Oceania Market Y-o-Y Growth (%) Projections by Route of Administration, 2022 to 2032

Figure 168: Oceania Market Value (US$ Billion) Analysis by Distribution Channel, 2012 to 2032

Figure 169: Oceania Market Value Share (%) Analysis by Distribution Channel, 2022 to 2032

Figure 170: Oceania Market Y-o-Y Growth (%) Projections by Distribution Channel, 2022 to 2032

Figure 171: Oceania Market Attractiveness by Product, 2022 to 2032

Figure 172: Oceania Market Attractiveness by Animal, 2022 to 2032

Figure 173: Oceania Market Attractiveness by Route of Administration, 2022 to 2032

Figure 174: Oceania Market Attractiveness by Distribution Channel, 2022 to 2032

Figure 175: Oceania Market Attractiveness by Country, 2022 to 2032

Figure 176: MEA Market Value (US$ Billion) by Product, 2022 to 2032

Figure 177: MEA Market Value (US$ Billion) by Animal, 2022 to 2032

Figure 178: MEA Market Value (US$ Billion) by Route of Administration, 2022 to 2032

Figure 179: MEA Market Value (US$ Billion) by Distribution Channel, 2022 to 2032

Figure 180: MEA Market Value (US$ Billion) by Country, 2022 to 2032

Figure 181: MEA Market Value (US$ Billion) Analysis by Country, 2012 to 2032

Figure 182: MEA Market Value Share (%) Analysis by Country, 2022 to 2032

Figure 183: MEA Market Y-o-Y Growth (%) Projections by Country, 2022 to 2032

Figure 184: MEA Market Value (US$ Billion) Analysis by Product, 2012 to 2032

Figure 185: MEA Market Value Share (%) Analysis by Product, 2022 to 2032

Figure 186: MEA Market Y-o-Y Growth (%) Projections by Product, 2022 to 2032

Figure 187: MEA Market Value (US$ Billion) Analysis by Animal, 2012 to 2032

Figure 188: MEA Market Value Share (%) Analysis by Animal, 2022 to 2032

Figure 189: MEA Market Y-o-Y Growth (%) Projections by Animal, 2022 to 2032

Figure 190: MEA Market Value (US$ Billion) Analysis by Route of Administration, 2012 to 2032

Figure 191: MEA Market Value Share (%) Analysis by Route of Administration, 2022 to 2032

Figure 192: MEA Market Y-o-Y Growth (%) Projections by Route of Administration, 2022 to 2032

Figure 193: MEA Market Value (US$ Billion) Analysis by Distribution Channel, 2012 to 2032

Figure 194: MEA Market Value Share (%) Analysis by Distribution Channel, 2022 to 2032

Figure 195: MEA Market Y-o-Y Growth (%) Projections by Distribution Channel, 2022 to 2032

Figure 196: MEA Market Attractiveness by Product, 2022 to 2032

Figure 197: MEA Market Attractiveness by Animal, 2022 to 2032

Figure 198: MEA Market Attractiveness by Route of Administration, 2022 to 2032

Figure 199: MEA Market Attractiveness by Distribution Channel, 2022 to 2032

Figure 200: MEA Market Attractiveness by Country, 2022 to 2032

Recommendations

Healthcare

Veterinary Biologics Market

Published : January 2024

Healthcare

Equine Veterinary Therapeutics Market

Published : August 2023

Healthcare

Veterinary Auto-Immune Therapeutics Market

Published : July 2023

Healthcare

Veterinary Vaccines Market

Published : January 2023

Explore Healthcare Insights

View Reports