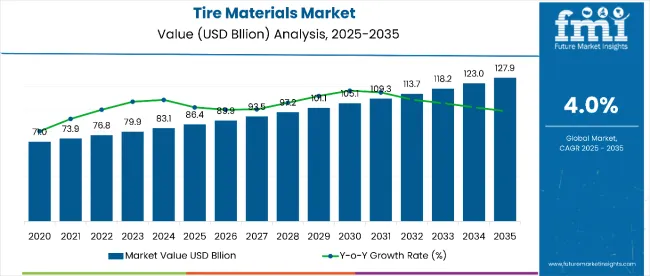
The global tire materials market reached USD 74,770.0 million in 2020. Worldwide demand for tire materials saw a 2.8% year-on-year growth in 2022, suggesting an expansion of the market to USD 78,960.0 million in 2022. Projections for the period between 2025 and 2035 indicate a 4.0% compound annual growth rate (CAGR) for global tire materials sales, resulting in a market size of USD 127.9 billion by the end of 2035.
The market for natural rubber material type is growing at an exponential rate owing to durability and abrasion resistance offered by natural rubber. Natural rubber provides specific performance characteristics to tires. It is especially good for tear and fatigue crack resistance. Some of the beneficial; properties of natural rubber include durability and abrasion resistance
Natural rubber is predominantly derived from para rubber trees. Thus, adoption of natural rubber acts as a catalyst in reducing global carbon footprint. Alongside, tire manufacturers are achieving significant savings in material input costs and are focusing on development of high-performance tires i.e. green tires.
All these attributes are driving the demand for adoption of natural rubber tire material. Natural rubber offers durability and abrasion resistance as compared to synthetic rubber tire material, thus escalating the demand for natural rubber tire material.
The demand for tires has witnessed exponential growth owing to increasing population and expansion of motorization. Natural rubber is the prominent tire material and several key-players in the tire production have come up with different strategies to alleviate the concentration of natural rubber production and stabilize its supply.
For instance, the Bridgestone Group has committed to a pair of approaches: “Continuous utilization and productivity improvement of conventional sources” and “Diversification into new sources.” These factors collectively drive the demand and utilization of natural rubber in the tire production.
| Attributes | Key Insights |
|---|---|
| Estimated Value (2025) | USD 86.44 billion |
| Projected Size (2035) | USD 127.9 billion |
| Value-based CAGR (2025 to 2035) | 4.0% |
Pneumatic tire type is the dominant in the global tire materials market. The ever-rising fleet size and automotive production will assist the pneumatic tire segment to dominate the tire materials market. Tubed tires are preferred, owing to their cost. HCVs and LCVs mainly prefer tubed tires whereas tubeless tires play an important role in 2 wheelers.
Pneumatic tires are widely used in outdoor applications and are better suited for uneven terrain. These tires are proven to offer better shock absorption that in turn ensures smoother ride on uneven terrain. All these factors make pneumatic tires viable choice as outdoor tires.
Versatility and improved traction control on uneven/rough surfaces make pneumatic tires an ideal choice for indoor and outdoor applications. Tire construction of pneumatic tires is another factor that drives market share in the tire materials market. For example, rubber tread and large framework enhances the pneumatic tire capability for navigating on uneven surfaces effectively as compared over solid tires.
While federal regulation is still evolving, California has taken the lead in targeting specific tire chemicals, particularly 6PPD. The regulatory risk is rising, especially for manufacturers selling in or exporting to the state.
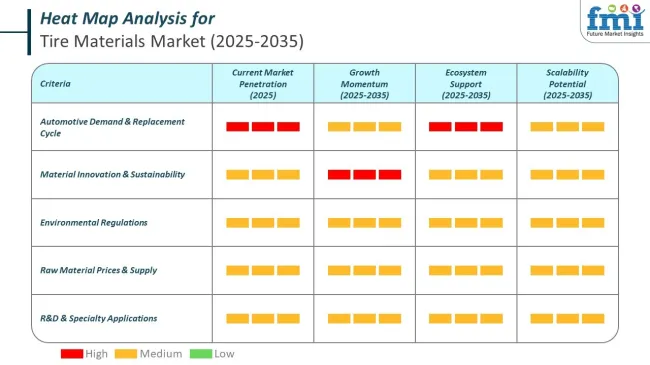
The annual growth rates of the tire materials market from 2024 to 2025 are illustrated below in the table. Starting with the base year 2024 and going up to the present year 2025, the report examined how the industry growth trajectory changes from the first half of the year, i.e. January through June (H1) to the second half consisting of July through December (H2). This gives stakeholders a comprehensive picture of the sector’s performance over time and insights into potential future developments.
The table provided shows the growth of the sector for each half-year between 2024 and 2025. The market was projected to grow at a CAGR of 3.1% in the first half (H1) of 2024. However, in the second half (H2), there is a noticeable increase in the growth rate.
| Particular | Value CAGR |
|---|---|
| H1 2024 | 3.1% (2023 to 2033) |
| H2 2024 | 3.3% (2023 to 2033) |
| H1 2025 | 3.2% (2024 to 2034) |
| H2 2025 | 3.5% (2024 to 2034) |
Moving into the subsequent period, from H1 2024 to H2 2024, the CAGR is projected as 3.1% in the first half and grow to 3.5% in the second half. In the first half (H1) and second half (H2), the market witnessed an increase of 30 BPS each.
Increasing Vehicle PARC and increased automotive production drives the demand for global tire materials market.
Tires are an important part of the automobile industry and thus, the production and sales of vehicles directly affect the dynamics within tire industry. The automotive industry has registered significant growth and is expected to grow at the same rate over the projected period.
This growth is expected to be comparatively higher in Asian countries, such as China and India, which can be attributed to better economic conditions and growing inclination of population towards comfort-travelling, which in turn, is expected to fuel the demand for tires.
In a vehicle, a tire is one of those part that must be replaced frequently i.e. after every 2-3 years, as tires experience maximum wear and tear. Further, it is estimated that in the FY2023, the global vehicle PARC was about 1.4 billion. Thus, it can be concluded that the growing vehicle PARC and production will augment the market of automotive tires and thereby impacting positively on the global tire materials market.
Rising automotive production and ever-increasing automotive fleet size will also increase the consumption of tires and increasing tire consumption will up surge the demand for tire materials.
Research and development projects with focus on improving tire performance and life
The USA Department of Transportation’s National Highway Traffic Safety Administration (NHTSA) and Environmental Protection Agency (EPA) has recently developed fuel economy and new emission standards for medium-duty and heavy-duty vehicles. These rules require manufacturers to reduce fuel consumption for both trailers and tractors.
To improve fuel efficiency, key players are focusing on developing innovative materials and high grade products. The use of these tire materials enhances dynamic properties. For instance, these materials are known to provide improved rolling resistance and improved wet and dry traction
The high tire replacement rate in North America for commercial vehicles is expected to result in an increase in demand for tires, which in turn, will boost the tire materials market.
Shifting trends in global demographics
According to Federal Reserve and United Nations research forecast, the middle class population will grow worldwide from 10 percent to 30 percent between 2025 and 2030. Increasing middle-class population coupled with rising urbanization in developing countries will increase the number vehicle owing to affordability of vehicles by middle class. Apart from this, increasing youth population has also led to increased sales of automotive, which is a positive sign for the tire materials market.
Also changing lifestyle and increased standard of living have increased the adoption of high performance tires as well as branded tires and thus, increasing demand for such tires will positively impact the tire materials market. Increasing number of vehicle owners will push the growth of both OEM as well as aftermarket segments and thus, growing demand for tires will give a boost to the tire materials market.
Robust industrial growth will drive heavy commercial and light commercial vehicle sales
Flourishing industrial sector, including manufacturing, mining, construction, utilities and oil & gas, the sales of HCV and LCV has increased in the global market and is expected to further increase during the forecast period. Due to this, many tire companies are entering the market in the Asia-Pacific and MEA regions with the hope of capitalizing on increased sales and expanding their geographical footprint.
For this, companies are focusing on developing products that comply with safety norms of the local market. Through effective research, development and innovation, global manufacturers will find opportunities to capture the unexploited market and increase their market share.
Growing automotive and tire industry to create ample of opportunities for tire materials market
The future of the tire industry heavily relies on the future of automotive and transportation industries, and the growth of the tire industry will create ample opportunities for the tire materials market. By 2030, 25% of the distance traveled by vehicles will be through shared vehicles, as compared to 15% in 2021 increased distance coverage will rise the tire replacement activities.
Also, the increasing production and sales of electric vehicles will drive the growth of the tire industry, which will positively impact the tire materials market. The first million electric vehicles were sold in six years, and the second million were sold in two. Sales will increase as batteries improve and range anxiety dissipates.
Miles driven globally will nearly double in the next 10 years, to 19 Trillion from 10 Trillion, which means that the 1.5 Billion tires sold globally each year will double. Increased sales of tires will create significant opportunities for tire manufacturers. Also, rising automotive and tire production in emerging countries such as China and India represents a significant number of opportunities for tire materials manufacturers.
Increasing number of regulations to control the carbon footprint will boost the demand for low rolling resistance tires, which will upsurge the demand for silica as a filler material.
Increasing regulations & anti-dumping duties to affect tire production
Attributing to the intensified trade war between the USA and China, The USA Department of Commerce has handed down final anti-subsidy and antidumping duties on truck and bus tires from China, ranging from 20.98% to 63.34% countervailing and 9% to 22.57% antidumping. The increasing number of such duties might affect tire trade, which will have a negative impact on the tire materials market.
Similar to the USA, India has imposed anti-dumping duties on the cheap import of tires. Also, in the European region, there has been an increase in the number of anti-dumping duties due to the increasing environmental concern in the region. The rising number of anti-dumping duties has increased the inclination towards adoption of high performance tires and tire recycling initiatives, which is declining the number of tire replacements and in turn, declining the demand for tire materials.
To reduce the global carbon footprint and decrease greenhouse gas emissions, there has been an increase in the number of regulations on Carbon Black development in regions such as North America and Europe, which is not a good sign for the tire materials market
The tire industry accounts for ~70% of global natural rubber production, and it has been projected that between 4 and 8 Million hectares of new plantations will be required to meet the increasing demand for natural rubber. The clearance of tropical forest for rubber plantations is having a negative impact on bio-diversity in Southeast Asia. Thus, a number of regulations have been implemented on rubber plantation activities in ASEAN countries.
Search for novel alternatives of natural rubber by tire manufacturers
In recent years, leading tire manufacturers have made substantial progress in the development of Guayule and Russian Dandelion as an alternative source of natural rubber in tire production. If the ongoing extensive R&D efforts yield the desired results, then the commercial production of tires made from alternative sources of rubber will become a reality in the coming period.
In recent years, Bridgestone Corporation has developed passenger car tires whose natural rubber content is 100% sourced from the desert shrub, Guayule. In this tire, Guayule rubber was used as an alternative for Hevea brasiliensis rubber in all major components, including the tread, sidewall and bead filler.
Continental Tires AG has achieved a significant breakthrough in its research project for the industrialization of dandelion rubber in tire production. Continental AG aims to industrialize dandelion rubber and introduce it to serial production in the coming period. Similarly, tire manufacturers such as Pirelli and Apollo Vredestein have been able to produce tires from alternative natural rubber sources such as Russian dandelion and from Guayule.
Growing regulations for tire labelling to drive demand for high-performance silica reinforced tires
Synthetic rubber and fillers for automotive tires have significantly changed over the past decade. Many regions, owing to rising environmental concerns, have formed regulations that mandate tire labeling. For instance, since 2022, the EU has made it compulsory to label tires from A to E, based on three parameters, i.e. wet grip, noise and rolling resistance
Japan made tire labeling voluntary since 2010, while the USA has passed a petition for tire labeling and China has made tire labeling voluntary since 2017, which will switch to mandatory from 2019. Regulatory bodies have also laid incentives for manufacturers and consumers with a preference for performance tires. The use of high performance tires contributes to a minimal increase in production cost but offers higher fuel efficiency.
Growing preference for silica in tires to reduce co2 emissions
Over the past few years, with the advent of green technology, silica has been widely used as a reinforcing filler material, effectively replacing carbon black. Tire makers have switched to silica-made tires to cut down rolling resistance by 20% and increase fuel efficiency by 5%.
Road transport contributes ~20% to CO2 emissions in the EU and other developed countries. Thus, reducing emission has been critical to reduce greenhouse effect and the resulting climate change. The use of silica technology as a reinforcing filler reduces CO2 emission by ~7%.
The current demand for silica as a reinforcing filler is dominated by the passenger cars segment. However, manufacturers have shown a keen interest in the development and use of fillers in high performance tires for heavy truck applications. Silica usage in tire thread as filler has also witnessed improved efficiency for winter (snow tires)
Therefore, manufacturers are focusing on the expansion of their product offerings for winter tires, truck tires, green tires and sports tires. Manufacturers have also entered into long-term partnerships with tire manufacturers, such as Michelin, Goodyear, and Bridgestone, amongst others, to ensure long-term supply.
Tier 1 companies comprise players with a revenue of above USD 1,000 million capturing a significant share of 40-45% in the global market. These players are characterized by high production capacity and a wide product portfolio.
These leaders are distinguished by their extensive expertise in manufacturing and reconditioning across multiple tire materials applications and a broad geographical reach, underpinned by a robust consumer base. Prominent companies within Tier 1 include Bekaert, Birla Carbon, Cabot Corporation, Evonik Industries AG, Exxon Mobil Corporation, and other players.
Tier 2 companies include mid-size players with revenue of below USD 1,000 million having a presence in specific regions and highly influencing the local industry. These are characterized by a strong presence overseas and strong industry knowledge.
These players have good technology and ensure regulatory compliance but may not have advanced technology and wide global reach. Prominent companies in tier 2 include JSR Corporation, Kuraray Co., Ltd., Lanxess, PetroChina Company Limited and other player.
The section below covers the industry analysis for tire materials demand in different countries. The demand analysis on key countries in several regions of the globe, including North America, Latin America, East Asia, South Asia Pacific, Western Europe, Eastern Europe, Middle East, and Africa is provided.
China will hold 55.2% in East Asia due to economic development, industrial expansion, technological advancements, and a burgeoning automotive industry. The USA will capture 75.6% in North America owing driven by its advanced automotive industry, high vehicle ownership rates, and technological innovations. Germany will lead Western Europe with 33.2% due to substantial automotive production.
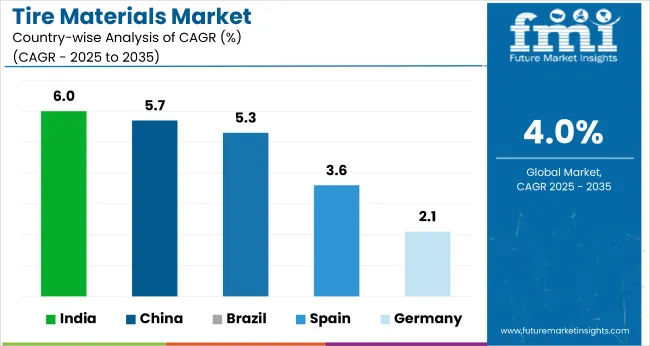
| Countries | Value CAGR (2024 to 2034) |
|---|---|
| Spain | 3.6% |
| India | 6.0% |
| Brazil | 5.3% |
| Germany | 2.1% |
| China | 5.7% |
The sale of tire materials in China is projected to reach USD 27,178.71 million and is estimated to grow at an 5.4% CAGR by 2034.
Increasing disposable income and urbanization have led to higher vehicle ownership, boosting the need for tires and associated materials. The Chinese government’s strong push toward EVs, including subsidies and infrastructure development, has created new demand for high-performance tires and advanced materials.
China’s infrastructure projects, including roads, bridges, and urban developments, require off-highway vehicles, agricultural equipment, and construction machinery, all of which consume tires and materials. The country's significant mining and industrial sectors also demand specialized tires, fueling the growth of the tire materials market.
The sales of tire materials in the USA are projected to reach USD 15,512.38 million by 2034. Over the forecast period, demand for tire materials industry within the USA is predicted to grow at an 2.8% CAGR.
As one of the largest vehicle markets globally, the USA sees consistent demand for passenger cars, commercial vehicles, and off-highway vehicles, all of which require high-quality tires. The thriving electric vehicle (EV) market in the USA, supported by government incentives and consumer preferences for sustainable mobility, has further increased the demand for specialized tire materials like silica and advanced rubber compounds. Additionally, the construction and agricultural sectors contribute significantly to the demand for off-highway and heavy-duty vehicle tires.
The sale of tire materials in Germany is projected to reach USD 5,256.26 million and grow at a CAGR of 2.1% by 2034.
Germany's tire materials market is experiencing robust growth, underpinned by its leadership in automotive manufacturing and engineering excellence. As the largest automotive producer in Europe, Germany is home to a high concentration of premium and luxury vehicle brands, driving demand for high-performance and durable tires that require advanced materials. The country’s strong emphasis on sustainability and environmental compliance has fostered the adoption of eco-friendly tire materials, such as silica-based fillers, bio-based rubber, and recycled components.
Germany's push towards electric mobility, supported by government incentives and infrastructure development, has further spurred demand for specialized tire materials tailored for electric vehicles.
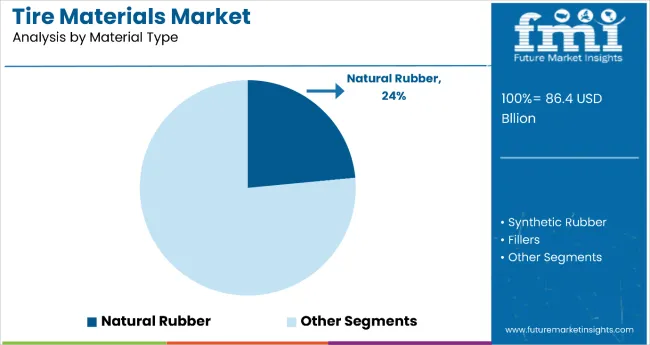
Natural rubber holds the dominant position with 23.5% of the market share in the material type category within the tire materials market. This leadership is driven by natural rubber's exceptional durability, abrasion resistance, and tear resistance properties that make it particularly valuable for high-performance and commercial tire applications. Natural rubber provides superior fatigue crack resistance and excellent elasticity, ensuring structural integrity and effective shock absorption in demanding tire applications.
The segment's dominance is reinforced by natural rubber's renewable sourcing from para rubber trees, which supports global sustainability initiatives and reduces carbon footprint compared to synthetic alternatives. Natural rubber blends well with synthetic rubbers and fillers like carbon black and silica, allowing manufacturers to create hybrid compounds tailored for specific performance requirements including durability and fuel efficiency.
As tire manufacturers focus on developing green tires and sustainable solutions, the natural rubber segment is positioned to maintain its market leadership through continued emphasis on renewable sourcing and performance optimization.
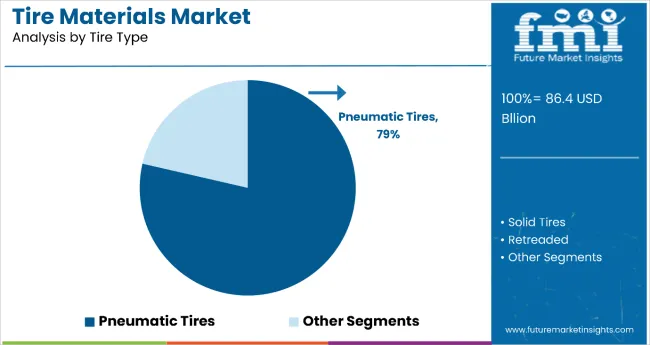
Pneumatic tires dominate the tire materials market with 78.6% of the market share in the tire type category. This substantial leadership is attributed to pneumatic tires' superior performance characteristics including excellent cushioning, reduced rolling resistance, and improved fuel efficiency that make them essential across diverse vehicle applications.
The air or nitrogen-filled structure provides smoother rides and better shock absorption compared to solid tire alternatives, making pneumatic tires the preferred choice for passenger cars, commercial vehicles, and off-road equipment.
The segment's dominance is reinforced by pneumatic tires' versatility across multiple applications including passenger vehicles, commercial trucks, agricultural equipment, bicycles, and even aircraft. The customizable design capabilities allow manufacturers to tailor pneumatic tires for specific performance requirements such as high-speed performance, load-bearing capacity, and terrain adaptability.
As the automotive industry continues to prioritize fuel efficiency and ride comfort, the pneumatic tires segment is expected to maintain its dominant position through continued innovation in design optimization and material integration that enhance performance and sustainability characteristics.
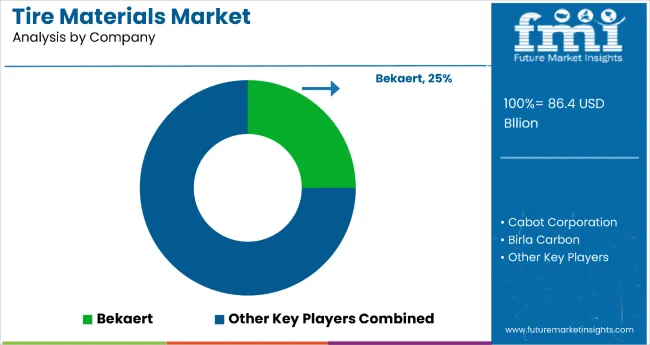
Key companies producing tire materials are slightly consolidate the market with about 55-60% share that are prioritizing technological advancements, integrating sustainable practices, and expanding their footprints in the region. Customer satisfaction remains paramount, with a keen focus on producing tire materials to meet diverse tire types. These industry leaders actively foster collaborations to stay at the forefront of innovation, ensuring their tire materials align with the evolving demands and maintain the highest standards of quality and adaptability.
| Report Attributes | Details |
|---|---|
| Current Total Market Size (2025) | USD 86.44 billion |
| Projected Market Size (2035) | USD 127.9 billion |
| CAGR (2025 to 2035) | 4.0% |
| Base Year for Estimation | 2024 |
| Historical Period | 2020 to 2024 |
| Projections Period | 2025 to 2035 |
| Quantitative Units | Revenue in USD billion |
| Material Types Analyzed (Segment 1) | Natural Rubber (23.5% share in 2024), Synthetic Rubber, Fillers, Plasticizers, Chemicals, Construction/Reinforcing Materials, Others |
| Tire Types Analyzed (Segment 2) | Pneumatic Tires (78.6% share in 2024), Solid Tires, Retreaded Tires |
| Regions Analyzed (Segment 3) | East Asia (China holds 55.2% share in region), North America (USA holds 75.6% share in region), Western Europe (Germany holds 33.2% share in region), South Asia & Pacific, Latin America, Eastern Europe, Middle East & Africa |
| Countries Covered | United States, China, Germany, Brazil, India, Spain |
| Key Players Influencing the Tire Materials Market | Bekaert, Birla Carbon, Cabot Corporation, Evonik Industries AG, Exxon Mobil Corporation, JSR Corporation, Kuraray Co., Ltd., Lanxess, PetroChina Company Limited, Solvay SA |
| Additional Attributes | Green Tires, Low Rolling Resistance, Recyclable Materials, Alternative Natural Rubber Sources |
| Customization and Pricing | Available upon Request |
The Material Type segment is further categorized into Natural Rubber, Synthetic Rubber, Fillers, Plasticizers, Chemicals, Construction/Reinforcing Materials, and Others.
The Tire Type segment is further categorized into Solid Tires, Pneumatic Tires, and Retreaded.
Regions considered in the study include North America, Latin America, Western Europe, Eastern Europe, East Asia, South Asia & Pacific, and the Middle East and Africa.
The global tire materials market was valued at USD 83,769.4 million in 2024.
The demand for tire materials industry is set to reach USD 86.44 billion in 2025.
Shifting trend towards the adoption of advanced materials for reducing the global carbon footprint and development of silica as a reinforcing filler for medium and heavy trucks will drive the demand for tire materials industry.
The tire materials demand is projected to reach USD 127.9 billion by 2035.
Natural rubber material type is expected to lead during the forecast period.


Full Research Suite comprises of:
Market outlook & trends analysis
Interviews & case studies
Strategic recommendations
Vendor profiles & capabilities analysis
5-year forecasts
8 regions and 60+ country-level data splits
Market segment data splits
12 months of continuous data updates
DELIVERED AS:
PDF EXCEL ONLINE
Tire Marking Machine Market Size and Share Forecast Outlook 2025 to 2035
Tire Pressure Monitoring System Market Size and Share Forecast Outlook 2025 to 2035
Tire Cord Fabric Market Size and Share Forecast Outlook 2025 to 2035
Tire Retreading Equipment Market Size and Share Forecast Outlook 2025 to 2035
Tire Cobalt Salt Adhesive Market Size and Share Forecast Outlook 2025 to 2035
Tire Curing Bladder Release Agent Market Size and Share Forecast Outlook 2025 to 2035
Tire and Wheel Handling Equipment Market Size and Share Forecast Outlook 2025 to 2035
Tire Changing Machines Market Size and Share Forecast Outlook 2025 to 2035
Tire Pyrolysis Oil Market Size and Share Forecast Outlook 2025 to 2035
Tire Cord and Tire Fabrics Market Size and Share Forecast Outlook 2025 to 2035
Tire Testing Machine Market Size and Share Forecast Outlook 2025 to 2035
Tire & Wheel Cleaners Market Size and Share Forecast Outlook 2025 to 2035
Tire Repair Patch Market Analysis By Type, Application, and Region Through 2035
Tire Inspection System Market - Outlook 2025 to 2035
Tire Curing Press Market Growth - Trends & Forecast 2025 to 2035
Tire Changers - Market Growth - 2025 to 2035,
Tire Cutting Machine Market Trends, Outlook & Forecast 2025 to 2035
Tire Storage Rack Market Growth - Trends & Forecast 2025 to 2035
Tire Cord Market
Tire Carousel Market

Thank you!
You will receive an email from our Business Development Manager. Please be sure to check your SPAM/JUNK folder too.
Chat With
MaRIA