The global automotive tire market is likely to grow from USD 256.1 billion in 2025 to approximately USD 471.8 billion by 2035, recording an absolute increase of USD 215.6 billion over the forecast period. This translates into a total growth of 84.2%, with the market forecast to expand at a CAGR of 6.3% between 2025 and 2035. The overall market size is expected to grow by nearly 1.84X during the same period, supported by increasing global vehicle production, rising vehicle ownership in emerging markets, growing replacement tire demand from aging vehicle fleets, and technological advancements in tire design including run-flat, low rolling resistance, and smart tire technologies.
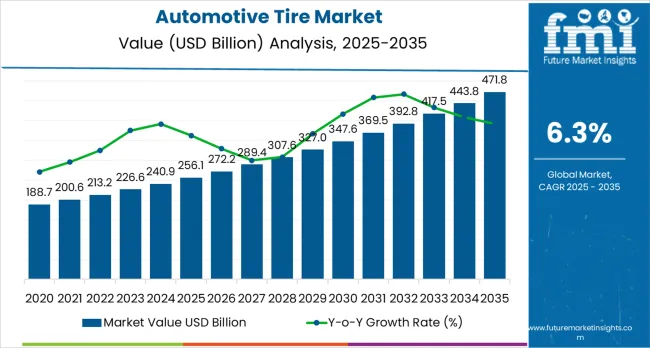
Between 2025 and 2030, the market is projected to expand from USD 256.1 billion to USD 346.8 billion, resulting in a value increase of USD 90.7 billion, which represents 42.1% of the total forecast growth for the decade. This phase of growth will be shaped by accelerating electric vehicle adoption requiring specialized tire designs, expanding vehicle ownership in Asia-Pacific and emerging markets, and increasing consumer preference for premium and ultra-high-performance tires. Tire manufacturers are investing heavily in research and development to create innovative products addressing electric vehicle requirements including low rolling resistance for extended range, noise reduction for quieter cabins, and enhanced load-bearing capacity for heavier battery-equipped vehicles.
From 2030 to 2035, the market is forecast to grow from USD 346.8 billion to USD 471.8 billion, adding another USD 124.9 billion, which constitutes 57.9% of the overall ten-year expansion. This period is expected to be characterized by mainstream adoption of smart tire technologies with integrated sensors for pressure and temperature monitoring, expansion of eco-friendly tire manufacturing using renewable and recycled materials, and development of application-specific tire solutions for autonomous vehicles. The growing focus on environment friendly and circular economy principles will drive demand for eco-friendly tires manufactured with reduced carbon footprints, recyclable materials, and extended tread life that minimize environmental impact throughout product lifecycles.
Between 2020 and 2025, the market experienced dynamic growth driven by recovery from pandemic-related disruptions, resumption of global vehicle production, and pent-up replacement demand as consumers deferred tire purchases during economic uncertainty. The market developed as manufacturers accelerated development of electric vehicle-specific tires, expanded production capacity in emerging markets, and implemented digital transformation initiatives including direct-to-consumer sales channels and online tire fitting services that improved customer convenience and expanded market reach.
| Metric | Value |
|---|---|
| Market Value (2025) | USD 256.1 billion |
| Market Forecast Value (2035) | USD 471.8 billion |
| Forecast CAGR (2025-2035) | 6.3% |
Market expansion is being supported by the continuous growth in global vehicle production and the corresponding demand for original equipment tires from automotive manufacturers across passenger cars, commercial vehicles, and two-wheelers. The International Organization of Motor Vehicle Manufacturers reports steady increases in global vehicle production, with emerging markets including India, Indonesia, Thailand, and Mexico experiencing particularly strong growth as these countries develop domestic automotive manufacturing capabilities. Each new vehicle requires a complete set of tires, creating steady demand for original equipment tire sales that drives market growth proportional to vehicle production increases.
The replacement tire segment, representing approximately 70-75% of total tire demand, provides stable and recurring revenue streams driven by normal tire wear, seasonal tire changes in cold climates, and consumer preferences for upgrading to premium tire brands offering enhanced performance characteristics. The average tire lifespan of 3-5 years depending on driving patterns, vehicle types, and road conditions ensures continuous replacement cycles as tires reach end of service life. The global vehicle parc, estimated at over 1.4 billion vehicles and growing annually, creates an enormous installed base requiring periodic tire replacement, supporting market stability and predictable growth independent of new vehicle sales fluctuations.
The accelerating transition to electric vehicles is creating new opportunities for tire manufacturers to develop specialized products addressing the unique requirements of EVs including instant torque delivery, heavier vehicle weights due to battery packs, and the need for extremely low rolling resistance to maximize driving range. Electric vehicle tires require reinforced construction to support additional weight, noise-reducing technologies to compensate for absent engine noise, and compound formulations optimizing for both low rolling resistance and adequate grip. Premium pricing for EV-specific tires and the rapid growth of global EV sales, projected to exceed 30 million units annually by 2030, creates substantial high-value market opportunities for tire manufacturers investing in EV tire technology development.
Growing consumer awareness of tire safety, performance benefits, and total cost of ownership is driving premiumization trends with increasing adoption of high-performance, ultra-high-performance, and specialty tires commanding price premiums over economy segments. Consumers increasingly recognize that premium tires deliver measurable benefits including shorter braking distances, improved handling, enhanced fuel efficiency through reduced rolling resistance, and extended tread life that can offset higher initial costs through longer replacement intervals. The expansion of middle-class populations in emerging markets increases the addressable market for premium tire products as rising incomes enable consumers to prioritize performance and safety attributes beyond basic transportation needs.
The market is segmented by vehicle type, tire structure, sales channel, tire type, vehicle class, and region. By vehicle type, the market is divided into passenger vehicles, commercial vehicles (light, medium, and heavy-duty), two-wheelers, and off-the-road vehicles. Based on tire structure, the market is categorized into radial and bias tires. By sales channel, segments include original equipment manufacturer (OEM) and replacement/aftermarket. The tire type segment comprises summer, winter, all-season, and performance tires. Vehicle class includes economy, mid-range, and premium segments. Regionally, the market is divided into North America, Europe, Asia-Pacific, Latin America, and Middle East &Africa.
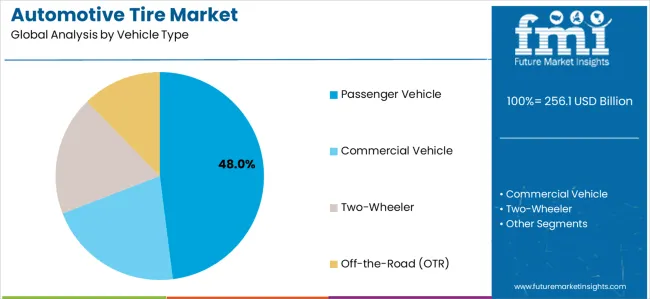
The passenger vehicle segment is projected to account for 48.0% of the market in 2025. This substantial share is supported by the dominance of passenger cars in global vehicle production and the large installed base of passenger vehicles requiring periodic tire replacement. Passenger car sales exceed 60 million units annually globally, with each vehicle requiring four or five tires (including spare) for original equipment fitment, creating steady demand for passenger car tires from automotive manufacturers. The segment benefits from diverse consumer preferences spanning economy, mid-range, premium, and ultra-high-performance categories that enable tire manufacturers to offer extensive product portfolios addressing varied price points and performance requirements.
The replacement tire segment for passenger vehicles generates substantial recurring revenue as consumers replace worn tires every 3-5 years depending on driving patterns and tire quality. Urban drivers typically achieve longer tire life due to gentler road conditions and moderate speeds, while highway drivers and performance-oriented consumers may replace tires more frequently due to accelerated tread wear. The growing preference for SUVs and crossovers within the passenger vehicle category creates opportunities for tire manufacturers, as these larger vehicles require more expensive tires with enhanced load-bearing capacity and all-weather capabilities, driving market value growth beyond pure volume increases.
Premiumization trends are particularly pronounced in the passenger vehicle tire segment, with consumers increasingly willing to invest in high-quality tires delivering superior performance, safety, and comfort attributes. European and North American markets demonstrate strong premium tire adoption, with consumers frequently upgrading from original equipment tire specifications to performance-oriented alternatives offering enhanced grip, handling, and braking characteristics. The expansion of online tire sales and mobile installation services has improved consumer access to premium tire options while simplifying the purchase and installation process, supporting continued premium segment growth.
The electric vehicle revolution is creating new subsegments within passenger vehicle tires, as EVs require specialized tire designs addressing unique performance requirements. EV-specific passenger car tires command premium pricing and represent fast-growing niches within the broader passenger vehicle tire market. The segment also benefits from seasonal tire demand in cold climate regions where consumers switch between summer and winter tires, effectively doubling tire consumption compared to regions using all-season tires year-round. Consumer awareness campaigns focusing tire safety and regular replacement of aged tires, even when tread depth remains adequate, further support replacement tire demand in the passenger vehicle segment.
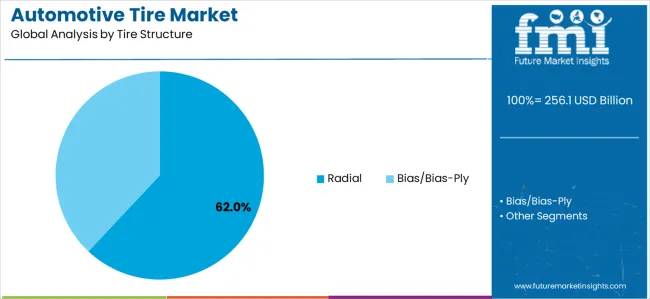
Radial tire technology is expected to represent 62.0% of the market in 2025, reflecting the near-complete dominance of radial construction in modern tire manufacturing for passenger cars and commercial vehicles. Radial tires, featuring steel cord belts running perpendicular to the direction of travel and flexible sidewalls, offer substantial performance advantages over bias-ply construction including lower rolling resistance improving fuel efficiency, superior heat dissipation extending tire life, enhanced stability at highway speeds, and more predictable handling characteristics. These benefits have driven widespread adoption of radial technology since its introduction, with radial tires now representing the standard construction for virtually all new passenger cars and the majority of commercial vehicle applications.
The segment's dominance is reinforced by automotive manufacturers'universal specification of radial tires for original equipment, as vehicle designs optimize suspension geometry, load capacities, and performance characteristics around radial tire properties. Commercial fleet operators overwhelmingly prefer radial truck tires for long-haul and regional applications due to their superior durability, retreadability, and total cost of ownership advantages compared to bias-ply alternatives. Radial truck tires typically deliver 15-20% longer tread life and significantly better fuel economy compared to equivalent bias-ply designs, creating compelling economic cases for radial adoption in commercial applications despite higher initial purchase prices.
Technological innovations continue advancing radial tire performance through developments including optimized belt angles, advanced steel cord treatments, and sophisticated tread compound formulations that enhance grip while maintaining low rolling resistance. Premium radial tires incorporate run-flat technologies enabling continued operation after punctures, self-sealing compounds that automatically seal small punctures, and noise-cancellation foam inserts that dramatically reduce cabin noise for enhanced comfort. The segment particularly benefits from stringent fuel efficiency regulations in developed markets that favor low rolling resistance radial tires as cost-effective means of reducing vehicle emissions and improving fleet fuel economy.
The remaining bias-ply tire segment serves specialized applications including agricultural equipment, off-road vehicles, and certain industrial applications where bias construction's rugged sidewalls and load-bearing characteristics offer advantages. The ongoing technological improvements in radial tire design are gradually expanding radial adoption into applications traditionally dominated by bias-ply construction, including agricultural tractors and construction equipment. The global shift toward radial technology appears irreversible, with continuing market share gains expected throughout the forecast period as radial tire benefits become increasingly recognized across all vehicle segments and applications.
The market is advancing steadily due to increasing global vehicle production, rising vehicle ownership in emerging markets, and continuous replacement demand from aging vehicle fleets requiring periodic tire changes. The market faces challenges including raw material price volatility particularly for natural rubber and crude oil-derived synthetic rubber, intense price competition especially in economy tire segments, and growing import competition from low-cost Asian manufacturers. The market must navigate extended tire replacement intervals as manufacturers develop longer-lasting compounds, online competition disrupting traditional distribution channels, and increasing regulatory complexity regarding labeling, performance standards, and environment friendly requirements.
The accelerating global transition to electric vehicles represents a transformative opportunity for tire manufacturers to develop specialized products commanding premium prices while addressing unique EV performance requirements. Electric vehicles impose distinct demands on tires compared to internal combustion vehicles including instant torque delivery that accelerates tire wear, vehicle weights typically 200-300kg heavier than comparable gasoline vehicles due to battery packs, and the critical importance of low rolling resistance to maximize driving range from limited battery capacity. These factors necessitate specialized tire designs incorporating reinforced construction, optimized tread compounds, and advanced engineering addressing EV-specific requirements.
Growing environmental consciousness among consumers, regulatory pressure from governments, and corporate eco-friendly commitments are fundamentally transforming tire manufacturing, with industry leaders investing heavily in green materials, reduced carbon footprint production processes, and circular economy initiatives. Major tire manufacturers have announced ambitious carbon neutrality targets typically aiming for 2050, requiring comprehensive transformations of supply chains, manufacturing operations, and product designs. These commitments are driving substantial investments in renewable energy for manufacturing facilities, green material sourcing, and development of recyclable tire technologies.
The automotive tire industry is experiencing digital transformation as online sales channels, mobile installation services, and direct-to-consumer business models disrupt traditional distribution through tire retailers and automotive service chains. Online tire retailers including Tire Rack, Discount Tire Direct, and others have captured substantial market share by offering convenient shopping experiences, extensive product selection, competitive pricing, and home delivery or appointment-based installation services. These digital channels particularly appeal to younger consumers comfortable with online shopping and seeking convenience and value compared to visiting physical retail locations.
Embedded sensor technologies and connected tire systems represent emerging innovations that will transform tire performance monitoring and maintenance practices throughout the forecast period. Smart tires incorporate sensors measuring tire pressure, temperature, tread depth, and structural integrity, transmitting data to vehicle systems or mobile apps that alert drivers to maintenance needs before problems escalate into safety hazards or breakdowns. These technologies build upon mandatory tire pressure monitoring systems (TPMS) required in many markets, expanding monitoring capabilities to provide comprehensive tire health assessments and predictive maintenance recommendations.
| Country | CAGR (2025–2035) |
|---|---|
| United Kingdom | 7.2% |
| Germany | 7.1% |
| India | 6.9% |
| China | 6.8% |
| France | 6.5% |
| Japan | 6.0% |
| United States | 5.4% |
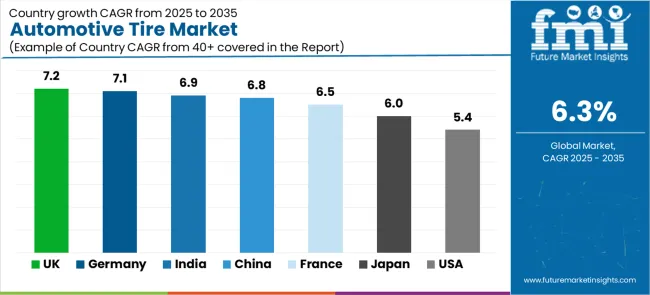
The market demonstrates diverse growth patterns across major markets, with the United Kingdom leading at 7.2% CAGR through 2035, driven by aggressive electric vehicle adoption targets, strong premium vehicle sales, and robust replacement tire demand in a mature automotive market. Germany follows closely at 7.1%, supported by its position as Europe's largest automotive producer, concentration of premium vehicle manufacturers including BMW, Mercedes-Benz, and Volkswagen Group, and leadership in automotive technology innovation. India records strong growth at 6.9%, reflecting rapid vehicle production expansion, growing middle-class vehicle ownership, and infrastructure development supporting automotive sector growth. China maintains substantial growth at 6.8% despite market maturity, driven by the world's largest automotive market continuing expansion, electric vehicle leadership with over 50% global EV sales, and domestic tire manufacturing capacity serving both domestic and export markets. The United States shows moderate growth at 5.4%, reflecting mature market characteristics but sustained by large replacement tire demand from extensive vehicle fleet and consumer preference for larger vehicles including trucks and SUVs requiring more expensive tires.
The report covers an in-depth analysis of 40+ countries, top-performing markets are highlighted below.
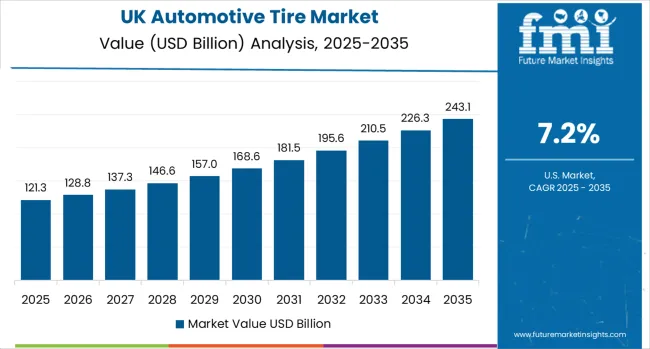
The United Kingdom is projected to exhibit strong growth at a CAGR of 7.2% through 2035, driven by the country's aggressive electric vehicle adoption targets mandating 80% EV sales by 2030 and complete phase-out of new internal combustion vehicle sales by 2035. The UK's ambitious climate policies are accelerating EV adoption faster than most global markets, creating substantial demand for specialized EV tires commanding premium prices. The British automotive market demonstrates strong consumer preference for premium vehicle brands, with luxury and near-luxury segments accounting for higher market shares compared to many European counterparts, supporting premium tire adoption with higher average selling prices.
The UK's large and mature vehicle parc of approximately 32 million passenger cars creates constant replacement tire demand as vehicles require periodic tire changes throughout their operational lives. British driving patterns including relatively high annual mileage averages and extensive motorway networks contribute to tire wear, supporting regular replacement cycles. The country's temperate but variable climate with frequent rainfall drives consumer demand for tires with excellent wet-weather performance, benefiting premium tire manufacturers engineering advanced tread compounds and patterns optimizing wet grip and hydroplaning resistance.
Germany is expanding at a CAGR of 7.1%, supported by the country's position as Europe's largest automotive producer with annual vehicle production exceeding 4 million units and extensive automotive manufacturing ecosystem including global headquarters of BMW, Mercedes-Benz, Volkswagen Group, Audi, and Porsche. German automotive manufacturers'focus on premium and luxury vehicle segments creates exceptional demand for high-performance and ultra-high-performance tires meeting stringent specifications for handling, braking, and high-speed capability demanded by German vehicle designs. The country's automotive export strength ensures steady original equipment tire demand as vehicles produced in Germany are equipped with tires manufactured locally or imported specifically for German production.
Germany's sophisticated tire market demonstrates strong consumer preference for premium tire brands, with German consumers generally willing to invest in quality tires delivering superior performance, safety, and durability compared to economy alternatives. The country's famous autobahn highway network with sections without speed limits creates unique performance requirements, with German drivers demanding tires capable of sustained high-speed operation while maintaining stability and safety margins. This performance focus supports premium tire positioning and technological innovation from manufacturers competing in the demanding German market.
India is projected to grow at a CAGR of 6.9%, driven by rapid expansion of domestic automotive production that has established India as the world's fourth-largest automotive market and fifth-largest vehicle producer. Indian vehicle production continues growing rapidly, approaching 5 million units annually for passenger vehicles alone, with two-wheeler production exceeding 20 million units creating enormous tire demand across multiple vehicle categories. The country's expanding middle class, with hundreds of millions of consumers achieving income levels supporting vehicle ownership, is fueling steady automotive market growth and corresponding tire demand for both original equipment and replacement markets.
India's massive population of over 1.4 billion people, with median age under 30 years, creates enormous long-term automotive market potential as young consumers enter workforce, increase incomes, and aspire to vehicle ownership. The country's improving road infrastructure including highway expansions, expressway development, and urban road improvements is increasing vehicle utilization and average speeds, accelerating tire wear and supporting replacement demand. India's challenging road conditions in many areas, including poor pavement quality, monsoon weather, and diverse terrain, accelerate tire wear and create demand for robust tire designs capable of withstanding demanding operating conditions.
China is expanding at a CAGR of 6.8%, maintaining substantial growth despite the country representing the world's largest and increasingly mature automotive market. China's annual vehicle production exceeds 25 million units, sustaining enormous original equipment tire demand even as production growth moderates from historical double-digit rates. The country's massive vehicle parc, exceeding 300 million vehicles and growing annually, creates the world's largest replacement tire market with constant demand as vehicles require periodic tire changes throughout their operational lives.
China's electric vehicle leadership, with domestic EV sales exceeding 50% of global electric vehicle purchases, creates exceptional opportunities for tire manufacturers developing specialized EV tire solutions. Chinese EV manufacturers including BYD, NIO, XPeng, and others are achieving rapid growth and increasingly sophisticated vehicle designs requiring advanced tire technologies. The Chinese government's aggressive electrification policies targeting 40% EV sales share by 2030 ensure steady growth in EV-specific tire demand commanding premium pricing compared to conventional tires.
The United States is expanding at a CAGR of 5.4%, reflecting mature market characteristics but sustained by the world's second-largest vehicle parc of approximately 280 million vehicles creating enormous replacement tire demand. American vehicle owners drive substantially higher annual mileages compared to most global markets, averaging over 13,000 miles per vehicle annually, accelerating tire wear and supporting regular replacement cycles. The replacement tire market dominates US tire sales, representing approximately 75-80% of total demand as mature vehicle fleet age averages exceed 12 years, with older vehicles requiring more frequent maintenance including tire replacements.
American consumer preference for larger vehicles including full-size pickup trucks, SUVs, and crossovers creates favorable market dynamics for tire manufacturers, as these vehicles require more expensive tires with larger sizes, higher load ratings, and often all-terrain or all-weather capabilities. Pickup trucks represent America's best-selling vehicles, with F-Series, Silverado, and RAM collectively selling over 2 million units annually, creating substantial demand for light truck tires commanding premium prices compared to passenger car tires. The truck and SUV segments account for over 75% of US light vehicle sales, representing dramatic shift from sedan-dominated market just two decades ago.
France is projected to grow at approximately 6.5% CAGR, driven by the country's strong automotive manufacturing heritage including global headquarters of Stellantis (formed from PSA-Peugeot Citroën merger with Fiat Chrysler) and Renault Group, maintaining substantial French vehicle production supporting original equipment tire demand. France's automotive market demonstrates sophisticated consumer preferences with strong adoption of premium vehicle brands, diesel powertrains (historically), and growing electric vehicle sales driven by comprehensive government incentive programs offering substantial purchase subsidies. The country's leadership in transportation policy including aggressive climate commitments is driving rapid EV adoption, creating opportunities for specialized EV tire sales.
French tire manufacturer Michelin, global industry leader and innovation pioneer, maintains substantial operations in France including manufacturing facilities, research and development centers, and corporate headquarters. Michelin's French presence supports extensive tire industry employment and supply chain development while driving technological innovations benefiting global markets. France's geographic position in Western Europe with extensive transportation connections to neighboring markets supports logistics and distribution activities driving commercial vehicle tire demand for trucks serving pan-European freight transportation.
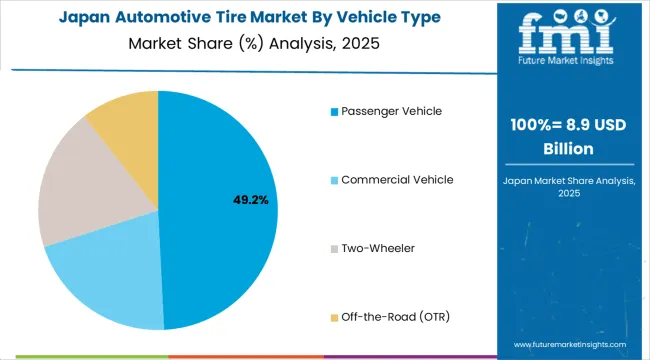
Japan is expanding at approximately 6.0% CAGR, driven by the country's technological innovation leadership in automotive and tire manufacturing, with Japanese tire manufacturers including Bridgestone (world's largest), TOYO, Yokohama, Sumitomo, and others maintaining global market positions. Japan's automotive industry exports substantially exceed domestic production, with Japanese brands including Toyota, Honda, Nissan, Mazda, and Subaru selling vehicles globally, creating international demand for Japanese tire manufacturers supplying original equipment to these automotive partners. Domestic Japanese market demonstrates sophisticated consumer preferences focusing quality, reliability, and technological sophistication, supporting premium tire positioning.
Japanese tire manufacturers maintain substantial research and development capabilities, pioneering innovations including run-flat technologies, noise-cancellation systems, and advanced compounds optimizing performance across diverse conditions. The country's focus on continuous improvement and manufacturing excellence supports ongoing tire technology advancement benefiting global markets. Japanese automotive manufacturers'leadership in hybrid vehicle technology, established through Toyota's Prius success story, creates specialized tire requirements for hybrid vehicles sharing some EV characteristics while maintaining different weight distribution and operating patterns compared to conventional vehicles.
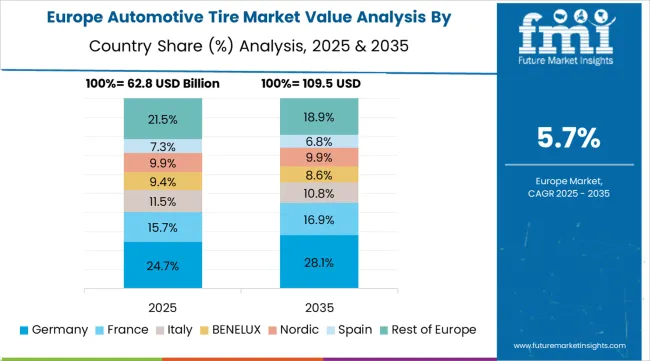
The automotive tire market in Europe is projected to grow from USD 76.8 billion in 2025 to USD 136.4 billion by 2035, registering a CAGR of 5.9% over the forecast period. Germany is expected to maintain its leadership with a 32.4% share in 2025, supported by its position as Europe's largest automotive producer, concentration of premium vehicle manufacturers, and sophisticated consumer preferences for high-performance tires. The United Kingdom follows with 16.8% market share, driven by aggressive electric vehicle adoption policies, strong premium vehicle sales, and robust replacement tire demand in a mature automotive market. France holds 14.2% of the European market, benefiting from domestic automotive manufacturing by Stellantis and Renault Group, government EV incentives, and Michelin's strong home market presence. Italy accounts for 11.6% market share, supported by premium sports car production including Ferrari, Lamborghini, and Maserati requiring ultra-high-performance tires. Spain represents 8.4% of regional demand, with growing automotive production and improving economic conditions. The Nordic countries (Sweden, Norway, Denmark, Finland) collectively represent 6.8% of the market, focusing winter tire adoption and electric vehicle leadership. The Rest of Europe region, including Netherlands, Poland, Belgium, Austria, Czech Republic, and other markets, accounts for 9.8% of the market, supported by expanding automotive manufacturing in Eastern European countries and growing consumer prosperity driving vehicle ownership and tire replacement demand.
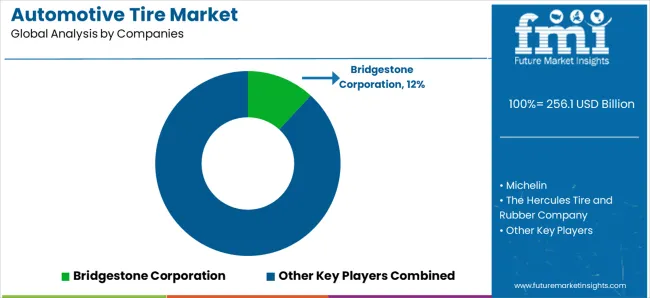
The market is characterized by intense competition among global tire manufacturers, regional players, and emerging Chinese producers. Companies are investing in electric vehicle-specific tire development, eco-friendly material research, smart tire technologies, and digital customer engagement platforms to strengthen market positions. Strategic partnerships with automotive manufacturers for original equipment supply, expansion of production capacity in high-growth emerging markets, and development of premium product portfolios command price premiums while differentiating from economy competitors.
Bridgestone Corporation, Japanese multinational and world's largest tire manufacturer, maintains global market leadership through comprehensive product portfolios spanning all vehicle segments, extensive original equipment relationships with leading automotive manufacturers, and substantial investments in research and development advancing tire technologies. Michelin, French company and perennial industry leader, provides premium tire solutions focusing performance, safety, and sustainability while pioneering innovations including radial tire technology, run-flat systems, and airless tire development for future mobility.
The Hercules Tire and Rubber Company offers diverse tire portfolios serving passenger, light truck, and commercial vehicle applications with focus on value-oriented positioning. Continental AG, German automotive supplier and tire manufacturer, delivers advanced tire technologies leveraging automotive systems expertise while developing integrated tire-vehicle solutions for autonomous and electric vehicles. Nitto Tires provides performance and light truck tires popular in North American markets focusing style and capability.
Goodyear Tire &Rubber Company, Pirelli &C. S.p.A., Sumitomo Rubber Industries, Yokohama Rubber Company, Hankook Tire, Kumho Tire, Toyo Tire, Cooper Tire, Nokian Tyres, Maxxis International, Zhongce Rubber, Triangle Tyre, Linglong Tire, Apollo Tyres, MRF Limited, CEAT, JK Tyre, and Giti Tire offer specialized tire expertise, regional manufacturing capabilities, and diverse product portfolios across global and regional markets.
| Item | Value |
|---|---|
| Quantitative Units | USD 256.1 billion |
| Vehicle Type | Passenger Vehicle (48.0%), Commercial Vehicle (Light/Medium/Heavy-Duty), Two-Wheeler, Off-the-Road |
| Tire Structure | Radial (62.0%), Bias |
| Sales Channel | OEM, Replacement/Aftermarket |
| Tire Type | Summer, Winter, All-Season, Performance/Ultra-High-Performance |
| Vehicle Class | Economy, Mid-Range, Premium/Luxury |
| Regions Covered | North America, Europe, Asia-Pacific, Latin America, Middle East &Africa |
| Country Covered | United Kingdom, Germany, India, China, United States, France, Japan, and other 40+ countries |
| Key Companies Profiled | Bridgestone Corporation, Michelin, The Hercules Tire and Rubber Company, Continental AG, Nitto Tires, Goodyear Tire &Rubber Company, Pirelli &C. S.p.A., Sumitomo Rubber Industries, Yokohama Rubber Company, Hankook Tire, Nokian Tyres, Cooper Tire, Kumho Tire, Toyo Tire, Maxxis International, Zhongce Rubber, Triangle Tyre, Linglong Tire, Apollo Tyres, MRF Limited, CEAT, JK Tyre, Giti Tire |
| Additional Attributes | Dollar sales by vehicle type and tire structure, regional demand trends across developed and emerging markets, competitive landscape with global manufacturers and regional players, buyer preferences for premium versus economy tires, integration of smart tire technologies and connectivity features, innovations in eco-friendly materials and circular economy initiatives, EV-specific tire development for electric vehicle requirements, and adoption of digital sales channels transforming traditional distribution models. |
The global automotive tire market is estimated to be valued at USD 256.1 billion in 2025.
The market size for the automotive tire market is projected to reach USD 471.8 billion by 2035.
The automotive tire market is expected to grow at a 6.3% CAGR between 2025 and 2035.
The key product types in automotive tire market are passenger vehicle, commercial vehicle, two-wheeler and off-the-road (otr).
In terms of tire structure, radial segment to command 62.0% share in the automotive tire market in 2025.


Our Research Products

The "Full Research Suite" delivers actionable market intel, deep dives on markets or technologies, so clients act faster, cut risk, and unlock growth.

The Leaderboard benchmarks and ranks top vendors, classifying them as Established Leaders, Leading Challengers, or Disruptors & Challengers.

Locates where complements amplify value and substitutes erode it, forecasting net impact by horizon

We deliver granular, decision-grade intel: market sizing, 5-year forecasts, pricing, adoption, usage, revenue, and operational KPIs—plus competitor tracking, regulation, and value chains—across 60 countries broadly.

Spot the shifts before they hit your P&L. We track inflection points, adoption curves, pricing moves, and ecosystem plays to show where demand is heading, why it is changing, and what to do next across high-growth markets and disruptive tech

Real-time reads of user behavior. We track shifting priorities, perceptions of today’s and next-gen services, and provider experience, then pace how fast tech moves from trial to adoption, blending buyer, consumer, and channel inputs with social signals (#WhySwitch, #UX).

Partner with our analyst team to build a custom report designed around your business priorities. From analysing market trends to assessing competitors or crafting bespoke datasets, we tailor insights to your needs.
Supplier Intelligence
Discovery & Profiling
Capacity & Footprint
Performance & Risk
Compliance & Governance
Commercial Readiness
Who Supplies Whom
Scorecards & Shortlists
Playbooks & Docs
Category Intelligence
Definition & Scope
Demand & Use Cases
Cost Drivers
Market Structure
Supply Chain Map
Trade & Policy
Operating Norms
Deliverables
Buyer Intelligence
Account Basics
Spend & Scope
Procurement Model
Vendor Requirements
Terms & Policies
Entry Strategy
Pain Points & Triggers
Outputs
Pricing Analysis
Benchmarks
Trends
Should-Cost
Indexation
Landed Cost
Commercial Terms
Deliverables
Brand Analysis
Positioning & Value Prop
Share & Presence
Customer Evidence
Go-to-Market
Digital & Reputation
Compliance & Trust
KPIs & Gaps
Outputs
Full Research Suite comprises of:
Market outlook & trends analysis
Interviews & case studies
Strategic recommendations
Vendor profiles & capabilities analysis
5-year forecasts
8 regions and 60+ country-level data splits
Market segment data splits
12 months of continuous data updates
DELIVERED AS:
PDF EXCEL ONLINE
Automotive Tire Accessories Market Size and Share Forecast Outlook 2025 to 2035
Automotive Tire Inflator Market Size and Share Forecast Outlook 2025 to 2035
Automotive Tire Chains Market Size and Share Forecast Outlook 2025 to 2035
Automotive Green Tires Market Size and Share Forecast Outlook 2025 to 2035
Material, Thickness, Capacity, and Type of Europe Automotive Tire Market Forecast Economic Projections to 2035
Automotive Direct Liquid Cooling IGBT Module Market Size and Share Forecast Outlook 2025 to 2035
Automotive Hoses and Assemblies Market Size and Share Forecast Outlook 2025 to 2035
Automotive Network Testing Market Size and Share Forecast Outlook 2025 to 2035
Automotive Performance Part Market Size and Share Forecast Outlook 2025 to 2035
Automotive Carbon Ceramic Brake Market Size and Share Forecast Outlook 2025 to 2035
Automotive Camshaft Market Size and Share Forecast Outlook 2025 to 2035
Automotive Stamping Industry Analysis in India Size and Share Forecast Outlook 2025 to 2035
Automotive Cylinder Liner Market Size and Share Forecast Outlook 2025 to 2035
Automotive Microcontroller Market Size and Share Forecast Outlook 2025 to 2035
Automotive Roof Rails Market Size and Share Forecast Outlook 2025 to 2035
Tire Marking Machine Market Size and Share Forecast Outlook 2025 to 2035
Automotive Active Safety System Market Size and Share Forecast Outlook 2025 to 2035
Automotive Diagnostic Scan Tool Market Size and Share Forecast Outlook 2025 to 2035
Automotive Test Equipment Market Size and Share Forecast Outlook 2025 to 2035
Automotive Dynamic Map Data Market Size and Share Forecast Outlook 2025 to 2035

Thank you!
You will receive an email from our Business Development Manager. Please be sure to check your SPAM/JUNK folder too.
Chat With
MaRIA