Automotive Data Connectors Market Size, Share, and Forecast Outlook 2025 to 2035

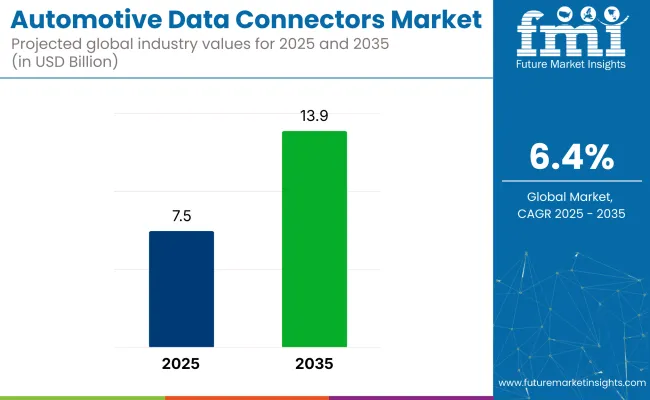
The automotive data connectors market is expected to rise from USD 7.5 billion in 2025 to USD 13.9 billion by 2035. This significant increase reflects a CAGR of 6.4% during the forecast period. The growth highlights the critical role of connectors in the current automotive industry.
Quick Stats for the Automotive Data Connectors Market

  • Market Value (2025): USD 7.5 billion
  • Forecast Value (2035): USD 13.9 billion
  • Forecast CAGR (2025 to 2035): 6.4%
  • Leading Segment in 2035: First fit (70% share)
  • Key Growth Region: Asia Pacific (China)
  • Key Players: TE Connectivity, Rosenberger, Molex, Amphenol RF, Hirose Electric Co., and Aptiv.

Automotive Data Connectors Market

As vehicles become increasingly sophisticated, integrating advanced electronics and communication systems, the need for efficient, reliable data connectors has never been greater. These connectors facilitate seamless data transfer between various electronic components within vehicles, making them indispensable in modern automotive design.

The industry’s growth is closely linked to the rapid development and adoption of connected and autonomous vehicles, which demand robust data communication networks. Automotive data connectors are essential for transmitting sensor data, control signals, and infotainment information across the vehicle’s internal systems.

This enables features such as advanced driver assistance systems (ADAS), real-time navigation, and vehicle-to-everything (V2X) communication. As governments and manufacturers push for safer, smarter, and more environmentally friendly vehicles, the integration of high-speed, durable connectors becomes a key technological enabler. Furthermore, increasing consumer demand for enhanced in-car connectivity and infotainment options also propels the industry forward.

Driving this industry’s expansion are several factors, including the ongoing electrification of vehicles, which introduces new wiring harnesses and data pathways that must be connected efficiently. The growing complexity of automotive electronics, including sensors, cameras, and control units, requires connectors capable of withstanding harsh environmental conditions while maintaining signal integrity.

Moreover, the rising sales of electric vehicles (EVs) are driving demand for automotive data connectors due to the increased need for high-speed, reliable communication between electronic control units, battery management systems, and advanced driver assistance systems (ADAS). EVs rely heavily on data transmission for safety, efficiency, and real-time vehicle diagnostics. As per the IEA, electric car sales neared 14 million in 2023, 95% of which were in China, Europe, and the United States.

Automotive Data Connectors Market Analyzed by Top Investment Segments

Infotainment and passenger cars dominate the industry due to rising demand for advanced connectivity and high vehicle production. First Fit (OEM) leads sales channels with strong investment in new technologies, while USB connectors prevail for their speed, design, and power capabilities.

Infotainment Leads Application Segment with 24% Industry Share.

Infotainment is projected to dominate the application segment with a 24% industry share in 2025, because it requires extensive data transmission capabilities to support a wide range of multimedia and connectivity features that modern consumers expect.

  • These systems integrate audio, video, navigation, internet connectivity, smartphone integration, and voice control, all of which rely on high-speed, reliable data connections within the vehicle.
  • As vehicles become more connected and user-centric, infotainment demands have grown exponentially, driving the need for sophisticated connectors that can handle large volumes of data while ensuring seamless performance.
  • Infotainment systems must maintain stable connections despite the vibrations, temperature fluctuations, and other harsh conditions typical in automotive environments, making robust and durable connectors essential. This widespread adoption and continuous innovation in infotainment technologies significantly contribute to its dominance in the industry.

Automotive Data Connectors Market Analysis By Application

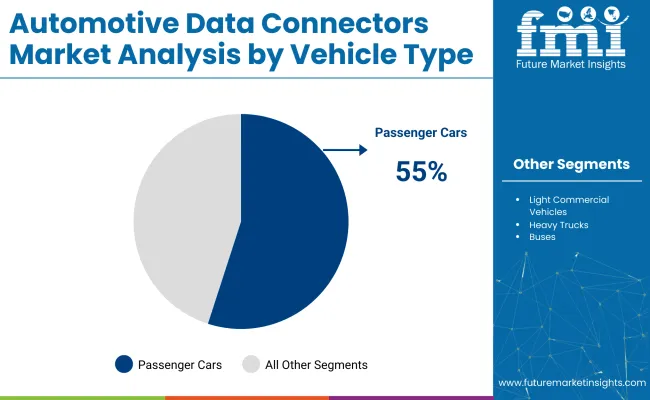
By Vehicle Type, the Passenger Car Segment Accounts for Over 55% Share

The passenger car segment is projected to dominate the industry, accounting for approximately 55% industry share in 2025.
  • This dominance is driven by the high production volumes of passenger vehicles and the increasing integration of advanced electronic systems within these vehicles.
  • Modern passenger cars are equipped with sophisticated infotainment systems, advanced driver-assistance systems (ADAS), and connectivity features, all of which require reliable and efficient data connectors to ensure seamless operation.
  • The growing consumer demand for enhanced in-car experiences and the rapid adoption of electric vehicles further contribute to the increased need for automotive data connectors in the passenger car segment.

Automotive Data Connectors Market Analysis By Vehicle Type

By Sales Channel, First Fit Segment Accounts for Over 70% Industry Share in 2025

The first fit (OEM) segment is expected to dominate the industry in 2025, capturing around 70% of the industry share.

  • This strong position is largely due to the rising integration of sophisticated electronic systems in newly manufactured vehicles. Features such as advanced infotainment, driver assistance systems (ADAS), and electric powertrains depend heavily on high-performance, reliable data connectors to function efficiently. Automotive manufacturers are prioritizing innovation and investing significant resources into research and development to support these emerging technologies.
  • As a result, the First Fit segment continues to lead the industry by supplying connectors tailored specifically for new vehicles, ensuring seamless data communication and enhanced vehicle performance. This focus on OEM solutions highlights the critical role manufacturers play in shaping the future of automotive electronics and connectivity.

By Connector Type, USB Connectors Dominate with 26% Share

USB connectors, particularly USB Type-C, are projected to dominate the industry in 2025, capturing over 26% of the total industry share.

  • This dominance is driven by the increasing integration of advanced electronic systems in vehicles, such as infotainment, advanced driver-assistance systems (ADAS), and electric powertrains, all of which require high-performance connectors.
  • USB Type-C connectors offer several advantages, including high-speed data transfer, reversible design, and the ability to deliver higher power, making them ideal for modern automotive applications. Their widespread adoption is supported by major automotive manufacturers and suppliers, who are investing heavily in research and development to meet the growing demand for these technologies.
  • As a result, USB connectors are becoming an essential component in the automotive industry's shift towards more connected and electrified vehicles.

Top Automotive Data Connectors Market Dynamics

The industry is driven by the rising integration of advanced electronic systems like infotainment and ADAS, boosting demand for reliable, high-speed connectors. However, the complexity of modern electronics and proprietary designs pose challenges, while electrification and data-heavy applications offer new growth opportunities.

Rising Installation of Advanced Electronic Systems in Vehicles

The industry is primarily driven by the increasing integration of advanced electronic systems in vehicles, such as infotainment, advanced driver-assistance systems (ADAS), and electric powertrains. These systems require high-speed, reliable data transmission, fueling demand for sophisticated connectors.

Additionally, the rapid adoption of connected and autonomous vehicles, along with rising consumer expectations for enhanced in-car experiences, further accelerates industry growth. Continuous innovation in connector technology, including miniaturization and improved durability, also supports this expanding demand.

Complexity of Modern Electronics May Hamper Sales

Despite strong growth, the industry faces challenges such as the complexity of modern automotive electronics and the need for connectors that can withstand harsh environmental conditions. Proprietary connector designs by OEMs may limit aftermarket expansion, creating barriers for third-party suppliers.

However, the shift towards electrification and increasing use of data-heavy applications like infotainment and V2X communication present significant opportunities for manufacturers to innovate and capture industry share. Investments in R&D and collaborations between automotive and technology firms are expected to drive future advancements.

Analyzing Top Countries Manufacturing, Distributing, and Supplying Automotive Data Connectors

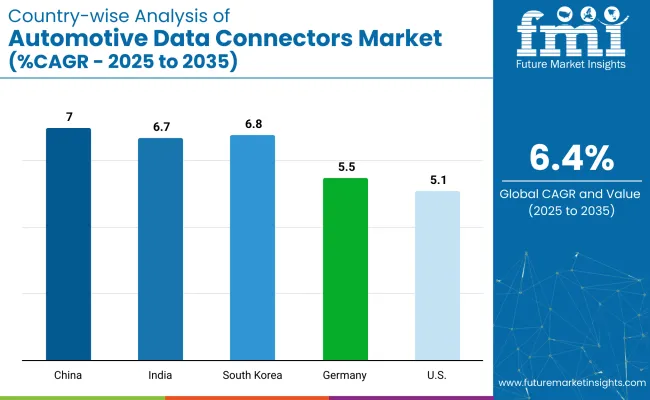
The industry study identifies leading trends across top countries, including the United States, Germany, China, South Korea, and India. Manufacturers in these regions can design focused strategies by considering factors such as increasing vehicle electrification, adoption of ADAS and infotainment systems, evolving connector technologies, and rising consumer demand for connected, high-performance automotive systems.
Country Wise Analysis Of Automotive Data Connectors Market Cagr 2025 To 2035

Countries CAGR (2025 to 2035)
China 7%
India 6.7%
South Korea 6.8%
Germany 5.5%
United States 5.1%

Automotive Data Connectors Market Growth in the United States

The United States industry is estimated to grow at a 5.1% CAGR during the study period. This growth is driven by the increasing adoption of electric vehicles and advanced driver-assistance systems (ADAS) across the country.

  • The rising demand for connected car technologies and infotainment systems is fueling the need for reliable and high-performance data connectors.
  • Continuous investments by USA automotive manufacturers in research and development also contribute significantly to the industry expansion.

China Automotive Data Connectors Market Analysis

The China industry is estimated to grow at a 7% CAGR during the study period.

  • China’s rapid industrialization and its position as the world’s largest automobile industry drive the growth of automotive data connectors. The country’s aggressive push toward electric vehicle adoption and smart transportation infrastructure further amplifies demand.
  • Strong government support and investments in next-generation vehicle technologies are accelerating the integration of advanced data connectors in Chinese vehicles.

India Automotive Data Connectors Market Growth and Trends

The India industry is estimated to grow at a 6.7% CAGR during the study period.

  • The expansion of the automotive sector in India, fueled by rising disposable incomes and increasing vehicle production, is a key factor driving this growth. Growing consumer preference for connected and smart vehicles, along with increasing government initiatives to promote electric and hybrid vehicles, supports the demand for automotive data connectors.
  • Domestic manufacturing and local supply chain enhancements contribute to industry development.

Automotive Data Connectors Market Growth in South Korea

The South Korea industry is estimated to grow at a 6.8% CAGR during the study period.

  • South Korea’s strong automotive industry, led by global players investing in electric and autonomous vehicle technologies, is propelling industry growth. The country’s focus on innovation in vehicle connectivity and smart car features increases the need for high-quality data connectors.
  • Government policies encouraging eco-friendly vehicles and advancements in semiconductor technology are fostering demand.

Automotive Data Connectors Market Growth in Germany

The German industry is estimated to grow at a 5.5% CAGR during the study period.

  • As a global leader in automotive engineering and manufacturing, Germany’s industry growth is supported by the widespread adoption of advanced vehicle technologies such as ADAS and infotainment systems.
  • The country’s commitment to sustainability and electric mobility, alongside its robust automotive supply chain, drives demand for reliable data connectors. Continuous innovation and strong R&D capabilities among German automotive companies also play a crucial role in industry expansion.

Leading Automotive Data Connectors Market Suppliers

Leading Company - TE Connectivity Market Share -22%

Key players like TE Connectivity dominate the industry due to their extensive portfolios of high-performance connectors, strong partnerships with OEMs, and leadership in innovative design and manufacturing capabilities.

Other significant players, including Rosenberger, Molex, Amphenol RF, Hirose Electric, and Aptiv, offer specialized connector solutions, hold important industry certifications, and maintain robust supply chains to support the automotive sector. Complementing these leaders, various companies focus on niche applications or regional industries, providing agility, customization, and competitive pricing to support the broader automotive data connector ecosystem.

Recent Automotive Data Connectors Market Development

  • In February 2025, TE Connectivity announced a definitive agreement to acquire Richards Manufacturing Co. for approximately USD 2.3 billion. This acquisition, expected to close in TE’s fiscal third quarter (ending June 2025), will strengthen TE’s position in the electrical utility sector and is expected to contribute USD 400 million in annual sales to TE’s Industrial Solutions segment.
  • In September 2024, Molex (via its subsidiary Phillips Medisize) announced an agreement to acquire Vectura Group Limited, a leader in inhalation drug device design.

Report Scope - Automotive Data Connectors Market

Report Attributes Details
Industry Size (2025) USD 7.5 billion
Projected Industry Size (2035) USD 13.9 billion
CAGR (2025 to 2035) 6.4%
Base Year for Estimation 2024
Historical Period 2020 to 2024
Projections Period 2025 to 2035
Quantitative Units USD billion for value and units
Application Analyzed (Segment 1) Infotainment, Dashboard/Touch Screens, HD Screens, Bluetooth, USB Connections, Dual-Band Wi-Fi, And Surround Cameras
Vehicle Type Analyzed (Segment 2) Passenger Cars, Light Commercial Vehicles, And Heavy Trucks & Buses
Sales Channel Analyzed (Segment 3) First Fit and Aftermarket
Connector Type Analyzed (Segment 4) RF Coaxial Connectors, High-Speed Data Connectors, Ethernet Connectors, USB Connectors, HDMI Connectors, and OBD Data Ports
Regions Covered North America, Europe, Asia Pacific, Latin America, Middle East & Africa
Countries Covered United States, Canada, Germany, United Kingdom, France, Italy, Spain, China, India, Japan, South Korea, Australia, Brazil, Mexico, Argentina, Saudi Arabia, UAE, South Africa
Key Players Influencing the Industry TE Connectivity, Rosenberger, Molex, Amphenol RF, Hirose Electric Co., and Aptiv.
Additional Attributes Dollar sales, share, competitive landscape, growth drivers, regional trends, OEM vs. aftermarket demand, connector types, key applications, regulatory impact, and emerging tech trends

Key Automotive Data Connectors Market Players

  • TE Connectivity
  • Rosenberger
  • Molex
  • Amphenol RF
  • Hirose Electric Co.
  • Aptiv

Key Segments Studied in Automotive Data Connectors Market

By Application:

In terms of application, the industry is classified into infotainment, dashboard/touch screens, HD screens, Bluetooth, USB connections, dual-band Wi-Fi, and surround cameras.

By Vehicle Type:

With respect to vehicle type, the industry is divided into passenger cars, light commercial vehicles, and heavy trucks & buses.

By Sales Channel:

In terms of sales channel, the industry is divided into first fit and aftermarket.

By Connector Type:

In terms of connector type, the industry is divided into RF coaxial connectors, high-speed data connectors, Ethernet connectors, USB connectors, HDMI connectors, and OBD data ports.

By Region:

From a regional standpoint, the industry is segmented into Latin America, Asia Pacific, the Middle East and Africa, North America, and Europe.

Table of Content

  1. Executive Summary
    • Global Market Outlook
    • Demand-side Trends
    • Supply-side Trends
    • Technology Roadmap Analysis
    • Analysis and Recommendations
  2. Market Overview
    • Market Coverage / Taxonomy
    • Market Definition / Scope / Limitations
  3. Market Background
    • Market Dynamics
      • Drivers
      • Restraints
      • Opportunity
      • Trends
    • Scenario Forecast
      • Demand in Optimistic Scenario
      • Demand in Likely Scenario
      • Demand in Conservative Scenario
    • Opportunity Map Analysis
    • Product Life Cycle Analysis
    • Supply Chain Analysis
      • Supply Side Participants and their Roles
        • Producers
        • Mid-Level Participants (Traders/ Agents/ Brokers)
        • Wholesalers and Distributors
      • Value Added and Value Created at Node in the Supply Chain
      • List of Raw Material Suppliers
      • List of Existing and Potential Buyer’s
    • Investment Feasibility Matrix
    • Value Chain Analysis
      • Profit Margin Analysis
      • Wholesalers and Distributors
      • Retailers
    • PESTLE and Porter’s Analysis
    • Regulatory Landscape
      • By Key Regions
      • By Key Countries
    • Regional Parent Market Outlook
    • Production and Consumption Statistics
    • Import and Export Statistics
  4. Global Market Analysis 2020 to 2024 and Forecast, 2025 to 2035
    • Historical Market Size Value (USD Billion) & Volume (Units) Analysis, 2020 to 2024
    • Current and Future Market Size Value (USD Billion) & Volume (Units) Projections, 2025 to 2035
      • Y-o-Y Growth Trend Analysis
      • Absolute $ Opportunity Analysis
  5. Global Market Pricing Analysis 2020 to 2024 and Forecast 2025 to 2035
  6. Global Market Analysis 2020 to 2024 and Forecast 2025 to 2035, By Application
    • Introduction / Key Findings
    • Historical Market Size Value (USD Billion) & Volume (Units) Analysis By Application, 2020 to 2024
    • Current and Future Market Size Value (USD Billion) & Volume (Units) Analysis and Forecast By Application, 2025 to 2035
      • Infotainment
      • Dashboard/Touch Screens
      • HD Screens
      • Bluetooth
      • USB Connections
      • Dual Band WIFI
      • Surround Cameras
    • Y-o-Y Growth Trend Analysis By Application, 2020 to 2024
    • Absolute $ Opportunity Analysis By Application, 2025 to 2035
  7. Global Market Analysis 2020 to 2024 and Forecast 2025 to 2035, By Vehicle Type
    • Introduction / Key Findings
    • Historical Market Size Value (USD Billion) & Volume (Units) Analysis By Vehicle Type, 2020 to 2024
    • Current and Future Market Size Value (USD Billion) & Volume (Units) Analysis and Forecast By Vehicle Type, 2025 to 2035
      • Passenger Cars
      • Light Commercial Vehicles
      • Heavy Trucks & Busses
    • Y-o-Y Growth Trend Analysis By Vehicle Type, 2020 to 2024
    • Absolute $ Opportunity Analysis By Vehicle Type, 2025 to 2035
  8. Global Market Analysis 2020 to 2024 and Forecast 2025 to 2035, By Sales Channel
    • Introduction / Key Findings
    • Historical Market Size Value (USD Billion) & Volume (Units) Analysis By Sales Channel, 2020 to 2024
    • Current and Future Market Size Value (USD Billion) & Volume (Units) Analysis and Forecast By Sales Channel, 2025 to 2035
      • First Fit
      • Aftermarket
    • Y-o-Y Growth Trend Analysis By Sales Channel, 2020 to 2024
    • Absolute $ Opportunity Analysis By Sales Channel, 2025 to 2035
  9. Global Market Analysis 2020 to 2024 and Forecast 2025 to 2035, By Connector Type
    • Introduction / Key Findings
    • Historical Market Size Value (USD Billion) & Volume (Units) Analysis By Connector Type, 2020 to 2024
    • Current and Future Market Size Value (USD Billion) & Volume (Units) Analysis and Forecast By Connector Type, 2025 to 2035
      • RF Coaxial Connector
      • High-Speed Data Connectors
      • Ethernet Connector
      • USB Connectors
      • HDMI Connector
      • OBD Data Ports
    • Y-o-Y Growth Trend Analysis By Connector Type, 2020 to 2024
    • Absolute $ Opportunity Analysis By Connector Type, 2025 to 2035
  10. Global Market Analysis 2020 to 2024 and Forecast 2025 to 2035, By Region
    • Introduction
    • Historical Market Size Value (USD Billion) & Volume (Units) Analysis By Region, 2020 to 2024
    • Current Market Size Value (USD Billion) & Volume (Units) Analysis and Forecast By Region, 2025 to 2035
      • North America
      • Latin America
      • Western Europe
      • Eastern Europe
      • East Asia
      • South Asia & Pacific
      • Middle East and Africa
    • Market Attractiveness Analysis By Region
  11. North America Market Analysis 2020 to 2024 and Forecast 2025 to 2035, By Country
    • Historical Market Size Value (USD Billion) & Volume (Units) Trend Analysis By Market Taxonomy, 2020 to 2024
    • Market Size Value (USD Billion) & Volume (Units) Forecast By Market Taxonomy, 2025 to 2035
      • By Country
        • USA
        • Canada
        • Mexico
      • By Application
      • By Vehicle Type
      • By Sales Channel
      • By Connector Type
    • Market Attractiveness Analysis
      • By Country
      • By Application
      • By Vehicle Type
      • By Sales Channel
      • By Connector Type
    • Key Takeaways
  12. Latin America Market Analysis 2020 to 2024 and Forecast 2025 to 2035, By Country
    • Historical Market Size Value (USD Billion) & Volume (Units) Trend Analysis By Market Taxonomy, 2020 to 2024
    • Market Size Value (USD Billion) & Volume (Units) Forecast By Market Taxonomy, 2025 to 2035
      • By Country
        • Brazil
        • Argentina
        • Rest of LATAM
      • By Application
      • By Vehicle Type
      • By Sales Channel
      • By Connector Type
    • Market Attractiveness Analysis
      • By Country
      • By Application
      • By Vehicle Type
      • By Sales Channel
      • By Connector Type
    • Key Takeaways
  13. Western Europe Market Analysis 2020 to 2024 and Forecast 2025 to 2035, By Country
    • Historical Market Size Value (USD Billion) & Volume (Units) Trend Analysis By Market Taxonomy, 2020 to 2024
    • Market Size Value (USD Billion) & Volume (Units) Forecast By Market Taxonomy, 2025 to 2035
      • By Country
        • Germany
        • Italy
        • France
        • UK
        • Spain
        • BENELUX
        • Nordic
        • Rest of W. Europe
      • By Application
      • By Vehicle Type
      • By Sales Channel
      • By Connector Type
    • Market Attractiveness Analysis
      • By Country
      • By Application
      • By Vehicle Type
      • By Sales Channel
      • By Connector Type
    • Key Takeaways
  14. Eastern Europe Market Analysis 2020 to 2024 and Forecast 2025 to 2035, By Country
    • Historical Market Size Value (USD Billion) & Volume (Units) Trend Analysis By Market Taxonomy, 2020 to 2024
    • Market Size Value (USD Billion) & Volume (Units) Forecast By Market Taxonomy, 2025 to 2035
      • By Country
        • Russia
        • Hungary
        • Poland
        • Balkan & Baltics
        • Rest of E. Europe
      • By Application
      • By Vehicle Type
      • By Sales Channel
      • By Connector Type
    • Market Attractiveness Analysis
      • By Country
      • By Application
      • By Vehicle Type
      • By Sales Channel
      • By Connector Type
    • Key Takeaways
  15. East Asia Market Analysis 2020 to 2024 and Forecast 2025 to 2035, By Country
    • Historical Market Size Value (USD Billion) & Volume (Units) Trend Analysis By Market Taxonomy, 2020 to 2024
    • Market Size Value (USD Billion) & Volume (Units) Forecast By Market Taxonomy, 2025 to 2035
      • By Country
        • China
        • Japan
        • South Korea
      • By Application
      • By Vehicle Type
      • By Sales Channel
      • By Connector Type
    • Market Attractiveness Analysis
      • By Country
      • By Application
      • By Vehicle Type
      • By Sales Channel
      • By Connector Type
    • Key Takeaways
  16. South Asia & Pacific Market Analysis 2020 to 2024 and Forecast 2025 to 2035, By Country
    • Historical Market Size Value (USD Billion) & Volume (Units) Trend Analysis By Market Taxonomy, 2020 to 2024
    • Market Size Value (USD Billion) & Volume (Units) Forecast By Market Taxonomy, 2025 to 2035
      • By Country
        • India
        • Australia & New Zealand
        • ASEAN
        • Rest of SAP
      • By Application
      • By Vehicle Type
      • By Sales Channel
      • By Connector Type
    • Market Attractiveness Analysis
      • By Country
      • By Application
      • By Vehicle Type
      • By Sales Channel
      • By Connector Type
    • Key Takeaways
  17. Middle East and Africa Market Analysis 2020 to 2024 and Forecast 2025 to 2035, By Country
    • Historical Market Size Value (USD Billion) & Volume (Units) Trend Analysis By Market Taxonomy, 2020 to 2024
    • Market Size Value (USD Billion) & Volume (Units) Forecast By Market Taxonomy, 2025 to 2035
      • By Country
        • GCC Countries
        • Northern Africa
        • South Africa
        • Turkiye
        • Rest of MEA
      • By Application
      • By Vehicle Type
      • By Sales Channel
      • By Connector Type
    • Market Attractiveness Analysis
      • By Country
      • By Application
      • By Vehicle Type
      • By Sales Channel
      • By Connector Type
    • Key Takeaways
  18. Key Countries Market Analysis
    • USA
      • Pricing Analysis
      • Market Share Analysis, 2024
        • By Application
        • By Vehicle Type
        • By Sales Channel
        • By Connector Type
    • Canada
      • Pricing Analysis
      • Market Share Analysis, 2024
        • By Application
        • By Vehicle Type
        • By Sales Channel
        • By Connector Type
    • Brazil
      • Pricing Analysis
      • Market Share Analysis, 2024
        • By Application
        • By Vehicle Type
        • By Sales Channel
        • By Connector Type
    • Mexico
      • Pricing Analysis
      • Market Share Analysis, 2024
        • By Application
        • By Vehicle Type
        • By Sales Channel
        • By Connector Type
    • Argentina
      • Pricing Analysis
      • Market Share Analysis, 2024
        • By Application
        • By Vehicle Type
        • By Sales Channel
        • By Connector Type
  19. Market Structure Analysis
    • Competition Dashboard
    • Competition Benchmarking
    • Market Share Analysis of Top Players
      • By Regional
      • By Application
      • By Vehicle Type
      • By Sales Channel
      • By Connector Type
  20. Competition Analysis
    • Competition Deep Dive
      • TE Connectivity
        • Overview
        • Product Portfolio
        • Profitability by Market Segments (Product/Age /Sales Channel/Region)
        • Sales Footprint
        • Strategy Overview
          • Marketing Strategy
          • Product Strategy
          • Channel Strategy
      • Rosenberger
        • Overview
        • Product Portfolio
        • Profitability by Market Segments (Product/Age /Sales Channel/Region)
        • Sales Footprint
        • Strategy Overview
          • Marketing Strategy
          • Product Strategy
          • Channel Strategy
      • Molex
        • Overview
        • Product Portfolio
        • Profitability by Market Segments (Product/Age /Sales Channel/Region)
        • Sales Footprint
        • Strategy Overview
          • Marketing Strategy
          • Product Strategy
          • Channel Strategy
      • Amphenol RF
        • Overview
        • Product Portfolio
        • Profitability by Market Segments (Product/Age /Sales Channel/Region)
        • Sales Footprint
        • Strategy Overview
          • Marketing Strategy
          • Product Strategy
          • Channel Strategy
      • Hirose Electric Co.
        • Overview
        • Product Portfolio
        • Profitability by Market Segments (Product/Age /Sales Channel/Region)
        • Sales Footprint
        • Strategy Overview
          • Marketing Strategy
          • Product Strategy
          • Channel Strategy
      • Aptiv
        • Overview
        • Product Portfolio
        • Profitability by Market Segments (Product/Age /Sales Channel/Region)
        • Sales Footprint
        • Strategy Overview
          • Marketing Strategy
          • Product Strategy
          • Channel Strategy
  21. Assumptions & Acronyms Used
  22. Research Methodology

List of Tables

  • Table 1: Global Market Value (USD Billion) Forecast by Region, 2020 to 2035
  • Table 2: Global Market Volume (Units) Forecast by Region, 2020 to 2035
  • Table 3: Global Market Value (USD Billion) Forecast by Application, 2020 to 2035
  • Table 4: Global Market Volume (Units) Forecast by Application, 2020 to 2035
  • Table 5: Global Market Value (USD Billion) Forecast by Vehicle Type, 2020 to 2035
  • Table 6: Global Market Volume (Units) Forecast by Vehicle Type, 2020 to 2035
  • Table 7: Global Market Value (USD Billion) Forecast by Sales Channel, 2020 to 2035
  • Table 8: Global Market Volume (Units) Forecast by Sales Channel, 2020 to 2035
  • Table 9: Global Market Value (USD Billion) Forecast by Connector Type, 2020 to 2035
  • Table 10: Global Market Volume (Units) Forecast by Connector Type, 2020 to 2035
  • Table 11: North America Market Value (USD Billion) Forecast by Country, 2020 to 2035
  • Table 12: North America Market Volume (Units) Forecast by Country, 2020 to 2035
  • Table 13: North America Market Value (USD Billion) Forecast by Application, 2020 to 2035
  • Table 14: North America Market Volume (Units) Forecast by Application, 2020 to 2035
  • Table 15: North America Market Value (USD Billion) Forecast by Vehicle Type, 2020 to 2035
  • Table 16: North America Market Volume (Units) Forecast by Vehicle Type, 2020 to 2035
  • Table 17: North America Market Value (USD Billion) Forecast by Sales Channel, 2020 to 2035
  • Table 18: North America Market Volume (Units) Forecast by Sales Channel, 2020 to 2035
  • Table 19: North America Market Value (USD Billion) Forecast by Connector Type, 2020 to 2035
  • Table 20: North America Market Volume (Units) Forecast by Connector Type, 2020 to 2035
  • Table 21: Latin America Market Value (USD Billion) Forecast by Country, 2020 to 2035
  • Table 22: Latin America Market Volume (Units) Forecast by Country, 2020 to 2035
  • Table 23: Latin America Market Value (USD Billion) Forecast by Application, 2020 to 2035
  • Table 24: Latin America Market Volume (Units) Forecast by Application, 2020 to 2035
  • Table 25: Latin America Market Value (USD Billion) Forecast by Vehicle Type, 2020 to 2035
  • Table 26: Latin America Market Volume (Units) Forecast by Vehicle Type, 2020 to 2035
  • Table 27: Latin America Market Value (USD Billion) Forecast by Sales Channel, 2020 to 2035
  • Table 28: Latin America Market Volume (Units) Forecast by Sales Channel, 2020 to 2035
  • Table 29: Latin America Market Value (USD Billion) Forecast by Connector Type, 2020 to 2035
  • Table 30: Latin America Market Volume (Units) Forecast by Connector Type, 2020 to 2035
  • Table 31: Western Europe Market Value (USD Billion) Forecast by Country, 2020 to 2035
  • Table 32: Western Europe Market Volume (Units) Forecast by Country, 2020 to 2035
  • Table 33: Western Europe Market Value (USD Billion) Forecast by Application, 2020 to 2035
  • Table 34: Western Europe Market Volume (Units) Forecast by Application, 2020 to 2035
  • Table 35: Western Europe Market Value (USD Billion) Forecast by Vehicle Type, 2020 to 2035
  • Table 36: Western Europe Market Volume (Units) Forecast by Vehicle Type, 2020 to 2035
  • Table 37: Western Europe Market Value (USD Billion) Forecast by Sales Channel, 2020 to 2035
  • Table 38: Western Europe Market Volume (Units) Forecast by Sales Channel, 2020 to 2035
  • Table 39: Western Europe Market Value (USD Billion) Forecast by Connector Type, 2020 to 2035
  • Table 40: Western Europe Market Volume (Units) Forecast by Connector Type, 2020 to 2035
  • Table 41: Eastern Europe Market Value (USD Billion) Forecast by Country, 2020 to 2035
  • Table 42: Eastern Europe Market Volume (Units) Forecast by Country, 2020 to 2035
  • Table 43: Eastern Europe Market Value (USD Billion) Forecast by Application, 2020 to 2035
  • Table 44: Eastern Europe Market Volume (Units) Forecast by Application, 2020 to 2035
  • Table 45: Eastern Europe Market Value (USD Billion) Forecast by Vehicle Type, 2020 to 2035
  • Table 46: Eastern Europe Market Volume (Units) Forecast by Vehicle Type, 2020 to 2035
  • Table 47: Eastern Europe Market Value (USD Billion) Forecast by Sales Channel, 2020 to 2035
  • Table 48: Eastern Europe Market Volume (Units) Forecast by Sales Channel, 2020 to 2035
  • Table 49: Eastern Europe Market Value (USD Billion) Forecast by Connector Type, 2020 to 2035
  • Table 50: Eastern Europe Market Volume (Units) Forecast by Connector Type, 2020 to 2035
  • Table 51: East Asia Market Value (USD Billion) Forecast by Country, 2020 to 2035
  • Table 52: East Asia Market Volume (Units) Forecast by Country, 2020 to 2035
  • Table 53: East Asia Market Value (USD Billion) Forecast by Application, 2020 to 2035
  • Table 54: East Asia Market Volume (Units) Forecast by Application, 2020 to 2035
  • Table 55: East Asia Market Value (USD Billion) Forecast by Vehicle Type, 2020 to 2035
  • Table 56: East Asia Market Volume (Units) Forecast by Vehicle Type, 2020 to 2035
  • Table 57: East Asia Market Value (USD Billion) Forecast by Sales Channel, 2020 to 2035
  • Table 58: East Asia Market Volume (Units) Forecast by Sales Channel, 2020 to 2035
  • Table 59: East Asia Market Value (USD Billion) Forecast by Connector Type, 2020 to 2035
  • Table 60: East Asia Market Volume (Units) Forecast by Connector Type, 2020 to 2035
  • Table 61: South Asia & Pacific Market Value (USD Billion) Forecast by Country, 2020 to 2035
  • Table 62: South Asia & Pacific Market Volume (Units) Forecast by Country, 2020 to 2035
  • Table 63: South Asia & Pacific Market Value (USD Billion) Forecast by Application, 2020 to 2035
  • Table 64: South Asia & Pacific Market Volume (Units) Forecast by Application, 2020 to 2035
  • Table 65: South Asia & Pacific Market Value (USD Billion) Forecast by Vehicle Type, 2020 to 2035
  • Table 66: South Asia & Pacific Market Volume (Units) Forecast by Vehicle Type, 2020 to 2035
  • Table 67: South Asia & Pacific Market Value (USD Billion) Forecast by Sales Channel, 2020 to 2035
  • Table 68: South Asia & Pacific Market Volume (Units) Forecast by Sales Channel, 2020 to 2035
  • Table 69: South Asia & Pacific Market Value (USD Billion) Forecast by Connector Type, 2020 to 2035
  • Table 70: South Asia & Pacific Market Volume (Units) Forecast by Connector Type, 2020 to 2035
  • Table 71: Middle East and Africa Market Value (USD Billion) Forecast by Country, 2020 to 2035
  • Table 72: Middle East and Africa Market Volume (Units) Forecast by Country, 2020 to 2035
  • Table 73: Middle East and Africa Market Value (USD Billion) Forecast by Application, 2020 to 2035
  • Table 74: Middle East and Africa Market Volume (Units) Forecast by Application, 2020 to 2035
  • Table 75: Middle East and Africa Market Value (USD Billion) Forecast by Vehicle Type, 2020 to 2035
  • Table 76: Middle East and Africa Market Volume (Units) Forecast by Vehicle Type, 2020 to 2035
  • Table 77: Middle East and Africa Market Value (USD Billion) Forecast by Sales Channel, 2020 to 2035
  • Table 78: Middle East and Africa Market Volume (Units) Forecast by Sales Channel, 2020 to 2035
  • Table 79: Middle East and Africa Market Value (USD Billion) Forecast by Connector Type, 2020 to 2035
  • Table 80: Middle East and Africa Market Volume (Units) Forecast by Connector Type, 2020 to 2035

List of Figures

  • Figure 1: Global Market Volume (Units) Forecast 2020 to 2035
  • Figure 2: Global Market Pricing Analysis
  • Figure 3: Global Market Value (USD Billion) Forecast 2020 to 2035
  • Figure 4: Global Market Value Share and BPS Analysis by Application, 2025 and 2035
  • Figure 5: Global Market Y-o-Y Growth Comparison by Application, 2025 to 2035
  • Figure 6: Global Market Attractiveness Analysis by Application
  • Figure 7: Global Market Value Share and BPS Analysis by Vehicle Type, 2025 and 2035
  • Figure 8: Global Market Y-o-Y Growth Comparison by Vehicle Type, 2025 to 2035
  • Figure 9: Global Market Attractiveness Analysis by Vehicle Type
  • Figure 10: Global Market Value Share and BPS Analysis by Sales Channel, 2025 and 2035
  • Figure 11: Global Market Y-o-Y Growth Comparison by Sales Channel, 2025 to 2035
  • Figure 12: Global Market Attractiveness Analysis by Sales Channel
  • Figure 13: Global Market Value Share and BPS Analysis by Connector Type, 2025 and 2035
  • Figure 14: Global Market Y-o-Y Growth Comparison by Connector Type, 2025 to 2035
  • Figure 15: Global Market Attractiveness Analysis by Connector Type
  • Figure 16: Global Market Value (USD Billion) Share and BPS Analysis by Region, 2025 and 2035
  • Figure 17: Global Market Y-o-Y Growth Comparison by Region, 2025 to 2035
  • Figure 18: Global Market Attractiveness Analysis by Region
  • Figure 19: North America Market Incremental $ Opportunity, 2025 to 2035
  • Figure 20: Latin America Market Incremental $ Opportunity, 2025 to 2035
  • Figure 21: Western Europe Market Incremental $ Opportunity, 2025 to 2035
  • Figure 22: Eastern Europe Market Incremental $ Opportunity, 2025 to 2035
  • Figure 23: East Asia Market Incremental $ Opportunity, 2025 to 2035
  • Figure 24: South Asia & Pacific Market Incremental $ Opportunity, 2025 to 2035
  • Figure 25: Middle East and Africa Market Incremental $ Opportunity, 2025 to 2035
  • Figure 26: North America Market Value Share and BPS Analysis by Country, 2025 and 2035
  • Figure 27: North America Market Value Share and BPS Analysis by Application, 2025 and 2035
  • Figure 28: North America Market Y-o-Y Growth Comparison by Application, 2025 to 2035
  • Figure 29: North America Market Attractiveness Analysis by Application
  • Figure 30: North America Market Value Share and BPS Analysis by Vehicle Type, 2025 and 2035
  • Figure 31: North America Market Y-o-Y Growth Comparison by Vehicle Type, 2025 to 2035
  • Figure 32: North America Market Attractiveness Analysis by Vehicle Type
  • Figure 33: North America Market Value Share and BPS Analysis by Sales Channel, 2025 and 2035
  • Figure 34: North America Market Y-o-Y Growth Comparison by Sales Channel, 2025 to 2035
  • Figure 35: North America Market Attractiveness Analysis by Sales Channel
  • Figure 36: North America Market Value Share and BPS Analysis by Connector Type, 2025 and 2035
  • Figure 37: North America Market Y-o-Y Growth Comparison by Connector Type, 2025 to 2035
  • Figure 38: North America Market Attractiveness Analysis by Connector Type
  • Figure 39: Latin America Market Value Share and BPS Analysis by Country, 2025 and 2035
  • Figure 40: Latin America Market Value Share and BPS Analysis by Application, 2025 and 2035
  • Figure 41: Latin America Market Y-o-Y Growth Comparison by Application, 2025 to 2035
  • Figure 42: Latin America Market Attractiveness Analysis by Application
  • Figure 43: Latin America Market Value Share and BPS Analysis by Vehicle Type, 2025 and 2035
  • Figure 44: Latin America Market Y-o-Y Growth Comparison by Vehicle Type, 2025 to 2035
  • Figure 45: Latin America Market Attractiveness Analysis by Vehicle Type
  • Figure 46: Latin America Market Value Share and BPS Analysis by Sales Channel, 2025 and 2035
  • Figure 47: Latin America Market Y-o-Y Growth Comparison by Sales Channel, 2025 to 2035
  • Figure 48: Latin America Market Attractiveness Analysis by Sales Channel
  • Figure 49: Latin America Market Value Share and BPS Analysis by Connector Type, 2025 and 2035
  • Figure 50: Latin America Market Y-o-Y Growth Comparison by Connector Type, 2025 to 2035
  • Figure 51: Latin America Market Attractiveness Analysis by Connector Type
  • Figure 52: Western Europe Market Value Share and BPS Analysis by Country, 2025 and 2035
  • Figure 53: Western Europe Market Value Share and BPS Analysis by Application, 2025 and 2035
  • Figure 54: Western Europe Market Y-o-Y Growth Comparison by Application, 2025 to 2035
  • Figure 55: Western Europe Market Attractiveness Analysis by Application
  • Figure 56: Western Europe Market Value Share and BPS Analysis by Vehicle Type, 2025 and 2035
  • Figure 57: Western Europe Market Y-o-Y Growth Comparison by Vehicle Type, 2025 to 2035
  • Figure 58: Western Europe Market Attractiveness Analysis by Vehicle Type
  • Figure 59: Western Europe Market Value Share and BPS Analysis by Sales Channel, 2025 and 2035
  • Figure 60: Western Europe Market Y-o-Y Growth Comparison by Sales Channel, 2025 to 2035
  • Figure 61: Western Europe Market Attractiveness Analysis by Sales Channel
  • Figure 62: Western Europe Market Value Share and BPS Analysis by Connector Type, 2025 and 2035
  • Figure 63: Western Europe Market Y-o-Y Growth Comparison by Connector Type, 2025 to 2035
  • Figure 64: Western Europe Market Attractiveness Analysis by Connector Type
  • Figure 65: Eastern Europe Market Value Share and BPS Analysis by Country, 2025 and 2035
  • Figure 66: Eastern Europe Market Value Share and BPS Analysis by Application, 2025 and 2035
  • Figure 67: Eastern Europe Market Y-o-Y Growth Comparison by Application, 2025 to 2035
  • Figure 68: Eastern Europe Market Attractiveness Analysis by Application
  • Figure 69: Eastern Europe Market Value Share and BPS Analysis by Vehicle Type, 2025 and 2035
  • Figure 70: Eastern Europe Market Y-o-Y Growth Comparison by Vehicle Type, 2025 to 2035
  • Figure 71: Eastern Europe Market Attractiveness Analysis by Vehicle Type
  • Figure 72: Eastern Europe Market Value Share and BPS Analysis by Sales Channel, 2025 and 2035
  • Figure 73: Eastern Europe Market Y-o-Y Growth Comparison by Sales Channel, 2025 to 2035
  • Figure 74: Eastern Europe Market Attractiveness Analysis by Sales Channel
  • Figure 75: Eastern Europe Market Value Share and BPS Analysis by Connector Type, 2025 and 2035
  • Figure 76: Eastern Europe Market Y-o-Y Growth Comparison by Connector Type, 2025 to 2035
  • Figure 77: Eastern Europe Market Attractiveness Analysis by Connector Type
  • Figure 78: East Asia Market Value Share and BPS Analysis by Country, 2025 and 2035
  • Figure 79: East Asia Market Value Share and BPS Analysis by Application, 2025 and 2035
  • Figure 80: East Asia Market Y-o-Y Growth Comparison by Application, 2025 to 2035
  • Figure 81: East Asia Market Attractiveness Analysis by Application
  • Figure 82: East Asia Market Value Share and BPS Analysis by Vehicle Type, 2025 and 2035
  • Figure 83: East Asia Market Y-o-Y Growth Comparison by Vehicle Type, 2025 to 2035
  • Figure 84: East Asia Market Attractiveness Analysis by Vehicle Type
  • Figure 85: East Asia Market Value Share and BPS Analysis by Sales Channel, 2025 and 2035
  • Figure 86: East Asia Market Y-o-Y Growth Comparison by Sales Channel, 2025 to 2035
  • Figure 87: East Asia Market Attractiveness Analysis by Sales Channel
  • Figure 88: East Asia Market Value Share and BPS Analysis by Connector Type, 2025 and 2035
  • Figure 89: East Asia Market Y-o-Y Growth Comparison by Connector Type, 2025 to 2035
  • Figure 90: East Asia Market Attractiveness Analysis by Connector Type
  • Figure 91: South Asia & Pacific Market Value Share and BPS Analysis by Country, 2025 and 2035
  • Figure 92: South Asia & Pacific Market Value Share and BPS Analysis by Application, 2025 and 2035
  • Figure 93: South Asia & Pacific Market Y-o-Y Growth Comparison by Application, 2025 to 2035
  • Figure 94: South Asia & Pacific Market Attractiveness Analysis by Application
  • Figure 95: South Asia & Pacific Market Value Share and BPS Analysis by Vehicle Type, 2025 and 2035
  • Figure 96: South Asia & Pacific Market Y-o-Y Growth Comparison by Vehicle Type, 2025 to 2035
  • Figure 97: South Asia & Pacific Market Attractiveness Analysis by Vehicle Type
  • Figure 98: South Asia & Pacific Market Value Share and BPS Analysis by Sales Channel, 2025 and 2035
  • Figure 99: South Asia & Pacific Market Y-o-Y Growth Comparison by Sales Channel, 2025 to 2035
  • Figure 100: South Asia & Pacific Market Attractiveness Analysis by Sales Channel
  • Figure 101: South Asia & Pacific Market Value Share and BPS Analysis by Connector Type, 2025 and 2035
  • Figure 102: South Asia & Pacific Market Y-o-Y Growth Comparison by Connector Type, 2025 to 2035
  • Figure 103: South Asia & Pacific Market Attractiveness Analysis by Connector Type
  • Figure 104: Middle East and Africa Market Value Share and BPS Analysis by Country, 2025 and 2035
  • Figure 105: Middle East and Africa Market Value Share and BPS Analysis by Application, 2025 and 2035
  • Figure 106: Middle East and Africa Market Y-o-Y Growth Comparison by Application, 2025 to 2035
  • Figure 107: Middle East and Africa Market Attractiveness Analysis by Application
  • Figure 108: Middle East and Africa Market Value Share and BPS Analysis by Vehicle Type, 2025 and 2035
  • Figure 109: Middle East and Africa Market Y-o-Y Growth Comparison by Vehicle Type, 2025 to 2035
  • Figure 110: Middle East and Africa Market Attractiveness Analysis by Vehicle Type
  • Figure 111: Middle East and Africa Market Value Share and BPS Analysis by Sales Channel, 2025 and 2035
  • Figure 112: Middle East and Africa Market Y-o-Y Growth Comparison by Sales Channel, 2025 to 2035
  • Figure 113: Middle East and Africa Market Attractiveness Analysis by Sales Channel
  • Figure 114: Middle East and Africa Market Value Share and BPS Analysis by Connector Type, 2025 and 2035
  • Figure 115: Middle East and Africa Market Y-o-Y Growth Comparison by Connector Type, 2025 to 2035
  • Figure 116: Middle East and Africa Market Attractiveness Analysis by Connector Type
  • Figure 117: Global Market - Tier Structure Analysis
  • Figure 118: Global Market - Company Share Analysis

Frequently Asked Questions

What is the estimated size of the automotive data connectors market in 2025?

The industry is valued at USD 7.5 billion in 2025.

What is the projected size of the automotive data connectors market by 2035?

The industry is forecast to reach USD 13.9 billion by 2035.

Which sales channel segment holds the largest share in the automotive data connectors market?

The first fit holds 70% industry share in 2025.

Who is the leading company in the global automotive data connectors market?

TE Connectivity is the leading company in the industry with 22% market share.

What is the expected CAGR of the automotive data connectors market from 2025 to 2035?

The industry is projected to grow at a CAGR of 6.4%.

Explore Electrification Components Insights

Future Market Insights

Automotive Data Connectors Market