Reports

- Global Locations -

Headquarters

Future Market Insights, Inc.

Christiana Corporate, 200
Continental Drive, Suite 401,
Newark, Delaware - 19713,
United States

T: +1-845-579-5705

Americas

Future Market Insights, Inc.

616 Corporate Way, Suite 2-9018,
Valley Cottage, NY 10989, United States

T: +1-347-918-3531

MEA

Future Market Insights

1602-6 Jumeirah Bay X2 Tower, Plot No: JLT-PH2-X2A,
Jumeirah Lakes Towers, Dubai,
United Arab Emirates

Europe

Future Market Insights

3rd Floor, 207 Regent Street,
W1B 3HH London
United Kingdom

T: + 44 (0) 20 8123 9659
D: +44 (0) 20 3287 4268

Asia Pacific

Future Market Insights

IndiaLand Global Tech Park, Unit UG-1, Behind Grand HighStreet, Phase 1, Hinjawadi, MH, Pune – 411057, India

Automotive seating accessories Market Outlook (2023 to 2033)

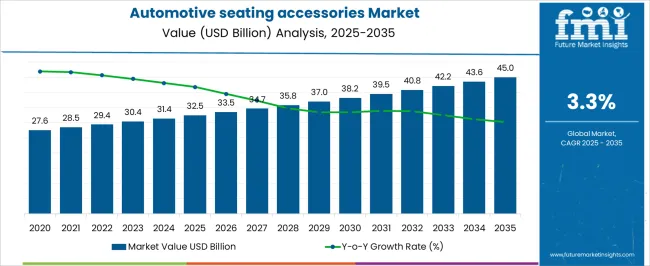
The automotive seating accessories market size is evaluated to be worth US$ xx billion in 2023. The market is likely to surpass US$ 30.3 billion by 2033 at a CAGR of 3.5% during the forecast period. The market growth is driven mainly in emerging economies as well as developed countries. The major driving factors behind increasing demand are requirement of products which improves safety, comfort and high durability.

Automotive seating accessories have emerged as the best solution many automobile manufacturers in improving the aesthetic, comfort measures and safety.

Drivers Propelling the Demand for Automotive seating accessories include:

  • Stricter government regulations regarding vehicle safety is a major driver for the seat belt market.
  • Growing demand for vinyl, epoxy and synthetic materials based seat covers over conventional leather and cloth clovers due to their cost effectiveness, less maintenance and durability.
  • The increasing adoption of automotive seating accessories in emerging economies urbanization is creating significant growth opportunities for the market.

Challenges for Companies /Manufacturers in the automotive seating accessories Market:

  • A significantly large number of market participants creating a very intense competition from other players to acquire more size of the market.
  • The complexity of automotive seating accessories installation and maintenance requires skilled professionals, which is a challenge for companies operating in regions with a shortage of skilled labor.
  • Frequent cleaning and maintenance of automotive seating accessories can lead to fast wear and tear of the product damaging its durability and look.

Opportunities in the automotive seating accessories Industry:

  • The increasing demand for seat covers due to continuously changing aesthetic trends and advancement in the production process.
  • The development of advanced automotive seating accessories with enhanced efficiency and reduced maintenance.
  • The increasing focus on sustainable environmental protective materials presents investment opportunities for companies that provide eco-friendly automotive seating accessories.

Latest Trends in the automotive seating accessories Market:

  • The development of hybrid automotive seating accessories that combine multiple technologies such as sensor based seat temperature controls.
  • The use of automotive seating accessories in improving safety of vehicle with additions like child seat locks and improved safety belt functions.
Attributes Details
Automotive seating accessories Market Size (2023) US$ 21.5 billion
Automotive seating accessories Market Projected Size (2033) US$ 30.3 billion
Value CAGR (2023 to 2033) 3.5%

Don't pay for what you don't need

Customize your report by selecting specific countries or regions and save 30%!

2018 to 2022 Automotive Seating Accessories Demand Outlook Compared to 2023 to 2033 Forecast

From 2018 to 2022, global automotive seating accessories market experienced a CAGR of 1.4%, reaching a market size of US$ 21.5 billion in 2023.

From 2018 to 2022, global automotive seating accessories industry witnessed steady growth in the years of 2018 and 2019. Due to COVID-19 a very sharp reduction in the sales of automobile can be observed. The unexpected closure of the automobile industry and interruption in supply chain management worldwide caused a decline in number of vehicle sales, this number started improving again by the end of the year 2021 and incremented to a significant value by the end of 2022.

Future Forecast for Automotive Seating Accessories Industry

Looking ahead, the global automotive seating accessories industry is expected to rise at a CAGR of 3.5% from 2023 to 2033. Market size is expected to reach US$ 30.3 billion by the end of the forecast period.

Demand is expected to continue its growth trajectory during over the coming assessment period, driven by concerns over air pollution due to ICE vehicles and the rising demand for pollution free electric battery vehicles.

The market is likely to witness significant growth in the Asia Pacific region due to predominant growth of automotive and electric vehicle industry in China and India which contributes to a huge production and sales of automobile industry. Market growth can be considerably high in Europe and America as well because of very rapidly improving infrastructure for electric vehicle industry as many countries in this region target to ban ICE vehicles completely by 2035. It will create new opportunities for accessories market as because of the increased production of electrical vehicle fleet.

Nikhil Kaitwade
Nikhil Kaitwade

Principal Consultant

Talk to Analyst

Find your sweet spots for generating winning opportunities in this market.

Comparative View of the Automotive Seating Accessories Market

Automotive seating accessories Market:

Attributes Automotive seating accessories Market
CAGR (2023 to 2033) 3.5%
Market Value (2033) US$ 30.3 billion
Opportunity Increasing demand of the products lightweight, durable and customizable seat interiors which do not only improves the comfort but also protects the seating foundation.
Key Trends Increasing adoption of several new materials which are easy to clean, durable, lightweight and recyclable/ reusable.

Automotive Fog Light Market:

Attributes Automotive Fog Light Market
CAGR (2023 to 2033) 7.8 %
Market Value (2033) US$ 8.7 billion
Opportunity A rising number of automotive sales and worldwide shift of rural to urban population will create rewarding opportunities.
Key Trends Use of LED fog lights over conventional lights as it provides an advantage of used as daytime running light.

Automotive Sensor Market:

Attributes Automotive Sensor Market
CAGR (2023 to 2033) 8.6%
Market Value (2033) US$ 44.0 billion
Opportunity Launching of new products with high sensing impact sensing capabilities which can quickly predict the intensity of impact will present profitable growth opportunities.
Key Trends Development of sensors and digital supporting system for quick actions to trigger safety mechanisms in least possible fraction of time.

Country-Wise Insights

Automotive seating accessories Market to Surge in China because of its rapidly growing automobile market

Country China
Market Size (US$ billion) by End of Forecast Period (2033) US$ 10.1 billion
CAGR % 2023 to End of Forecast (2033) 4.1%

The automotive seating accessories industry in china is expected to reach a market share of US$ 10.1 billion by 2033, expanding at a CAGR of 4.1%. The automotive seating accessories industry in china is expected to witness growth due to the increasing focus on pollution free vehicles. Additionally, there are a few other factors expected to drive the demand for automotive seating accessories in the country are:

  • The presence of a large number of manufacturers as well as consumers.
  • The abundance of raw material and supporting industry.

Market Growth Due to Rising Demand for Automotive seating accessories in the United States of America

Country The United States of America
Market Size (US$ billion) by End of Forecast Period (2033) US$ 3.4 billion
CAGR % 2023 to End of Forecast (2033) 3%

The automotive seating accessories industry in the United States is expected to reach a market share of US$ 3.4 billion, expanding at a CAGR of 3% during the forecast period. The United States market is projected to experience growth owing to the rising demand for automotive seating accessories because of its heavy transformation of ICE vehicle to EV and PHEV.

Notable Growth Expected in India’s Automotive seating accessories Market

Country India
Market Size (US$ billion) by End of Forecast Period (2033) US$ 3.1 billion
CAGR % 2023 to End of Forecast (2033) 4.8%

The automotive seating accessories industry in India is anticipated to reach a market share of US$ 3.1 billion, moving at a CAGR of 4.8 % during the forecast period. The automotive seating accessories industry in India is expected to grow prominently due to the increasing demand for vehicle caused by increasing number of shift of rural to urban population.
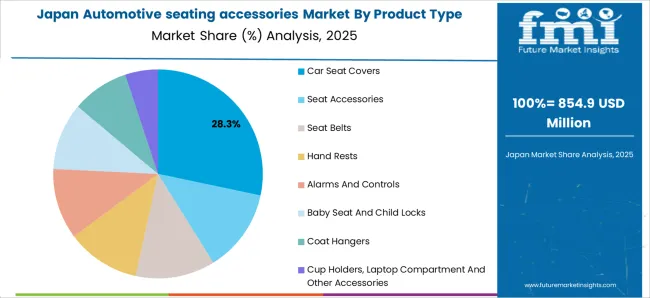
Increasing Adoption of Automotive seating accessories in Various Industries to Drive Market Growth in Japan

Country Japan
Market Size (US$ billion) by End of Forecast Period (2033) US$ 1.7 billion
CAGR % 2023 to End of Forecast (2033) 2.3%

The automotive seating accessories industry in Japan is estimated to reach a market share of US$ 1.7 billion by 2033, thriving at a CAGR of 2.3%. The growth of Japanese industry will see a constant rise due to the worldwide popularity and recognitions of brands like Toyota contributing to a major share of sales in the market.
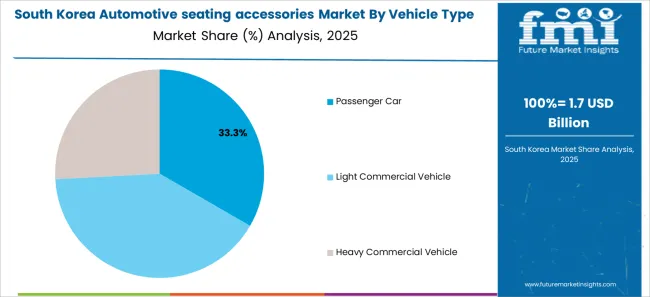
Demand for Automotive seating Accessories in Germany’s Market Growth

Country South Korea
Market Size (US$ billion) by End of Forecast Period (2033) US$ 1.2 billion
CAGR % 2023 to End of Forecast (2033) 2.7 %

The automotive seating accessories industry in South Korea is expected to reach a market share of US$ 1.2 billion, expanding at a CAGR of 2.7% during the forecast period.

Get the data you need at a Fraction of the cost

Personalize your report by choosing insights you need
and save 40%!

Category-Wise Insights

Seat Covers Segment to Dominate Automotive Seating Accessories Industry with 3.9% CAGR through 2033

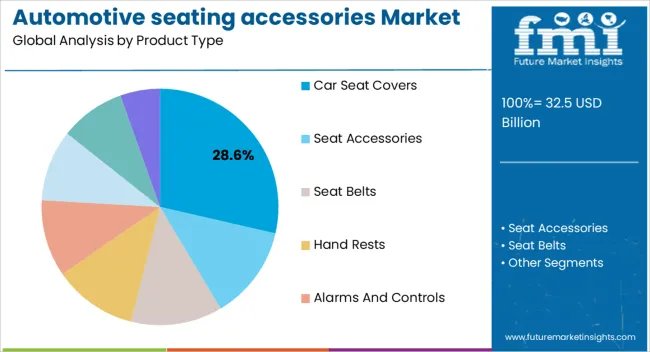
The seat cover segment is expected to dominate the automotive seating accessories industry with a CAGR of 3.9% from 2022 to 2033. This segment captures a significant market share in 2023 due to its cost-effectiveness, high durability, customizability and low maintenance requirements.

The seat cover segment includes a wide range of different materials and technologies like climate adjusted thermal seats. This segment also includes seat covers which provides an additional compartments for documents, laptops etc. which improves its utility.

How the Seat Cover Industry is Driving the Automotive Seating Accessories Market?

The power generation industry is expected to dominate the automotive seating accessories industry with a CAGR of 3.9% from 2022 to 2033. This segment captures a significant market share in 2023 due to the high demand for comfort along with the visual appearance of the vehicle.

The growing spending capacity and developing material industry are primarily promoting the market growth. Automotive seating accessories are crucial part of the vehicle aesthetic which is a major deciding factor behind vehicle purchase for a potential buyer.
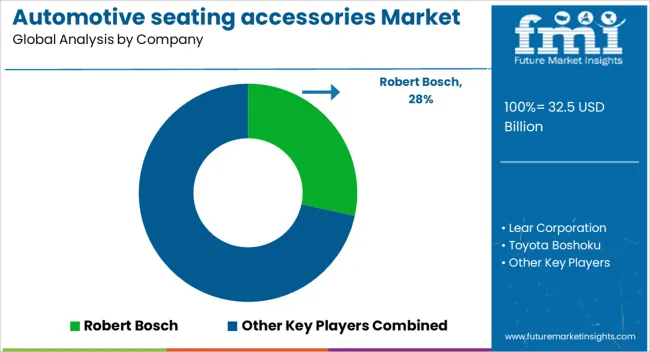
How Key Players Stay Competitive in the Automotive Seating Accessories Industry?

The automotive seating accessories industry is highly competitive, with numerous players vying for market share. In such a scenario, key players must adopt effective strategies to stay ahead of the competition.

Key Strategies Adopted by the Players

  • Product Innovation

Many companies are put a foot forward in making intelligent seating which gives a thermal comfort by sensing the climate conditions. This type of seating facility uses the software to create personalized climate using surrounding cabin climate to deliver optimized comfort.

  • Strategic Partnerships and Collaborations

Key players in the industry often form strategic partnerships and collaborations with other companies to leverage their strengths and expand their reach in the market. Recent example is collaboration of Gentherm and Lear Corp. for smart seating.

  • Expansion into Emerging Markets through Joint Ventures

The automotive seating accessories industry mainly adopts an option of joint ventures with a local player to acquire a regional market base and it also given an international exposure to the domestic player

Key Players in the Automotive Seating Accessories Industry

  • Robert Bosch
  • Lear Corporation
  • Toyota Boshoku.
  • Phoenix seating Ltd.
  • Denso Corporation.

Key Developments in the Automotive Seating Accessories Market:

  • Integrated collision detection technology by Robert Bosch enable more accurate and reliable triggering of safety seat belts. This system algorithm is able to detect the impact at its very early stage and automatically make the restraint devices function in order to have a least possible damage at the time of collision.
  • A pneumatic seat system developed by continental automotive provides an additional comfort via integrated air cells into the backrest to adjust the cushioning to the body shape.

Segmentation Analysis of the automotive seating accessories Market

By Product Type:

  • Car seat covers
    • Conventional Materials
    • Synthetic Materials
  • Seat Accessories
    • Front Seat Accessories
    • Rear Seat Accessories
  • Seat Belts
  • Hand Rests
  • Alarms and controls
  • Baby Seat and child locks
  • Coat Hangers
  • Cup holders, Laptop Compartment and other accessories.

By Vehicle Type:

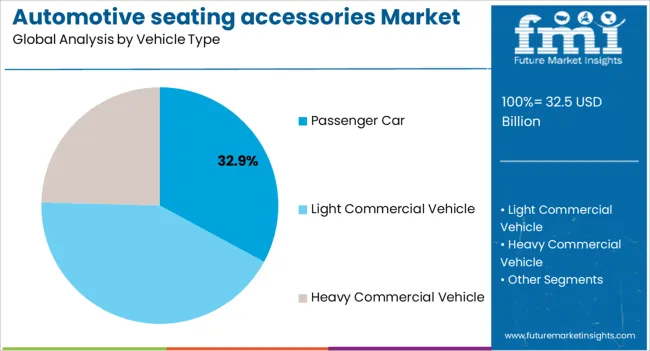
  • Passenger car
    • Compact
    • Hatchbacks
    • SUVs
    • Luxury
  • Light Commercial Vehicle
  • Heavy Commercial Vehicle

By Sales Channel:

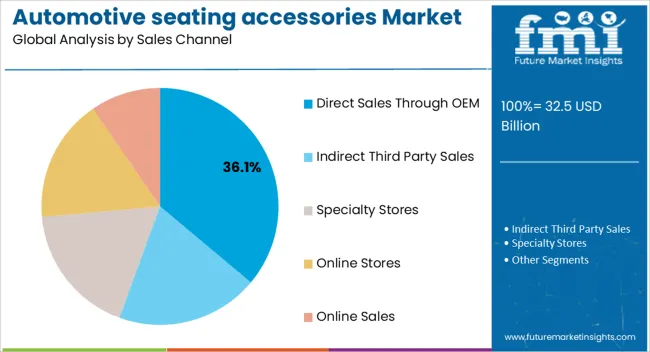
  • Direct sales through OEM
  • Indirect third party sales
  • Specialty stores
  • Online stores.
  • Online sales.

By Region:

  • North America
  • Latin America
  • Eastern Europe
  • Western Europe
  • East Asia
  • South Asia & Pacific
  • The Middle East & Africa

Frequently Asked Questions

What is the Current Worth of the Automotive seating accessories Market?

The global automotive seating accessories industry is expected to hit a value of US$ 21.5 billion by 2023.

How is the Demand for Automotive seating accessories Increasing?

The automotive seating accessories demand is set to expand by a CAGR of 3.5% during the assessment period.

Which industry Holds the Notable Market Share in the Global Automotive seating accessories Market?

The car seat covers followed by seat belt industry is to hold the dominant share of the market.

What is the estimated Valuation of the Automotive seating accessories Market by 2033?

The market is predicted to exceed US$ 30.32 billion by 2033.

Which is the Most Profitable Region for the Automotive Seating Accessories Industry?

China offers key opportunities for new entrants in the automotive seating accessories industry.

Table of Content

1. Executive Summary

    1.1. Global Market Outlook

    1.2. Demand-side Trends

    1.3. Supply-side Trends

    1.4. Technology Roadmap Analysis

    1.5. Analysis and Recommendations

2. Market Overview

    2.1. Market Coverage / Taxonomy

    2.2. Market Definition / Scope / Limitations

3. Market Background

    3.1. Market Dynamics

        3.1.1. Drivers

        3.1.2. Restraints

        3.1.3. Opportunity

        3.1.4. Trends

    3.2. Scenario Forecast

        3.2.1. Demand in Optimistic Scenario

        3.2.2. Demand in Likely Scenario

        3.2.3. Demand in Conservative Scenario

    3.3. Macroeconomic Factors

    3.4. Forecast Factors

    3.5. Value Chain Analysis

4. Global Market Analysis 2018 to 2022 and Forecast 2023 to 2033, By Product Type

    4.1. Introduction / Key Findings

    4.2. Historical Market Size Value (US$ Million) & Volume (Tons) Analysis By Product Type, 2018 to 2022

    4.3. Current and Future Market Size Value (US$ Million) & Volume (Tons) Analysis and Forecast By Product Type, 2023 to 2033

        4.3.1. Car Seat Covers

            4.3.1.1. Conventional Materials

            4.3.1.2. Synthetic Materials

        4.3.2. Seat Accessories

            4.3.2.1. Front Seat

            4.3.2.2. Rare Seat

        4.3.3. Seat belts

        4.3.4. Hand Rests

        4.3.5. Alarms and Controls

        4.3.6. Baby Seat and Child Lock

        4.3.7. Coat Hangers

        4.3.8. Cup Holder, Laptop Compartment and Other Accessories

    4.4. Y-o-Y Growth Trend Analysis By Product Type, 2018 to 2022

    4.5. Absolute $ Opportunity Analysis By Product Type, 2023 to 2033

5. Global Market Analysis 2018 to 2022 and Forecast 2023 to 2033, By Vehicle Type

    5.1. Introduction / Key Findings

    5.2. Historical Market Size Value (US$ Million) & Volume (Tons) Analysis By Vehicle Type, 2018 to 2022

    5.3. Current and Future Market Size Value (US$ Million) & Volume (Tons) Analysis and Forecast By Vehicle Type, 2023 to 2033

        5.3.1. Passenger Car

            5.3.1.1. Compact

            5.3.1.2. Hatchback

            5.3.1.3. SUVs

            5.3.1.4. Luxury

        5.3.2. Light Commercial Vehicle

        5.3.3. Heavy Commercial Vehicle

    5.4. Y-o-Y Growth Trend Analysis By Vehicle Type, 2018 to 2022

    5.5. Absolute $ Opportunity Analysis By Vehicle Type, 2023 to 2033

6. Global Market Analysis 2018 to 2022 and Forecast 2023 to 2033, By Sales Channel

    6.1. Introduction / Key Findings

    6.2. Historical Market Size Value (US$ Million) & Volume (Tons) Analysis By Sales Channel, 2018 to 2022

    6.3. Current and Future Market Size Value (US$ Million) & Volume (Tons) Analysis and Forecast By Sales Channel, 2023 to 2033

        6.3.1. Direct Sales through OEM

        6.3.2. Indirect Third Party Sales

            6.3.2.1. Spciality Stores

            6.3.2.2. Online Stores

            6.3.2.3. Online Sales

    6.4. Y-o-Y Growth Trend Analysis By Sales Channel, 2018 to 2022

    6.5. Absolute $ Opportunity Analysis By Sales Channel, 2023 to 2033

7. Global Market Analysis 2018 to 2022 and Forecast 2023 to 2033, By Region

    7.1. Introduction

    7.2. Historical Market Size Value (US$ Million) & Volume (Tons) Analysis By Region, 2018 to 2022

    7.3. Current Market Size Value (US$ Million) & Volume (Tons) Analysis and Forecast By Region, 2023 to 2033

        7.3.1. North America

        7.3.2. Latin America

        7.3.3. Western Europe

        7.3.4. Eastern Europe

        7.3.5. East Asia

        7.3.6. South Asia

        7.3.7. MEA

    7.4. Market Attractiveness Analysis By Region

8. North America Market Analysis 2018 to 2022 and Forecast 2023 to 2033, By Country

    8.1. Historical Market Size Value (US$ Million) & Volume (Tons) Trend Analysis By Market Taxonomy, 2018 to 2022

    8.2. Market Size Value (US$ Million) & Volume (Tons) Forecast By Market Taxonomy, 2023 to 2033

        8.2.1. By Country

            8.2.1.1. U.S.

            8.2.1.2. Canada

        8.2.2. By Product Type

        8.2.3. By Vehicle Type

        8.2.4. By Sales Channel

    8.3. Market Attractiveness Analysis

        8.3.1. By Country

        8.3.2. By Product Type

        8.3.3. By Vehicle Type

        8.3.4. By Sales Channel

    8.4. Key Takeaways

9. Latin America Market Analysis 2018 to 2022 and Forecast 2023 to 2033, By Country

    9.1. Historical Market Size Value (US$ Million) & Volume (Tons) Trend Analysis By Market Taxonomy, 2018 to 2022

    9.2. Market Size Value (US$ Million) & Volume (Tons) Forecast By Market Taxonomy, 2023 to 2033

        9.2.1. By Country

            9.2.1.1. Brazil

            9.2.1.2. Mexico

            9.2.1.3. Argentina

            9.2.1.4. Rest of Latin America

        9.2.2. By Product Type

        9.2.3. By Vehicle Type

        9.2.4. By Sales Channel

    9.3. Market Attractiveness Analysis

        9.3.1. By Country

        9.3.2. By Product Type

        9.3.3. By Vehicle Type

        9.3.4. By Sales Channel

    9.4. Key Takeaways

10. Western Europe Market Analysis 2018 to 2022 and Forecast 2023 to 2033, By Country

    10.1. Historical Market Size Value (US$ Million) & Volume (Tons) Trend Analysis By Market Taxonomy, 2018 to 2022

    10.2. Market Size Value (US$ Million) & Volume (Tons) Forecast By Market Taxonomy, 2023 to 2033

        10.2.1. By Country

            10.2.1.1. Germany

            10.2.1.2. Italy

            10.2.1.3. France

            10.2.1.4. U.K.

            10.2.1.5. Spain

            10.2.1.6. Nordics

            10.2.1.7. BENELUX

            10.2.1.8. Rest of Europe

        10.2.2. By Product Type

        10.2.3. By Vehicle Type

        10.2.4. By Sales Channel

    10.3. Market Attractiveness Analysis

        10.3.1. By Country

        10.3.2. By Product Type

        10.3.3. By Vehicle Type

        10.3.4. By Sales Channel

    10.4. Key Takeaways

11. Eastern Europe Market Analysis 2018 to 2022 and Forecast 2023 to 2033, By Country

    11.1. Historical Market Size Value (US$ Million) & Volume (Tons) Trend Analysis By Market Taxonomy, 2018 to 2022

    11.2. Market Size Value (US$ Million) & Volume (Tons) Forecast By Market Taxonomy, 2023 to 2033

        11.2.1. By Country

            11.2.1.1. Poland

            11.2.1.2. Hungry

            11.2.1.3. Romania

            11.2.1.4. Czech Republic

            11.2.1.5. Rest of EE

        11.2.2. By Product Type

        11.2.3. By Vehicle Type

        11.2.4. By Sales Channel

    11.3. Market Attractiveness Analysis

        11.3.1. By Country

        11.3.2. By Product Type

        11.3.3. By Vehicle Type

        11.3.4. By Sales Channel

    11.4. Key Takeaways

12. East Asia Market Analysis 2018 to 2022 and Forecast 2023 to 2033, By Country

    12.1. Historical Market Size Value (US$ Million) & Volume (Tons) Trend Analysis By Market Taxonomy, 2018 to 2022

    12.2. Market Size Value (US$ Million) & Volume (Tons) Forecast By Market Taxonomy, 2023 to 2033

        12.2.1. By Country

            12.2.1.1. China

            12.2.1.2. Japan

            12.2.1.3. South Korea

            12.2.1.4. Indonesia

            12.2.1.5. Rest of South Asia

        12.2.2. By Product Type

        12.2.3. By Vehicle Type

        12.2.4. By Sales Channel

    12.3. Market Attractiveness Analysis

        12.3.1. By Country

        12.3.2. By Product Type

        12.3.3. By Vehicle Type

        12.3.4. By Sales Channel

    12.4. Key Takeaways

13. South Asia Market Analysis 2018 to 2022 and Forecast 2023 to 2033, By Country

    13.1. Historical Market Size Value (US$ Million) & Volume (Tons) Trend Analysis By Market Taxonomy, 2018 to 2022

    13.2. Market Size Value (US$ Million) & Volume (Tons) Forecast By Market Taxonomy, 2023 to 2033

        13.2.1. By Country

            13.2.1.1. India

            13.2.1.2. ASEAN

            13.2.1.3. ANZ

            13.2.1.4. Rest of SAP

        13.2.2. By Product Type

        13.2.3. By Vehicle Type

        13.2.4. By Sales Channel

    13.3. Market Attractiveness Analysis

        13.3.1. By Country

        13.3.2. By Product Type

        13.3.3. By Vehicle Type

        13.3.4. By Sales Channel

    13.4. Key Takeaways

14. MEA Market Analysis 2018 to 2022 and Forecast 2023 to 2033, By Country

    14.1. Historical Market Size Value (US$ Million) & Volume (Tons) Trend Analysis By Market Taxonomy, 2018 to 2022

    14.2. Market Size Value (US$ Million) & Volume (Tons) Forecast By Market Taxonomy, 2023 to 2033

        14.2.1. By Country

            14.2.1.1. GCC Countries

            14.2.1.2. Turkeye

            14.2.1.3. North Africa

            14.2.1.4. South Africa

            14.2.1.5. Rest of MEA

        14.2.2. By Product Type

        14.2.3. By Vehicle Type

        14.2.4. By Sales Channel

    14.3. Market Attractiveness Analysis

        14.3.1. By Country

        14.3.2. By Product Type

        14.3.3. By Vehicle Type

        14.3.4. By Sales Channel

    14.4. Key Takeaways

15. Key Countries Market Analysis

    15.1. China

        15.1.1. Pricing Analysis

        15.1.2. Market Share Analysis, 2021

            15.1.2.1. By Product Type

            15.1.2.2. By Vehicle Type

            15.1.2.3. By Sales Channel

    15.2. Value (US$ Million) & Volume (Tons)ed States

        15.2.1. Pricing Analysis

        15.2.2. Market Share Analysis, 2021

            15.2.2.1. By Product Type

            15.2.2.2. By Vehicle Type

            15.2.2.3. By Sales Channel

    15.3. India

        15.3.1. Pricing Analysis

        15.3.2. Market Share Analysis, 2021

            15.3.2.1. By Product Type

            15.3.2.2. By Vehicle Type

            15.3.2.3. By Sales Channel

    15.4. Japan

        15.4.1. Pricing Analysis

        15.4.2. Market Share Analysis, 2021

            15.4.2.1. By Product Type

            15.4.2.2. By Vehicle Type

            15.4.2.3. By Sales Channel

    15.5. South Korea

        15.5.1. Pricing Analysis

        15.5.2. Market Share Analysis, 2021

            15.5.2.1. By Product Type

            15.5.2.2. By Vehicle Type

            15.5.2.3. By Sales Channel

16. Market Structure Analysis

    16.1. Competition Dashboard

    16.2. Competition Benchmarking

    16.3. Market Share Analysis of Top Players

        16.3.1. By Regional

        16.3.2. By Product Type

        16.3.3. By Vehicle Type

        16.3.4. By Sales Channel

17. Competition Analysis

    17.1. Competition Deep Dive

        17.1.1. T.S. tech co. ltd.

            17.1.1.1. Overview

            17.1.1.2. Product Portfolio

            17.1.1.3. Profitability by Market Segments (Product/Age /Sales Channel/Region)

            17.1.1.4. Sales Footprint

            17.1.1.5. Strategy Overview

                17.1.1.5.1. Marketing Strategy

                17.1.1.5.2. Product Strategy

                17.1.1.5.3. Channel Strategy

                17.1.1.5.4. Overview0

        17.1.2. Aisin

            17.1.2.1. Overview

            17.1.2.2. Product Portfolio

            17.1.2.3. Profitability by Market Segments (Product/Age /Sales Channel/Region)

            17.1.2.4. Sales Footprint

            17.1.2.5. Strategy Overview

                17.1.2.5.1. Marketing Strategy

                17.1.2.5.2. Product Strategy

                17.1.2.5.3. Channel Strategy

                17.1.2.5.4. Overview0

        17.1.3. Toyota boshoku

            17.1.3.1. Overview

            17.1.3.2. Product Portfolio

            17.1.3.3. Profitability by Market Segments (Product/Age /Sales Channel/Region)

            17.1.3.4. Sales Footprint

            17.1.3.5. Strategy Overview

                17.1.3.5.1. Marketing Strategy

                17.1.3.5.2. Product Strategy

                17.1.3.5.3. Channel Strategy

                17.1.3.5.4. Overview0

        17.1.4. Adient,

            17.1.4.1. Overview

            17.1.4.2. Product Portfolio

            17.1.4.3. Profitability by Market Segments (Product/Age /Sales Channel/Region)

            17.1.4.4. Sales Footprint

            17.1.4.5. Strategy Overview

                17.1.4.5.1. Marketing Strategy

                17.1.4.5.2. Product Strategy

                17.1.4.5.3. Channel Strategy

                17.1.4.5.4. Overview0

        17.1.5. Lear Corporation

            17.1.5.1. Overview

            17.1.5.2. Product Portfolio

            17.1.5.3. Profitability by Market Segments (Product/Age /Sales Channel/Region)

            17.1.5.4. Sales Footprint

            17.1.5.5. Strategy Overview

                17.1.5.5.1. Marketing Strategy

                17.1.5.5.2. Product Strategy

                17.1.5.5.3. Channel Strategy

                17.1.5.5.4. Overview0

        17.1.6. Aptiv

            17.1.6.1. Overview

            17.1.6.2. Product Portfolio

            17.1.6.3. Profitability by Market Segments (Product/Age /Sales Channel/Region)

            17.1.6.4. Sales Footprint

            17.1.6.5. Strategy Overview

                17.1.6.5.1. Marketing Strategy

                17.1.6.5.2. Product Strategy

                17.1.6.5.3. Channel Strategy

                17.1.6.5.4. Overview0

        17.1.7. Autoliv

            17.1.7.1. Overview

            17.1.7.2. Product Portfolio

            17.1.7.3. Profitability by Market Segments (Product/Age /Sales Channel/Region)

            17.1.7.4. Sales Footprint

            17.1.7.5. Strategy Overview

                17.1.7.5.1. Marketing Strategy

                17.1.7.5.2. Product Strategy

                17.1.7.5.3. Channel Strategy

                17.1.7.5.4. Overview0

        17.1.8. Denso Corporation

            17.1.8.1. Overview

            17.1.8.2. Product Portfolio

            17.1.8.3. Profitability by Market Segments (Product/Age /Sales Channel/Region)

            17.1.8.4. Sales Footprint

            17.1.8.5. Strategy Overview

                17.1.8.5.1. Marketing Strategy

                17.1.8.5.2. Product Strategy

                17.1.8.5.3. Channel Strategy

                17.1.8.5.4. Overview0

        17.1.9. Toshiba Corporation

            17.1.9.1. Overview

            17.1.9.2. Product Portfolio

            17.1.9.3. Profitability by Market Segments (Product/Age /Sales Channel/Region)

            17.1.9.4. Sales Footprint

            17.1.9.5. Strategy Overview

                17.1.9.5.1. Marketing Strategy

                17.1.9.5.2. Product Strategy

                17.1.9.5.3. Channel Strategy

                17.1.9.5.4. Overview0

        17.1.10. Robert Bosch

            17.1.10.1. Overview

            17.1.10.2. Product Portfolio

            17.1.10.3. Profitability by Market Segments (Product/Age /Sales Channel/Region)

            17.1.10.4. Sales Footprint

            17.1.10.5. Strategy Overview

                17.1.10.5.1. Marketing Strategy

                17.1.10.5.2. Product Strategy

                17.1.10.5.3. Channel Strategy

                17.1.10.5.4. Overview0

        17.1.11. Goodbaby international Holdings

            17.1.11.1. Overview

            17.1.11.2. Product Portfolio

            17.1.11.3. Profitability by Market Segments (Product/Age /Sales Channel/Region)

            17.1.11.4. Sales Footprint

            17.1.11.5. Strategy Overview

                17.1.11.5.1. Marketing Strategy

                17.1.11.5.2. Product Strategy

                17.1.11.5.3. Channel Strategy

                17.1.11.5.4. Overview0

        17.1.12. Newell brands

            17.1.12.1. Overview

            17.1.12.2. Product Portfolio

            17.1.12.3. Profitability by Market Segments (Product/Age /Sales Channel/Region)

            17.1.12.4. Sales Footprint

            17.1.12.5. Strategy Overview

                17.1.12.5.1. Marketing Strategy

                17.1.12.5.2. Product Strategy

                17.1.12.5.3. Channel Strategy

                17.1.12.5.4. Overview0

        17.1.13. RECARDO holdings Gmbh

            17.1.13.1. Overview

            17.1.13.2. Product Portfolio

            17.1.13.3. Profitability by Market Segments (Product/Age /Sales Channel/Region)

            17.1.13.4. Sales Footprint

            17.1.13.5. Strategy Overview

                17.1.13.5.1. Marketing Strategy

                17.1.13.5.2. Product Strategy

                17.1.13.5.3. Channel Strategy

                17.1.13.5.4. Overview0

        17.1.14. Company20

18. Assumptions & Acronyms Used

19. Research Methodology

List of Tables

Figure 1: Global Market Value (US$ Million) by Product Type, 2023 & 2033

Figure 2: Global Market Value (US$ Million) by Vehicle Type, 2023 & 2033

Figure 3: Global Market Value (US$ Million) by Sales Channel, 2023 & 2033

Figure 4: Global Market Value (US$ Million) by Region, 2023 & 2033

Figure 5: Global Market Value (US$ Million) Analysis by Region, 2018 & 2032

Figure 6: Global Market Volume (Tons) Analysis by Region, 2018 & 2032

Figure 7: Global Market Value Share (%) and BPS Analysis by Region, 2023 & 2033

Figure 8: Global Market Y-o-Y Growth (%) Projections by Region, 2023 to 2033

Figure 9: Global Market Value (US$ Million) Analysis by Product Type, 2018 & 2032

Figure 10: Global Market Volume (Tons) Analysis by Product Type, 2018 & 2032

Figure 11: Global Market Value Share (%) and BPS Analysis by Product Type, 2023 & 2033

Figure 12: Global Market Y-o-Y Growth (%) Projections by Product Type, 2023 to 2033

Figure 13: Global Market Value (US$ Million) Analysis by Vehicle Type, 2018 & 2032

Figure 14: Global Market Volume (Tons) Analysis by Vehicle Type, 2018 & 2032

Figure 15: Global Market Value Share (%) and BPS Analysis by Vehicle Type, 2023 & 2033

Figure 16: Global Market Y-o-Y Growth (%) Projections by Vehicle Type, 2023 to 2033

Figure 17: Global Market Value (US$ Million) Analysis by Sales Channel, 2018 & 2032

Figure 18: Global Market Volume (Tons) Analysis by Sales Channel, 2018 & 2032

Figure 19: Global Market Value Share (%) and BPS Analysis by Sales Channel, 2023 & 2033

Figure 20: Global Market Y-o-Y Growth (%) Projections by Sales Channel, 2023 to 2033

Figure 21: Global Market Attractiveness by Product Type, 2023 to 2033

Figure 22: Global Market Attractiveness by Vehicle Type, 2023 to 2033

Figure 23: Global Market Attractiveness by Sales Channel, 2023 to 2033

Figure 24: Global Market Attractiveness by Region, 2023 to 2033

Figure 25: North America Market Value (US$ Million) by Product Type, 2023 & 2033

Figure 26: North America Market Value (US$ Million) by Vehicle Type, 2023 & 2033

Figure 27: North America Market Value (US$ Million) by Sales Channel, 2023 & 2033

Figure 28: North America Market Value (US$ Million) by Country, 2023 & 2033

Figure 29: North America Market Value (US$ Million) Analysis by Country, 2018 & 2032

Figure 30: North America Market Volume (Tons) Analysis by Country, 2018 & 2032

Figure 31: North America Market Value Share (%) and BPS Analysis by Country, 2023 & 2033

Figure 32: North America Market Y-o-Y Growth (%) Projections by Country, 2023 to 2033

Figure 33: North America Market Value (US$ Million) Analysis by Product Type, 2018 & 2032

Figure 34: North America Market Volume (Tons) Analysis by Product Type, 2018 & 2032

Figure 35: North America Market Value Share (%) and BPS Analysis by Product Type, 2023 & 2033

Figure 36: North America Market Y-o-Y Growth (%) Projections by Product Type, 2023 to 2033

Figure 37: North America Market Value (US$ Million) Analysis by Vehicle Type, 2018 & 2032

Figure 38: North America Market Volume (Tons) Analysis by Vehicle Type, 2018 & 2032

Figure 39: North America Market Value Share (%) and BPS Analysis by Vehicle Type, 2023 & 2033

Figure 40: North America Market Y-o-Y Growth (%) Projections by Vehicle Type, 2023 to 2033

Figure 41: North America Market Value (US$ Million) Analysis by Sales Channel, 2018 & 2032

Figure 42: North America Market Volume (Tons) Analysis by Sales Channel, 2018 & 2032

Figure 43: North America Market Value Share (%) and BPS Analysis by Sales Channel, 2023 & 2033

Figure 44: North America Market Y-o-Y Growth (%) Projections by Sales Channel, 2023 to 2033

Figure 45: North America Market Attractiveness by Product Type, 2023 to 2033

Figure 46: North America Market Attractiveness by Vehicle Type, 2023 to 2033

Figure 47: North America Market Attractiveness by Sales Channel, 2023 to 2033

Figure 48: North America Market Attractiveness by Country, 2023 to 2033

Figure 49: Latin America Market Value (US$ Million) by Product Type, 2023 & 2033

Figure 50: Latin America Market Value (US$ Million) by Vehicle Type, 2023 & 2033

Figure 51: Latin America Market Value (US$ Million) by Sales Channel, 2023 & 2033

Figure 52: Latin America Market Value (US$ Million) by Country, 2023 & 2033

Figure 53: Latin America Market Value (US$ Million) Analysis by Country, 2018 & 2032

Figure 54: Latin America Market Volume (Tons) Analysis by Country, 2018 & 2032

Figure 55: Latin America Market Value Share (%) and BPS Analysis by Country, 2023 & 2033

Figure 56: Latin America Market Y-o-Y Growth (%) Projections by Country, 2023 to 2033

Figure 57: Latin America Market Value (US$ Million) Analysis by Product Type, 2018 & 2032

Figure 58: Latin America Market Volume (Tons) Analysis by Product Type, 2018 & 2032

Figure 59: Latin America Market Value Share (%) and BPS Analysis by Product Type, 2023 & 2033

Figure 60: Latin America Market Y-o-Y Growth (%) Projections by Product Type, 2023 to 2033

Figure 61: Latin America Market Value (US$ Million) Analysis by Vehicle Type, 2018 & 2032

Figure 62: Latin America Market Volume (Tons) Analysis by Vehicle Type, 2018 & 2032

Figure 63: Latin America Market Value Share (%) and BPS Analysis by Vehicle Type, 2023 & 2033

Figure 64: Latin America Market Y-o-Y Growth (%) Projections by Vehicle Type, 2023 to 2033

Figure 65: Latin America Market Value (US$ Million) Analysis by Sales Channel, 2018 & 2032

Figure 66: Latin America Market Volume (Tons) Analysis by Sales Channel, 2018 & 2032

Figure 67: Latin America Market Value Share (%) and BPS Analysis by Sales Channel, 2023 & 2033

Figure 68: Latin America Market Y-o-Y Growth (%) Projections by Sales Channel, 2023 to 2033

Figure 69: Latin America Market Attractiveness by Product Type, 2023 to 2033

Figure 70: Latin America Market Attractiveness by Vehicle Type, 2023 to 2033

Figure 71: Latin America Market Attractiveness by Sales Channel, 2023 to 2033

Figure 72: Latin America Market Attractiveness by Country, 2023 to 2033

Figure 73: Western Europe Market Value (US$ Million) by Product Type, 2023 & 2033

Figure 74: Western Europe Market Value (US$ Million) by Vehicle Type, 2023 & 2033

Figure 75: Western Europe Market Value (US$ Million) by Sales Channel, 2023 & 2033

Figure 76: Western Europe Market Value (US$ Million) by Country, 2023 & 2033

Figure 77: Western Europe Market Value (US$ Million) Analysis by Country, 2018 & 2032

Figure 78: Western Europe Market Volume (Tons) Analysis by Country, 2018 & 2032

Figure 79: Western Europe Market Value Share (%) and BPS Analysis by Country, 2023 & 2033

Figure 80: Western Europe Market Y-o-Y Growth (%) Projections by Country, 2023 to 2033

Figure 81: Western Europe Market Value (US$ Million) Analysis by Product Type, 2018 & 2032

Figure 82: Western Europe Market Volume (Tons) Analysis by Product Type, 2018 & 2032

Figure 83: Western Europe Market Value Share (%) and BPS Analysis by Product Type, 2023 & 2033

Figure 84: Western Europe Market Y-o-Y Growth (%) Projections by Product Type, 2023 to 2033

Figure 85: Western Europe Market Value (US$ Million) Analysis by Vehicle Type, 2018 & 2032

Figure 86: Western Europe Market Volume (Tons) Analysis by Vehicle Type, 2018 & 2032

Figure 87: Western Europe Market Value Share (%) and BPS Analysis by Vehicle Type, 2023 & 2033

Figure 88: Western Europe Market Y-o-Y Growth (%) Projections by Vehicle Type, 2023 to 2033

Figure 89: Western Europe Market Value (US$ Million) Analysis by Sales Channel, 2018 & 2032

Figure 90: Western Europe Market Volume (Tons) Analysis by Sales Channel, 2018 & 2032

Figure 91: Western Europe Market Value Share (%) and BPS Analysis by Sales Channel, 2023 & 2033

Figure 92: Western Europe Market Y-o-Y Growth (%) Projections by Sales Channel, 2023 to 2033

Figure 93: Western Europe Market Attractiveness by Product Type, 2023 to 2033

Figure 94: Western Europe Market Attractiveness by Vehicle Type, 2023 to 2033

Figure 95: Western Europe Market Attractiveness by Sales Channel, 2023 to 2033

Figure 96: Western Europe Market Attractiveness by Country, 2023 to 2033

Figure 97: Eastern Europe Market Value (US$ Million) by Product Type, 2023 & 2033

Figure 98: Eastern Europe Market Value (US$ Million) by Vehicle Type, 2023 & 2033

Figure 99: Eastern Europe Market Value (US$ Million) by Sales Channel, 2023 & 2033

Figure 100: Eastern Europe Market Value (US$ Million) by Country, 2023 & 2033

Figure 101: Eastern Europe Market Value (US$ Million) Analysis by Country, 2018 & 2032

Figure 102: Eastern Europe Market Volume (Tons) Analysis by Country, 2018 & 2032

Figure 103: Eastern Europe Market Value Share (%) and BPS Analysis by Country, 2023 & 2033

Figure 104: Eastern Europe Market Y-o-Y Growth (%) Projections by Country, 2023 to 2033

Figure 105: Eastern Europe Market Value (US$ Million) Analysis by Product Type, 2018 & 2032

Figure 106: Eastern Europe Market Volume (Tons) Analysis by Product Type, 2018 & 2032

Figure 107: Eastern Europe Market Value Share (%) and BPS Analysis by Product Type, 2023 & 2033

Figure 108: Eastern Europe Market Y-o-Y Growth (%) Projections by Product Type, 2023 to 2033

Figure 109: Eastern Europe Market Value (US$ Million) Analysis by Vehicle Type, 2018 & 2032

Figure 110: Eastern Europe Market Volume (Tons) Analysis by Vehicle Type, 2018 & 2032

Figure 111: Eastern Europe Market Value Share (%) and BPS Analysis by Vehicle Type, 2023 & 2033

Figure 112: Eastern Europe Market Y-o-Y Growth (%) Projections by Vehicle Type, 2023 to 2033

Figure 113: Eastern Europe Market Value (US$ Million) Analysis by Sales Channel, 2018 & 2032

Figure 114: Eastern Europe Market Volume (Tons) Analysis by Sales Channel, 2018 & 2032

Figure 115: Eastern Europe Market Value Share (%) and BPS Analysis by Sales Channel, 2023 & 2033

Figure 116: Eastern Europe Market Y-o-Y Growth (%) Projections by Sales Channel, 2023 to 2033

Figure 117: Eastern Europe Market Attractiveness by Product Type, 2023 to 2033

Figure 118: Eastern Europe Market Attractiveness by Vehicle Type, 2023 to 2033

Figure 119: Eastern Europe Market Attractiveness by Sales Channel, 2023 to 2033

Figure 120: Eastern Europe Market Attractiveness by Country, 2023 to 2033

Figure 121: East Asia Market Value (US$ Million) by Product Type, 2023 & 2033

Figure 122: East Asia Market Value (US$ Million) by Vehicle Type, 2023 & 2033

Figure 123: East Asia Market Value (US$ Million) by Sales Channel, 2023 & 2033

Figure 124: East Asia Market Value (US$ Million) by Country, 2023 & 2033

Figure 125: East Asia Market Value (US$ Million) Analysis by Country, 2018 & 2032

Figure 126: East Asia Market Volume (Tons) Analysis by Country, 2018 & 2032

Figure 127: East Asia Market Value Share (%) and BPS Analysis by Country, 2023 & 2033

Figure 128: East Asia Market Y-o-Y Growth (%) Projections by Country, 2023 to 2033

Figure 129: East Asia Market Value (US$ Million) Analysis by Product Type, 2018 & 2032

Figure 130: East Asia Market Volume (Tons) Analysis by Product Type, 2018 & 2032

Figure 131: East Asia Market Value Share (%) and BPS Analysis by Product Type, 2023 & 2033

Figure 132: East Asia Market Y-o-Y Growth (%) Projections by Product Type, 2023 to 2033

Figure 133: East Asia Market Value (US$ Million) Analysis by Vehicle Type, 2018 & 2032

Figure 134: East Asia Market Volume (Tons) Analysis by Vehicle Type, 2018 & 2032

Figure 135: East Asia Market Value Share (%) and BPS Analysis by Vehicle Type, 2023 & 2033

Figure 136: East Asia Market Y-o-Y Growth (%) Projections by Vehicle Type, 2023 to 2033

Figure 137: East Asia Market Value (US$ Million) Analysis by Sales Channel, 2018 & 2032

Figure 138: East Asia Market Volume (Tons) Analysis by Sales Channel, 2018 & 2032

Figure 139: East Asia Market Value Share (%) and BPS Analysis by Sales Channel, 2023 & 2033

Figure 140: East Asia Market Y-o-Y Growth (%) Projections by Sales Channel, 2023 to 2033

Figure 141: East Asia Market Attractiveness by Product Type, 2023 to 2033

Figure 142: East Asia Market Attractiveness by Vehicle Type, 2023 to 2033

Figure 143: East Asia Market Attractiveness by Sales Channel, 2023 to 2033

Figure 144: East Asia Market Attractiveness by Country, 2023 to 2033

Figure 145: South Asia Market Value (US$ Million) by Product Type, 2023 & 2033

Figure 146: South Asia Market Value (US$ Million) by Vehicle Type, 2023 & 2033

Figure 147: South Asia Market Value (US$ Million) by Sales Channel, 2023 & 2033

Figure 148: South Asia Market Value (US$ Million) by Country, 2023 & 2033

Figure 149: South Asia Market Value (US$ Million) Analysis by Country, 2018 & 2032

Figure 150: South Asia Market Volume (Tons) Analysis by Country, 2018 & 2032

Figure 151: South Asia Market Value Share (%) and BPS Analysis by Country, 2023 & 2033

Figure 152: South Asia Market Y-o-Y Growth (%) Projections by Country, 2023 to 2033

Figure 153: South Asia Market Value (US$ Million) Analysis by Product Type, 2018 & 2032

Figure 154: South Asia Market Volume (Tons) Analysis by Product Type, 2018 & 2032

Figure 155: South Asia Market Value Share (%) and BPS Analysis by Product Type, 2023 & 2033

Figure 156: South Asia Market Y-o-Y Growth (%) Projections by Product Type, 2023 to 2033

Figure 157: South Asia Market Value (US$ Million) Analysis by Vehicle Type, 2018 & 2032

Figure 158: South Asia Market Volume (Tons) Analysis by Vehicle Type, 2018 & 2032

Figure 159: South Asia Market Value Share (%) and BPS Analysis by Vehicle Type, 2023 & 2033

Figure 160: South Asia Market Y-o-Y Growth (%) Projections by Vehicle Type, 2023 to 2033

Figure 161: South Asia Market Value (US$ Million) Analysis by Sales Channel, 2018 & 2032

Figure 162: South Asia Market Volume (Tons) Analysis by Sales Channel, 2018 & 2032

Figure 163: South Asia Market Value Share (%) and BPS Analysis by Sales Channel, 2023 & 2033

Figure 164: South Asia Market Y-o-Y Growth (%) Projections by Sales Channel, 2023 to 2033

Figure 165: South Asia Market Attractiveness by Product Type, 2023 to 2033

Figure 166: South Asia Market Attractiveness by Vehicle Type, 2023 to 2033

Figure 167: South Asia Market Attractiveness by Sales Channel, 2023 to 2033

Figure 168: South Asia Market Attractiveness by Country, 2023 to 2033

Figure 169: MEA Market Value (US$ Million) by Product Type, 2023 & 2033

Figure 170: MEA Market Value (US$ Million) by Vehicle Type, 2023 & 2033

Figure 171: MEA Market Value (US$ Million) by Sales Channel, 2023 & 2033

Figure 172: MEA Market Value (US$ Million) by Country, 2023 & 2033

Figure 173: MEA Market Value (US$ Million) Analysis by Country, 2018 & 2032

Figure 174: MEA Market Volume (Tons) Analysis by Country, 2018 & 2032

Figure 175: MEA Market Value Share (%) and BPS Analysis by Country, 2023 & 2033

Figure 176: MEA Market Y-o-Y Growth (%) Projections by Country, 2023 to 2033

Figure 177: MEA Market Value (US$ Million) Analysis by Product Type, 2018 & 2032

Figure 178: MEA Market Volume (Tons) Analysis by Product Type, 2018 & 2032

Figure 179: MEA Market Value Share (%) and BPS Analysis by Product Type, 2023 & 2033

Figure 180: MEA Market Y-o-Y Growth (%) Projections by Product Type, 2023 to 2033

Figure 181: MEA Market Value (US$ Million) Analysis by Vehicle Type, 2018 & 2032

Figure 182: MEA Market Volume (Tons) Analysis by Vehicle Type, 2018 & 2032

Figure 183: MEA Market Value Share (%) and BPS Analysis by Vehicle Type, 2023 & 2033

Figure 184: MEA Market Y-o-Y Growth (%) Projections by Vehicle Type, 2023 to 2033

Figure 185: MEA Market Value (US$ Million) Analysis by Sales Channel, 2018 & 2032

Figure 186: MEA Market Volume (Tons) Analysis by Sales Channel, 2018 & 2032

Figure 187: MEA Market Value Share (%) and BPS Analysis by Sales Channel, 2023 & 2033

Figure 188: MEA Market Y-o-Y Growth (%) Projections by Sales Channel, 2023 to 2033

Figure 189: MEA Market Attractiveness by Product Type, 2023 to 2033

Figure 190: MEA Market Attractiveness by Vehicle Type, 2023 to 2033

Figure 191: MEA Market Attractiveness by Sales Channel, 2023 to 2033

Figure 192: MEA Market Attractiveness by Country, 2023 to 2033

List of Charts

Table 1: Global Market Value (US$ Million) Forecast by Region, 2018 & 2033

Table 2: Global Market Volume (Tons) Forecast by Region, 2018 & 2033

Table 3: Global Market Value (US$ Million) Forecast by Product Type, 2018 & 2033

Table 4: Global Market Volume (Tons) Forecast by Product Type, 2018 & 2033

Table 5: Global Market Value (US$ Million) Forecast by Vehicle Type, 2018 & 2033

Table 6: Global Market Volume (Tons) Forecast by Vehicle Type, 2018 & 2033

Table 7: Global Market Value (US$ Million) Forecast by Sales Channel, 2018 & 2033

Table 8: Global Market Volume (Tons) Forecast by Sales Channel, 2018 & 2033

Table 9: North America Market Value (US$ Million) Forecast by Country, 2018 & 2033

Table 10: North America Market Volume (Tons) Forecast by Country, 2018 & 2033

Table 11: North America Market Value (US$ Million) Forecast by Product Type, 2018 & 2033

Table 12: North America Market Volume (Tons) Forecast by Product Type, 2018 & 2033

Table 13: North America Market Value (US$ Million) Forecast by Vehicle Type, 2018 & 2033

Table 14: North America Market Volume (Tons) Forecast by Vehicle Type, 2018 & 2033

Table 15: North America Market Value (US$ Million) Forecast by Sales Channel, 2018 & 2033

Table 16: North America Market Volume (Tons) Forecast by Sales Channel, 2018 & 2033

Table 17: Latin America Market Value (US$ Million) Forecast by Country, 2018 & 2033

Table 18: Latin America Market Volume (Tons) Forecast by Country, 2018 & 2033

Table 19: Latin America Market Value (US$ Million) Forecast by Product Type, 2018 & 2033

Table 20: Latin America Market Volume (Tons) Forecast by Product Type, 2018 & 2033

Table 21: Latin America Market Value (US$ Million) Forecast by Vehicle Type, 2018 & 2033

Table 22: Latin America Market Volume (Tons) Forecast by Vehicle Type, 2018 & 2033

Table 23: Latin America Market Value (US$ Million) Forecast by Sales Channel, 2018 & 2033

Table 24: Latin America Market Volume (Tons) Forecast by Sales Channel, 2018 & 2033

Table 25: Western Europe Market Value (US$ Million) Forecast by Country, 2018 & 2033

Table 26: Western Europe Market Volume (Tons) Forecast by Country, 2018 & 2033

Table 27: Western Europe Market Value (US$ Million) Forecast by Product Type, 2018 & 2033

Table 28: Western Europe Market Volume (Tons) Forecast by Product Type, 2018 & 2033

Table 29: Western Europe Market Value (US$ Million) Forecast by Vehicle Type, 2018 & 2033

Table 30: Western Europe Market Volume (Tons) Forecast by Vehicle Type, 2018 & 2033

Table 31: Western Europe Market Value (US$ Million) Forecast by Sales Channel, 2018 & 2033

Table 32: Western Europe Market Volume (Tons) Forecast by Sales Channel, 2018 & 2033

Table 33: Eastern Europe Market Value (US$ Million) Forecast by Country, 2018 & 2033

Table 34: Eastern Europe Market Volume (Tons) Forecast by Country, 2018 & 2033

Table 35: Eastern Europe Market Value (US$ Million) Forecast by Product Type, 2018 & 2033

Table 36: Eastern Europe Market Volume (Tons) Forecast by Product Type, 2018 & 2033

Table 37: Eastern Europe Market Value (US$ Million) Forecast by Vehicle Type, 2018 & 2033

Table 38: Eastern Europe Market Volume (Tons) Forecast by Vehicle Type, 2018 & 2033

Table 39: Eastern Europe Market Value (US$ Million) Forecast by Sales Channel, 2018 & 2033

Table 40: Eastern Europe Market Volume (Tons) Forecast by Sales Channel, 2018 & 2033

Table 41: East Asia Market Value (US$ Million) Forecast by Country, 2018 & 2033

Table 42: East Asia Market Volume (Tons) Forecast by Country, 2018 & 2033

Table 43: East Asia Market Value (US$ Million) Forecast by Product Type, 2018 & 2033

Table 44: East Asia Market Volume (Tons) Forecast by Product Type, 2018 & 2033

Table 45: East Asia Market Value (US$ Million) Forecast by Vehicle Type, 2018 & 2033

Table 46: East Asia Market Volume (Tons) Forecast by Vehicle Type, 2018 & 2033

Table 47: East Asia Market Value (US$ Million) Forecast by Sales Channel, 2018 & 2033

Table 48: East Asia Market Volume (Tons) Forecast by Sales Channel, 2018 & 2033

Table 49: South Asia Market Value (US$ Million) Forecast by Country, 2018 & 2033

Table 50: South Asia Market Volume (Tons) Forecast by Country, 2018 & 2033

Table 51: South Asia Market Value (US$ Million) Forecast by Product Type, 2018 & 2033

Table 52: South Asia Market Volume (Tons) Forecast by Product Type, 2018 & 2033

Table 53: South Asia Market Value (US$ Million) Forecast by Vehicle Type, 2018 & 2033

Table 54: South Asia Market Volume (Tons) Forecast by Vehicle Type, 2018 & 2033

Table 55: South Asia Market Value (US$ Million) Forecast by Sales Channel, 2018 & 2033

Table 56: South Asia Market Volume (Tons) Forecast by Sales Channel, 2018 & 2033

Table 57: MEA Market Value (US$ Million) Forecast by Country, 2018 & 2033

Table 58: MEA Market Volume (Tons) Forecast by Country, 2018 & 2033

Table 59: MEA Market Value (US$ Million) Forecast by Product Type, 2018 & 2033

Table 60: MEA Market Volume (Tons) Forecast by Product Type, 2018 & 2033

Table 61: MEA Market Value (US$ Million) Forecast by Vehicle Type, 2018 & 2033

Table 62: MEA Market Volume (Tons) Forecast by Vehicle Type, 2018 & 2033

Table 63: MEA Market Value (US$ Million) Forecast by Sales Channel, 2018 & 2033

Table 64: MEA Market Volume (Tons) Forecast by Sales Channel, 2018 & 2033

Explore Automotive Insights

View Reports

Automotive seating accessories Market